Not Much to Rely on: Racial Wealth Disparities in the Boston Metro Area 

Recently collected data reveal striking wealth gaps between the white population and different racial and ethnic groups in the Boston metropolitan area.


Despite increasing prosperity in the Boston metropolitan area, many families are being left out. The growing inequality is raising both moral and economic concerns and spurring calls for action.[1] In terms of inequality of income, Boston is one of the most unequal metro areas in the United States.[2] However, inequality of wealth (or net worth) in metro Boston is even more stark. (See "Defining Wealth.") Income may help families cover current needs, but wealth allows them to make investments in education, create businesses, deal with medical emergencies and job losses, and provide better opportunities for future generations.
At a 2014 Boston Fed conference, Federal Reserve chair Janet Yellen noted that widening wealth inequality is incompatible with "values rooted in our nation's history, among them the high value Americans have traditionally placed on equality of opportunity."[3] For Greater Boston, the financial well-being of communities of color is critical also because of minorities' importance in the region's economic and population growth.[4]
Previous national surveys that collect data on assets and debts have limitations: they do not provide data at the local level, and they classify different groups in broad categories such as white and black.[5] To address those shortcomings, the Boston Fed partnered with the Ford Foundation and Duke University's Consortium on Social Equity to bring the National Asset Scorecard for Communities of Color (NASCC) survey to Greater Boston.[6]
Assets
Let us consider the differences just among white, US black, Puerto Rican, and Dominican households.
Financial Assets
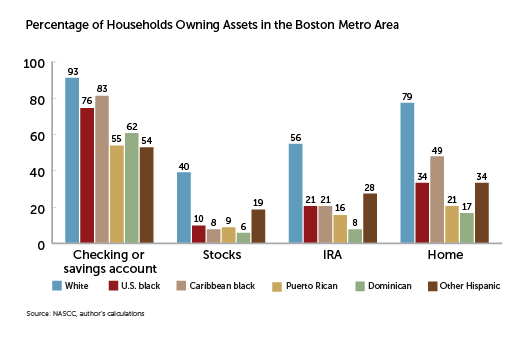
White households were more likely to hold every type of financial asset than US black, Puerto Rican, or Dominican households.[7] More than 93 percent of white households have either a savings or checking account; only 76 percent of blacks do, 55 percent of Puerto Ricans, and 62 percent of Dominicans. This means that about half of Puerto Ricans lack formal liquid savings for emergencies. Not being part of the banking sector has negative consequences in itself, the most obvious being the cost to cash a check and pay bills.[8]
Given that reality, it is not surprising that even fewer nonwhite families have stocks or private retirement accounts. What is surprising is how wide the difference is with white households. Whereas 40 percent of white families own stocks or mutual funds, less than 10 percent of US black, Puerto Rican, and Dominican families do. Very few nonwhite households have private retirement accounts either. Most white households (56 percent) own either an IRA or a private annuity, but only 21 percent of US blacks, 16 percent of Puerto Ricans, and 8 percent of Dominicans hold such accounts. Without Social Security, the vast majority would have virtually no financial assets for their retirement. (See "Percentage of Households Owning Assets in the Boston Metro Area.")
Homeownership
Homeownership is, by and large, the most important investment a family makes. Although it may not be the best option for everyone, the disparities in Boston are problematic since investing in a home can provide long-term returns that increase families' net worth. Nearly 80 percent of white households in the survey are homeowners; only about 34 percent of US blacks, 21 percent of Puerto Ricans, and 17 percent of Dominicans are. Moreover, of the households that report owning a home, white households are less likely to have an outstanding mortgage: 60 percent of white households have a mortgage, compared with more than 84 percent of US black, Puerto Rican, and Dominican households.
Debts
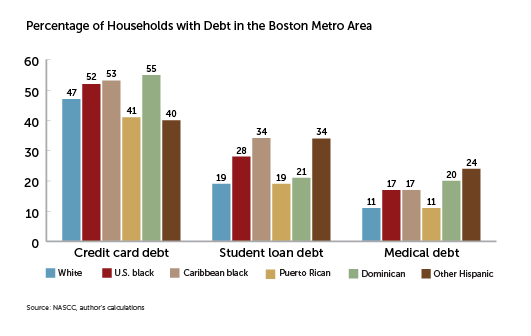
Assets are only one side of a family's balance sheet. To get the whole picture, we also need to look at liabilities. A family may have savings, but if it also has large amounts of debt, the net value of its assets is much smaller. US blacks, Dominicans, and Puerto Ricans were more likely than whites to hold unsecured debt such as a credit card, student loan, and medical debt.[9] Notably, 28 percent of black families have student loans, and only 19 percent of white households do. Dominicans are twice as likely as whites to have medical debt. (See "Percentage of Households with Debt in the Boston Metro Area.")
Defining Wealth
All families have to find a balance between what they own with what they owe. Wealth, or net worth, captures what families can use in case of emergencies or to invest for future gains. Income is a flow that provides a snapshot of a family's resources at a given point in time; wealth reflects the stock that a family accumulates. Net worth is measured by taking into account the difference between assets (liquid assets, such as savings and checking accounts, government bonds, stocks, and retirement accounts; and nonfinancial assets, such as homes and vehicles) and liabilities (including mortgages, auto loans, credit card debt, and family loans).
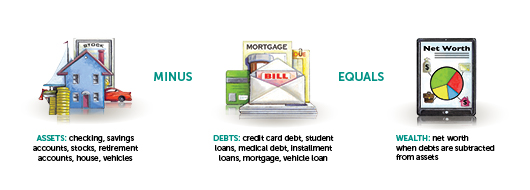
In short, wealth—total assets minus total debts—provides a snapshot of households' financial well-being. Nonwhite households have only a fraction of the wealth of white households. White households have a median wealth of $247,500; Dominicans and US blacks have a median wealth of close to zero.
Looking Forward
Implementing solutions that can address such huge wealth disparities is complicated and requires a multifaceted approach. One would have to dissect each of the components of wealth to prioritize policy solutions at either the local or national level.
Clearly, most Hispanic and black families don't have enough to rely on when faced with emergencies and even less to invest for the long term. Such differences will only widen over time unless measures to provide equal opportunity for less advantaged families are implemented. Policies should address discrimination in the housing and financial arenas, improve access to quality education and health services, incentivize both short- and long-term savings for lower-income families, and ensure that jobs provide not only fair pay but access to benefits. A look at policies that go beyond income inequality is needed.[10]
Ana Patricia Munoz is the director of community development research and communications in the Regional & Community Outreach department of the Federal Reserve Bank of Boston. Contact her at anapatricia.munoz@bos.frb.org.
Acknowledgement
This article is a summary of findings from Ana Patricia Munoz, Marlene Kim, Mariko Chang, Regine Jackson, Darrick Hamilton, and William Darity, "The Color of Wealth in Boston" (Community Development Discussion Paper, Federal Reserve Bank of Boston, Duke University, and the New School, 2015), www.bostonfed.org/color-of-wealth.
Endnotes
- See Katharine Bradbury and Robert K. Triest, "Inequality of Opportunity and Aggregate Economic Performance" (conference presentation, "Inequality of Economic Opportunity," Federal Reserve Bank of Boston, October 17—18, 2014), http://www.bostonfed.org/-/media/Documents/cb/PDF/bradbury-triest.pdf. The International Monetary Fund found that inequality dampens investment and growth, may lead to policies that hurt growth, and hampers poverty reduction. See https://www.imf.org/external/pubs/ft/sdn/2015/sdn1513.pdf. See also In It Together: Why Less Inequality Benefits All (Paris: Organisation for Economic Co-operation and Development Publishing, 2015), http://dx.doi.org/10.1787/9789264235120-en.
- See Alan Berube and Natalie Holmes, "Some Cities Are Still More Unequal Than Others" (report, Brookings Institution, Washington, DC, 2015), http://www.brookings.edu/research/reports2/2015/03/city-inequality-berube-holmes.
- See http://www.federalreserve.gov/newsevents/speech/yellen20141017a.htm.
- New England and Greater Boston population growth was entirely driven by increases in nonwhite population. Non-Hispanic whites declined 3 percent from 2000 to 2012 in the Boston area; the Hispanic and black population grew 58 percent and 33 percent, respectively.
- See http://www.federalreserve.gov/pubs/bulletin/2014/pdf/scf14.pdf and http://www.pewresearch.org/fact-tank/2014/12/12/racial-wealth-gaps-great-recession/. See also Rebecca Tippett et al., Beyond Broke: Why Closing the Racial Wealth Gap Is a Priority for National Economic Security (Durham, North Carolina: Duke Center for Global Policy Solutions, 2014), http://globalpolicysolutions.org/wp-content/uploads/2014/04/Beyond_Broke_FINAL.pdf; Thomas Shapiro, Tatjana Meschede, and Sam Osoro, The Roots of the Widening Racial Wealth Gap: Explaining the Black-White Economic Divide (Waltham, Massachusetts: Brandeis University Institute on Assets and Social Policy, 2013), http://iasp.brandeis.edu/pdfs/Author/shapiro-thomas-m/racialwealthgapbrief.pdf.
- The NASCC initiative involves surveys in Boston, Los Angeles, Miami, Tulsa, and Washington, DC. It delves beneath the standard information about the net worth of broadly defined ethnic groups. In Boston, it provides detailed data for Puerto Rican, Dominican, US black, Caribbean black, Cape Verdean, and white households. It also collected unconventional information, such as use of payday lending and remittances. The principal investigators of the NASCC initiative are Darrick Hamilton and William Darity.
- "Households" and "families" are used interchangeably. "Assets" include financial assets (savings and checking accounts, government bonds, stocks, and retirement accounts) and tangible assets such as homes and vehicles.
- Tyler Desmond and Charles Sprenger, "Estimating the Cost of Being Unbanked," Communities , Banking 18, no. 2 (spring 2007), https://www.bostonfed.org/-/media/Documents/cb/PDF/article9.pdf.
- None of those differences were statistically significant.
- In one promising example, the Boston Fed has been supporting efforts in the six New England states to establish children's savings accounts early in life. See http://www.bostonfed.org/commdev/childrens-savings-accounts/index.htm.
Articles may be reprinted if Communities & Banking and the author are credited and the following disclaimer is used: "The views expressed are not necessarily those of the Federal Reserve Bank of Boston or the Federal Reserve System. Information about organizations and upcoming events is strictly informational and not an endorsement."

 About the Authors
Ana Patricia Muñoz
Resources
Related Content
The Color of Wealth in Boston: A discussion about the urgency of addressing inequality and providing opportunity for all
Racial Wealth Disparities: Reconsidering the Roles of Human Capital and Inheritance
New England Study Group Past Meetings
Wealth Inequalities in Greater Boston: Do Race and Ethnicity Matter?