Combining Earnings with Public Supports: Cliff Effects in Massachusetts 

Rachel Bissett/Federal Reserve Bank of Boston
Safety-net benefits decrease as recipients’ income increases, but the result can be an overall drop in resources—sometimes so sharp that it feels like falling off a cliff.


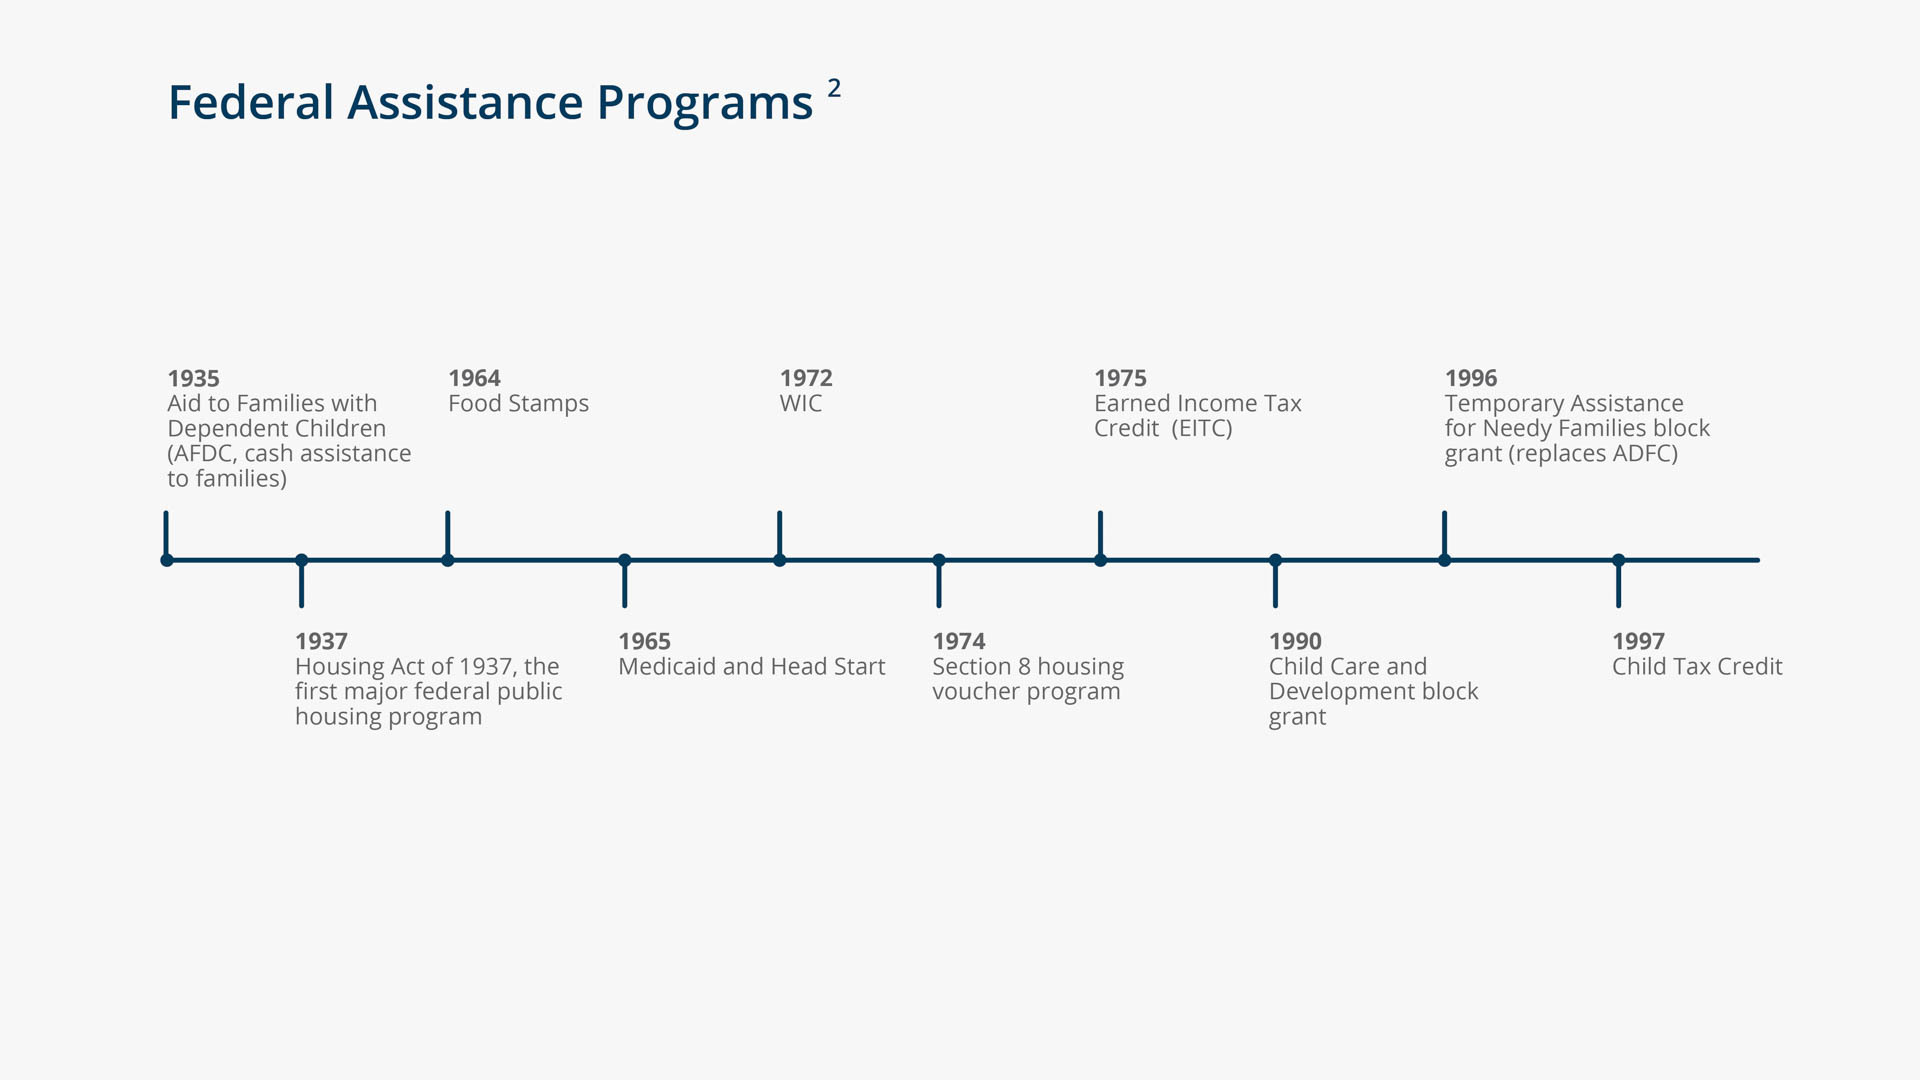
Key U.S. antipoverty programs, enacted from the 1930s onward, were established to h elp low-income families meet basic housing, food, and medical-care needs. (See "Federal Assistance Programs.") However, most of these programs were designed primarily to assist families and individuals that were not expected to be employed, like single mothers, elders, or people with disabilities.[1] (The earned-income tax credit, or EITC, is a notable exception.)
Since the 1980s, state and federal governments have actively promoted employment as a key component of poverty reduction for all able-bodied adults of working age, with corresponding changes to antipoverty programs. The 1996 Personal Responsibility and Work Opportunity Reconciliation Act, which established the Temporary Assistance for Needy Families block grant, requires work from most parents receiving cash assistance and of all childless adults receiving food assistance.
While requiring employment, these programs have been slow to change in ways that support working for pay, particularly for those with low and/or unstable earnings. One result is the "cliff effects" phenomenon: benefit levels decline more steeply than earnings increase, resulting in a decrease in total resources (earnings + benefits) at certain key earnings thresholds.
To demonstrate the cliff-effects phenomenon, we simulate the relationship between total resources and earnings for a single parent residing in Massachusetts with two young children (ages four and nine) under three different scenarios. In the baseline simulation, the family receives all public supports for which it is eligible and that are readily available. In the second, we add on the hard-to-get Massachusetts Rental Voucher Program (MRVP, a state-funded voucher that pays for a portion of rent). In the third, we use the baseline case plus a proposed policy: universal publicly provided early education and care (including out-of-school programs) for children ages 2–12.
A Cliff Primer
Only families and individuals that have earnings and public supports experience cliff effects. Cliffs can be very steep when benefits end at particular earnings levels (as is the case with the Women, Infants and Children program, or WIC) or the decline may be more gentle, with benefits gradually dropping off as earnings increase (as is the case with MRVP).
Cliffs are an inevitable part of any means-tested benefit. Problems arise when benefit levels for multiple programs drop simultaneously. If several supports decrease at around the same level of earnings, this creates a long and/or steep cliff effect. And when benefits fade out at earnings levels far below what is needed to cover basic costs, families find themselves in the classic trap of earning too much to receive support but not enough to make ends meet.
Cliff effects create a feeling of running to stay in the same place. If the supports are vital for well-being, hard to get, or provide a substantial level of support, a rational response might be to work less or work just enough to keep the supports. For example, due to long waiting lists for housing or child care benefits, families with these supports may be reluctant to give them up by working more hours or taking a promotion, especially if they have a history of variable earnings.
Annual Net Resource Simulator
Through the Center for Social Policy (CSP) at the University of Massachusetts Boston, we created a simulator that estimates the level of net annual resources at various wage levels for a full-time employed single parent with two children ages four and nine. The parent must find full-day care for the younger child and part-time care for the older child during nonschool hours.
We define net annual resources as net annual income (all earnings, refundable tax credits, and cash assistance minus income and payroll taxes owed over the year) minus net annual costs (typical costs for basic needs minus the value of any public supports received that directly pay for those costs). Typical basic costs come from the MIT Living Wage Calculator for Massachusetts from 2014.[3] These average statewide costs are adjusted for family size and include a low-cost food plan, child care costs, health care costs (insurance premiums plus the average cost of drugs and medical services and supplies), housing (fair-market rent), transportations costs, and miscellaneous costs of other necessities. The total amount needed before taxes and with no public support is $54,280. Child care and housing comprise 52 percent of those costs.
The value of public supports is based on eligibility requirements and the value of benefits at various income levels. We use 2013 values and eligibility rules obtained from various state agency websites and Mass Law Reform Institute publications that describe eligibility rules.[4] The amount of refundable credits and payroll and income taxes owed are calculated using the National Bureau of Economic Research's TAXSIM program.[5]
The parent works full-time (2,080 hours/year). Other than public supports, those earnings are the family's only source of income. We contrast net annual resources and total earnings, expressed as hourly wages, so $10/hour represents someone with gross earnings of $20,800 a year.
Data from the Massachusetts portion of the 2014 American Community Survey indicate there are just over 611,000 families with children with an employed parent, with 173,000 (28 percent) of those being single-parent families. We can't estimate the number of single parents with children ages four and nine, but there are 26,000 employed single parents with one child under six years old and one between the ages of six and 17, with median earnings of $22,500.
Baseline Case
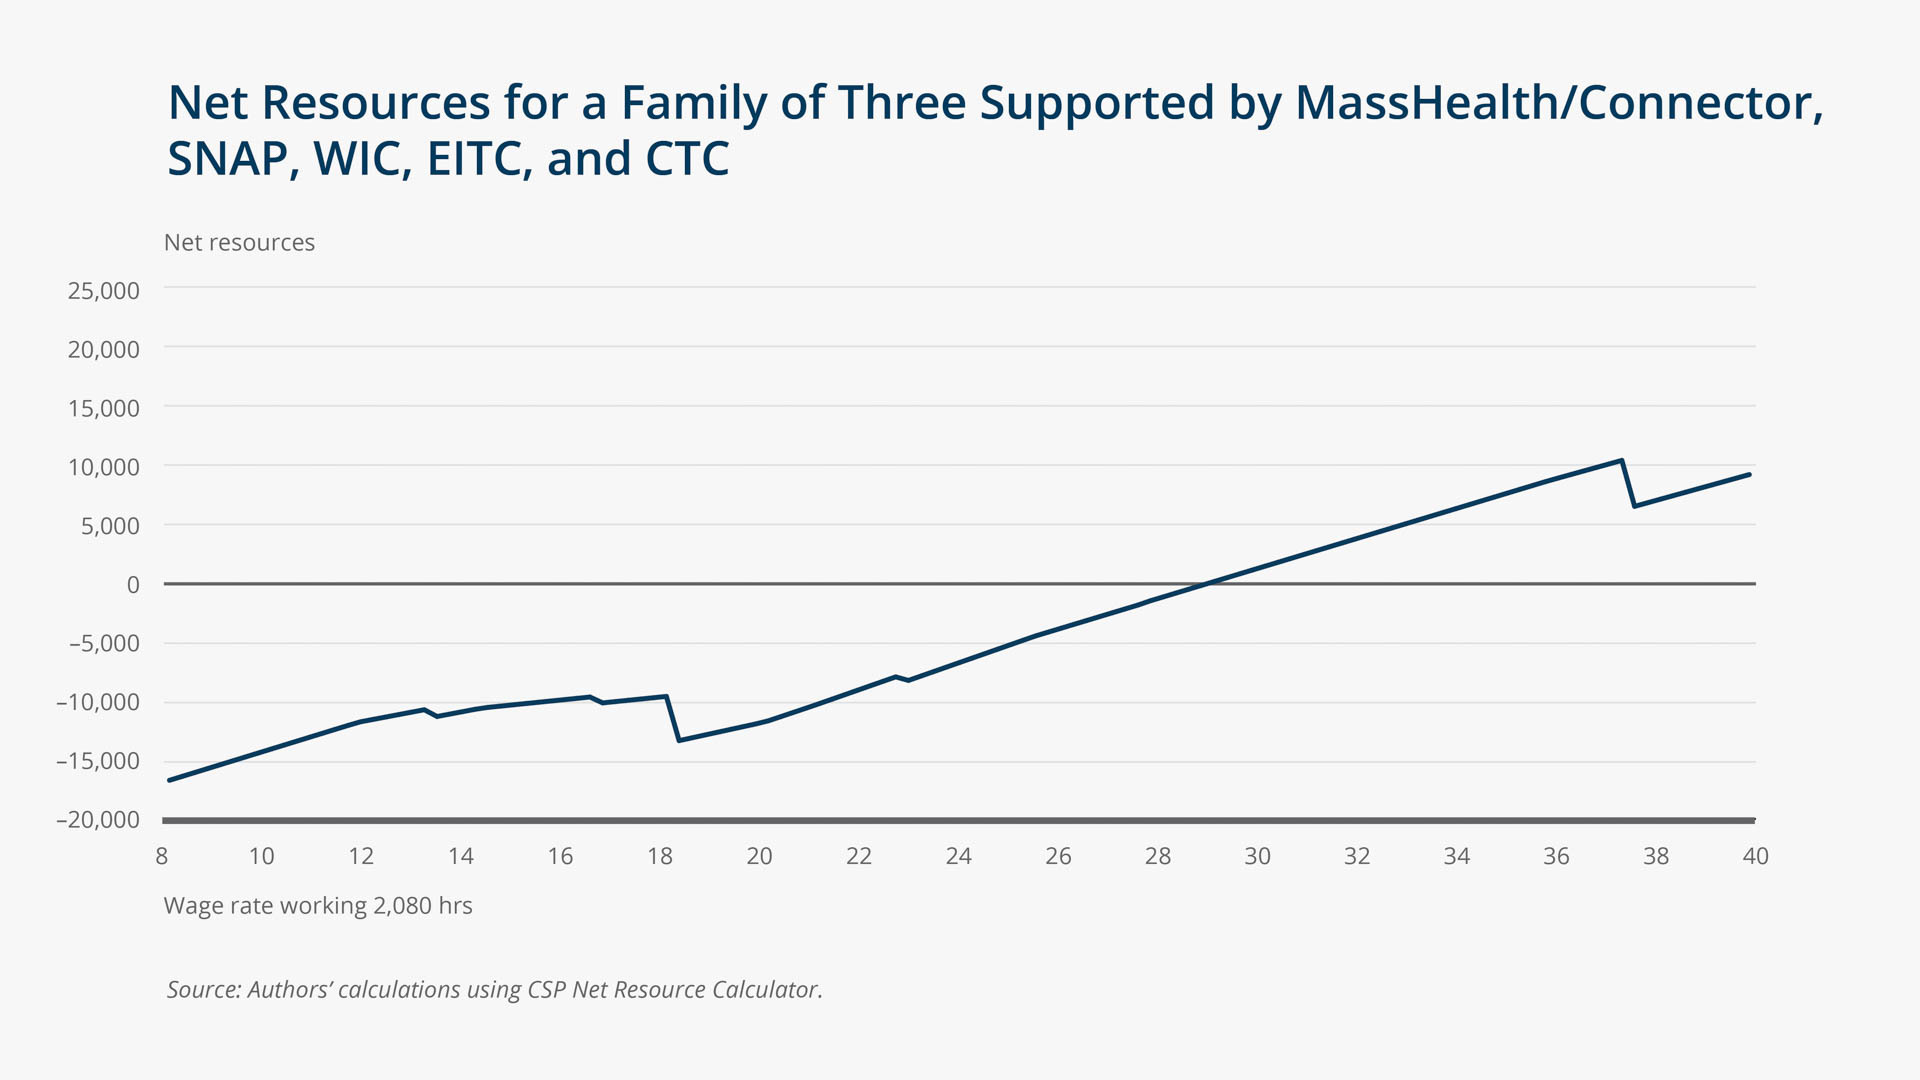
The figure "Net Resources for a Family of Three Supported by MassHealth/Connector, SNAP, WIC, EITC, and CTC" depicts net resources for a family receiving the public supports that are available (i.e., fully funded) in Massachusetts.This includes two tax credits (EITC and Child Tax Credit, or CTC), health insurance assistance (MassHealth and Massachusetts Health Connector), and food assistance (Supplemental Nutritional Assistance Program, or SNAP, and WIC).
It takes about $29/hour (close to $60,000 annual income) for this single parent to pay for basic needs at the typical costs. The cliff effects are apparent starting at about $14/hour ($29,120 annually) through about $19/hour ($39,520 annually). This is because all the benefits decline at some point between 100 percent of the federal poverty line (FPL) income threshold of $19,530 and 200 percent of the FPL, or $39,060 annual income (corresponding to between $9.40/hour and $18.75/hour). The family is unable to reach the same level of net resources achieved at $14/hour until earning about $22/hour. Given the high level of negative net resources, this family no doubt searches for much cheaper and perhaps unstable housing as well as less-expensive child care.
Rachel Bissett/Federal Reserve Bank of Boston
Baseline Plus Housing Assistance
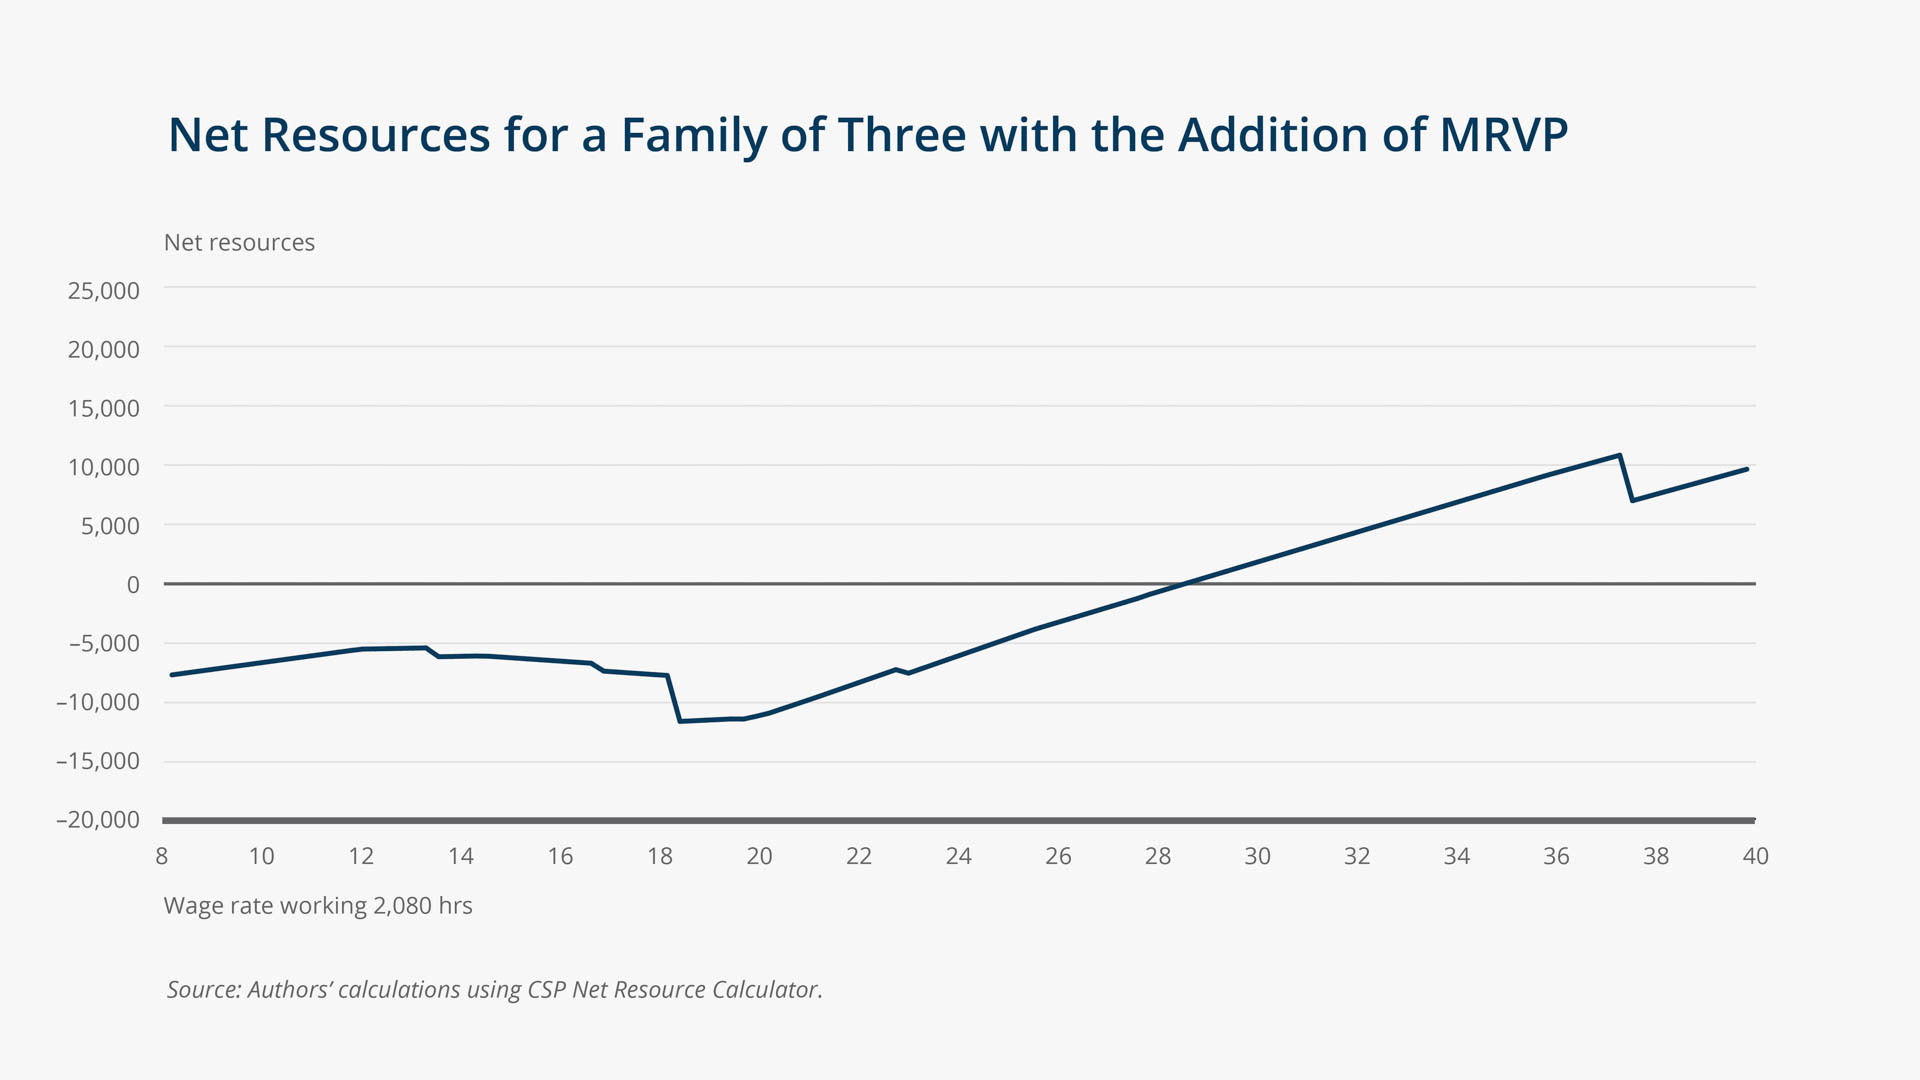
"Net Resources for a Family of Three with the Addition of MRVP" depicts the net resources for this family when, in addition to receiving the baseline supports, it also receives support from MRVP. In 2013, there were 5,100 families receiving MRVP vouchers,[6] far fewer than the demand by eligible households. When they are available, they are distributed through a lottery.
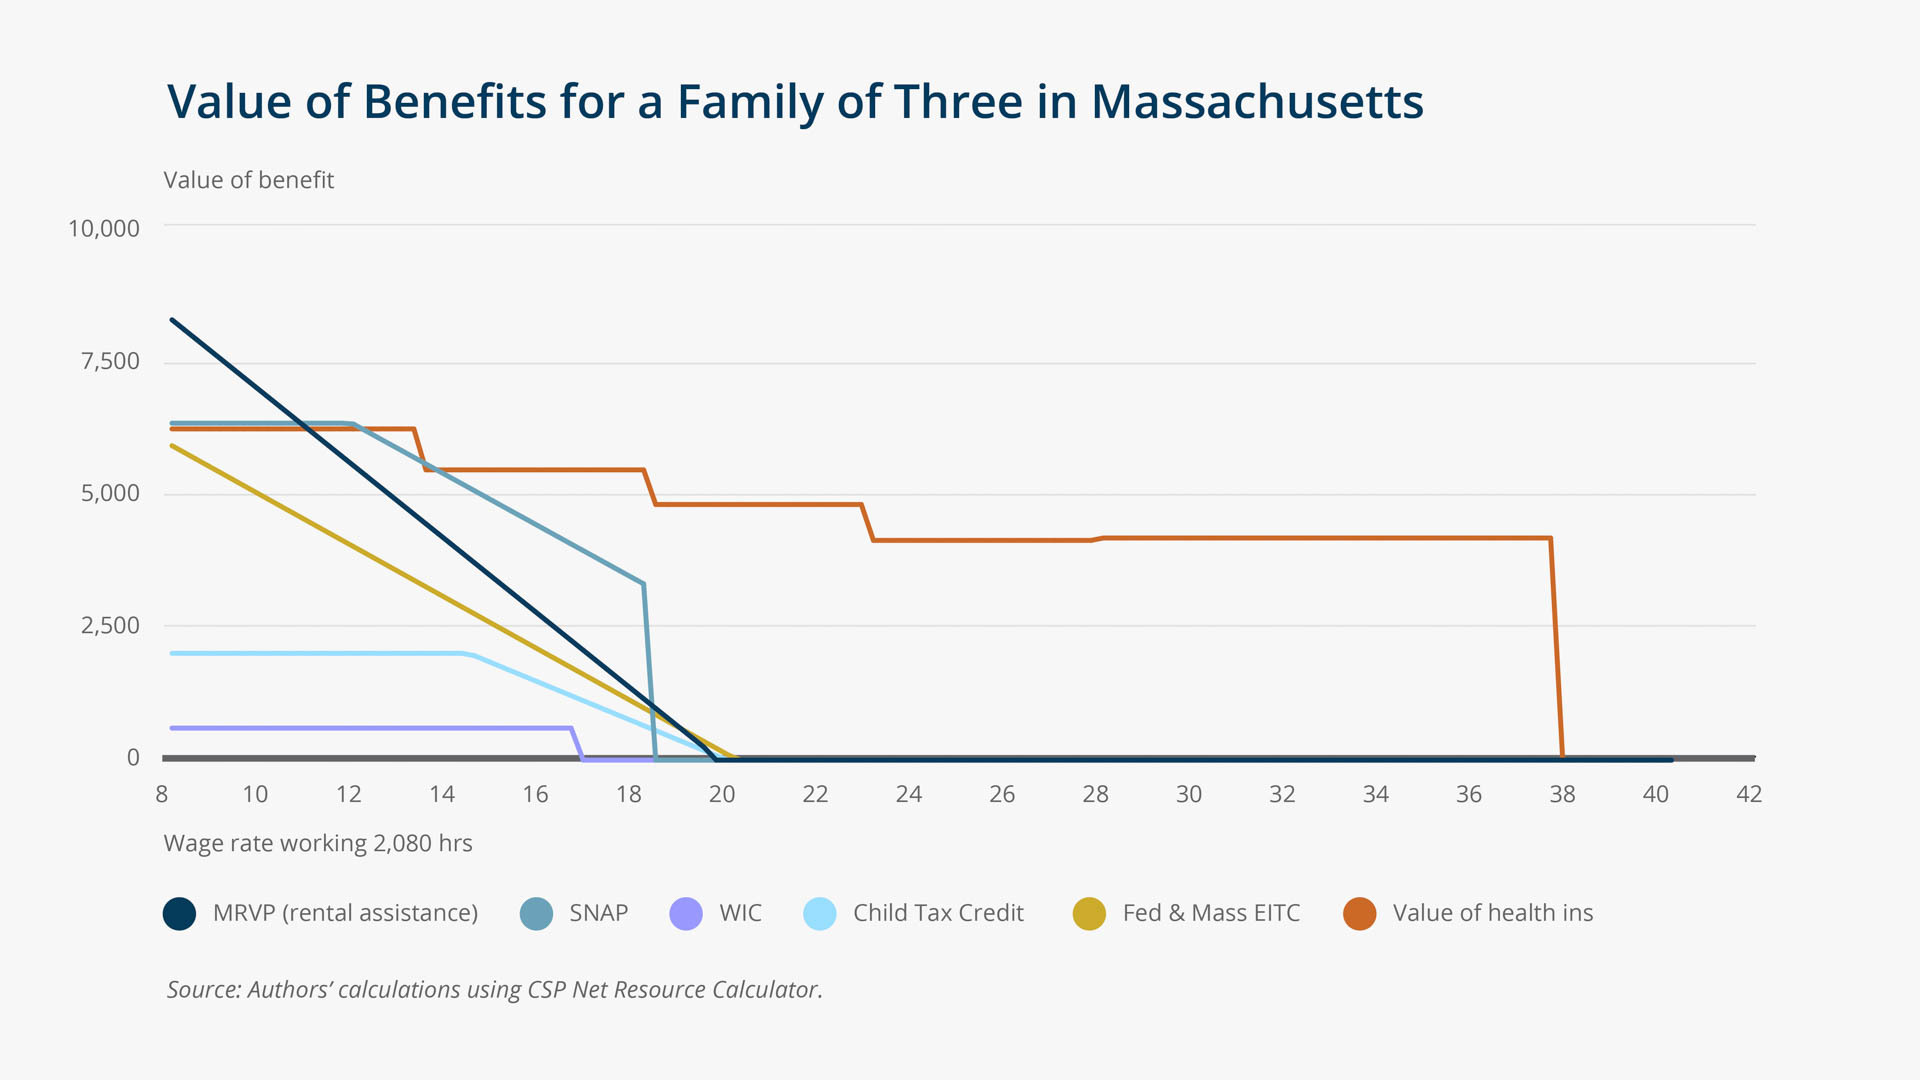
Again, this parent needs about $29/hour to meet all basic needs at typical costs, but the level of negative net resources up to that point is considerably reduced. As in the baseline case, cliff effects start at about $14/hour and end at about $19/hour. But in this case, the family faces a very slow rise in net resources from $9/hour to $14/hour, followed by a steady decline in net resources through $20/an hour. This is because EITC and MRVP benefits decline steadily and steeply between $9/hour and $20/hour. SNAP starts to decline at $14/hour and then completely drops off at about $19/hour, with the CTC tapering off at about $15/hour. When they are all declining, this family is losing more in supports than it is gaining in income. (See "Value of Benefits for a Family of Three in Massachusetts.")
Baseline Plus Child Care
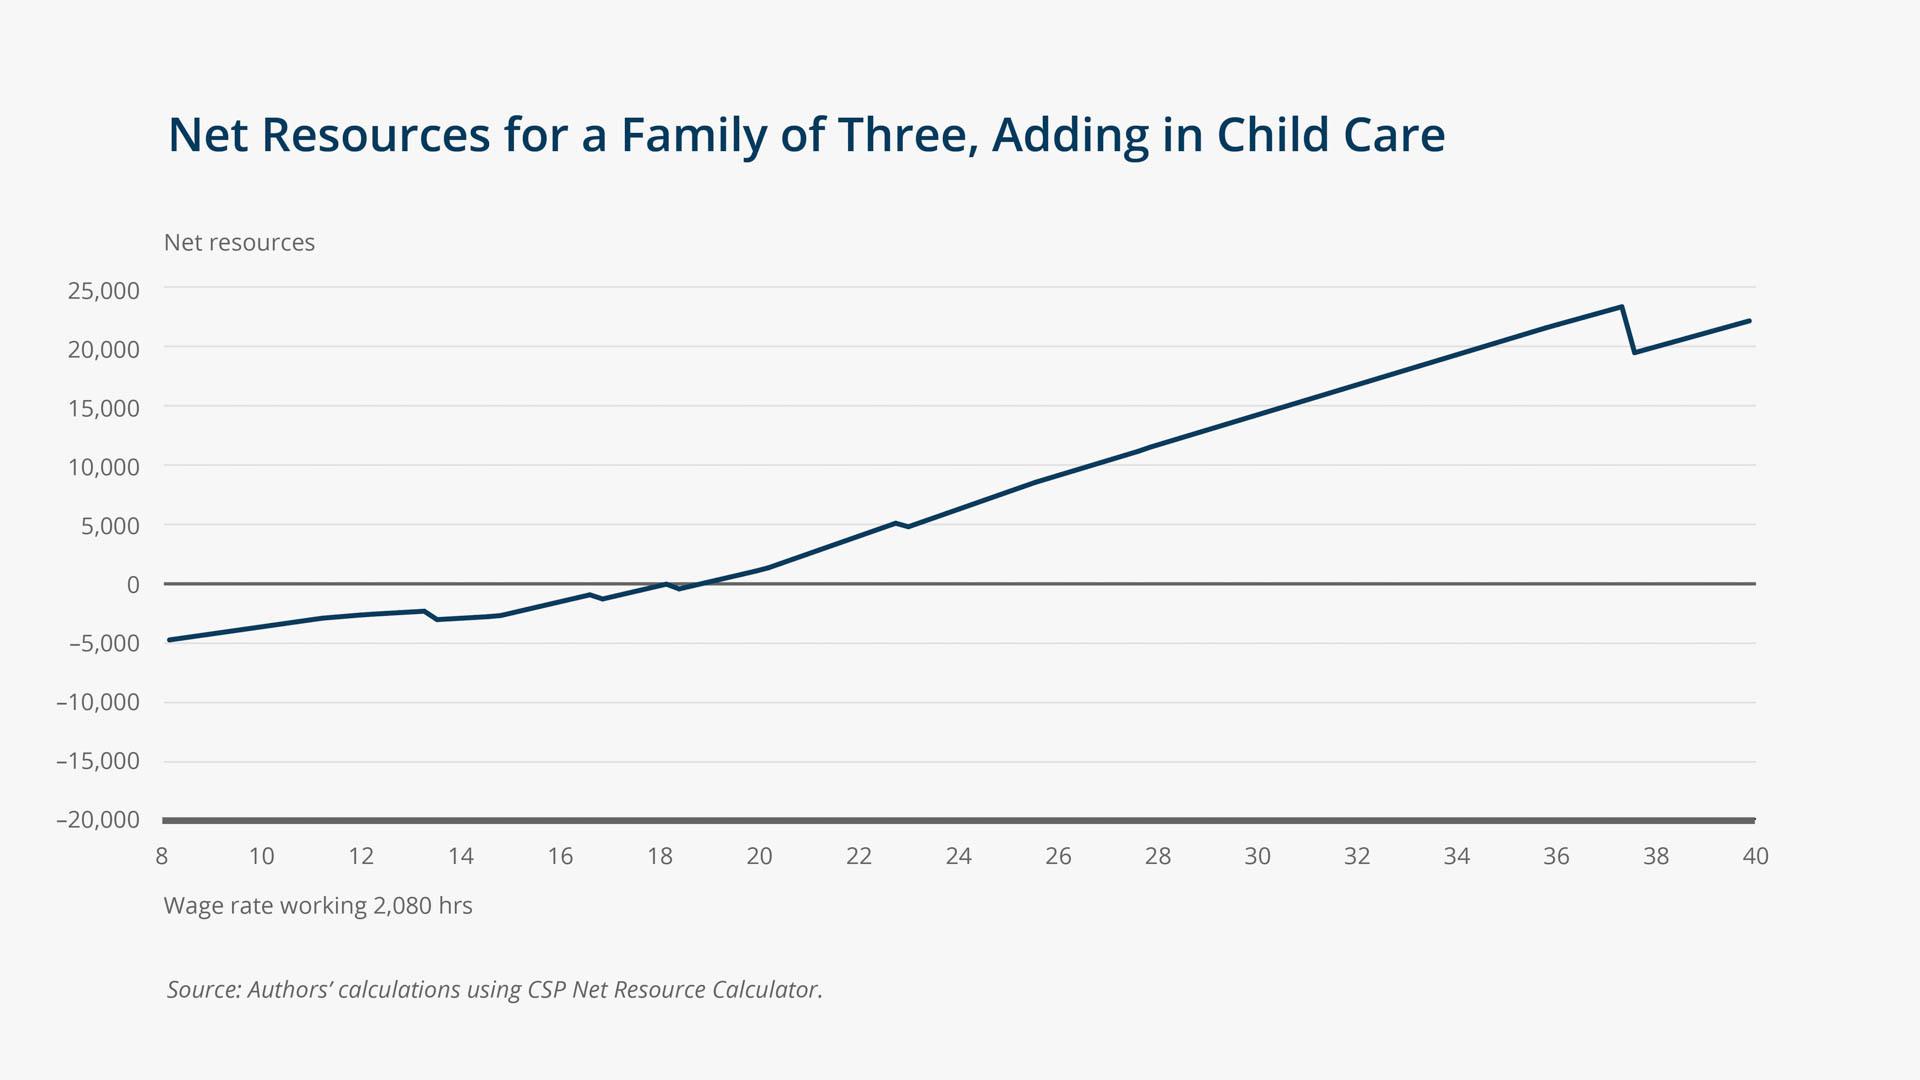
As our simulation shows, child care costs comprise a large portion of this family's expenses. One bold policy step to alleviate cliffs and help families make ends meet would be to make support for child care universal. While an expensive proposition, it is not far-fetched. We already provide K-12 education, and universal child care has already been shown to reduce poverty and income and gender inequality and to promote economic growth.[7] We run a third simulation to see how universal and free child care for children ages 2–12 would affect both the level of net resources and also the cliff effects for this family. (See "Net Resources for a Family of Three, Adding in Child Care.")
With the inclusion of child care, and even in the absence of MRVP, this family can cover typical costs at close to $18/hour. While there are still a few cliffs (notably at $14 an hour), they are not nearly as pronounced, and at almost every wage increase, there is an increase in net earnings. Instituting universal free child care would be costly, but so is the status quo, which currently puts the burden on those least able to bear it.
Articles may be reprinted if Communities & Banking and the author are credited and the following disclaimer is used: "The views expressed are not necessarily those of the Federal Reserve Bank of Boston or the Federal Reserve System. Information about organizations and upcoming events is strictly informational and not an endorsement."

 About the Authors
Randy Albelda,
University of Massachusetts Boston
Randy Albelda is a professor of economics at the University of Massachusetts Boston
Email: Randy.Albelda@umb.edu
Michael Carr,
University of Massachusetts Boston
Michael Carr is a assistant professor of economics at the University of Massachusetts Boston
Email: Michael.Carr@umb.edu
Endnotes
- Randy Albelda, "Time Binds: U.S. Antipoverty Policies, Poverty and the Well-being of Single Mothers," Feminist Economics 17, no. 4 (November 2011): pp. 189–214.
- Data represented in this timeline come from the following sources: "Supplemental Nutrition Assistance Program (SNAP), A Short History of SNAP," http://www.fns.usda.gov/snap/short-history-snap; Victor Oliveira et al., "The WIC Program: Backgrounds, Trends, and Issues" (US Department of Agriculture Food Assistance and Nutrition Research Report no. 27, Washington, DC, 2002); Thomas Hungerford and Rebecca Thiess, "The Earned Income Tax Credit and the Child Tax Credit" (Economic Policy Institute Issue Brief no. 370, Washington, DC, 2013); Maggie McCarty, "Introduction to Public Housing," (report, Congressional Research Service, Washington, DC, 2014); Judith G. Moore and David G. Smith, "Legislating Medicaid: Considering Medicaid and Its Origins," Health Care Financing Review 27, no. 2 (Winter 2014): 45–52; "Aid to Families with Dependent Children (AFDC) and Temporary Assistance for Needy Families (TANF): Overview," https://aspe.hhs.gov/aid-families-dependent-children-afdc-and-temporary-assistance-needy-families-tanf-overview-0.
- See http://livingwage.mit.edu for the living-wage calculator; links for individual states appear on the right. We use statewide costs to present a general case, but costs can by adjusted by county to reflect the variation in housing costs across the state.
- Massachusetts Law Reform Institute publications can be found at http://www.mlri.org/publications/advocacy-guides. The institute is a nonprofit organization whose mission is "to advance economic, racial and social justice through legal action, education and advocacy" (http://www.mlri.org/about_us).
- See http://users.nber.org/~taxsim/.
- "Massachusetts Rental Voucher Program: Rental Assistance," RCAP Solutions, 2013, http://www.rcapsolutions.org/massachusetts-rental-voucher-program/.
- Arthur MacEwan, "Universally Available, Publicly Funded Early Education," Communities & Banking 25, no. 1 (Winter 2014): 4–6.
Resources
Site Topics
Related Content
The Effect of Changing Employers' Access to Criminal Histories on Ex-Offenders' Labor Market Outcomes: Evidence from the 2010–2012 Massachusetts CORI Reform
New England Study Group Past Meetings
Long Term Effects of the Great Recession
The Effects of Weather on Massachusetts Municipal Expenditures: Implications of Climate Change for Local Governments in New England