Addressing Housing Shortages through Tax Abatement 


Key Takeaways
- Property tax abatement can spur new residential construction and help to address housing shortages; however, it is costly because tax relief cannot be targeted exclusively at housing units that would not be built without an abatement.
- Tax abatement can be most effective when it addresses the underlying issues constraining construction, but it may have limited capacity to counter rising construction costs.
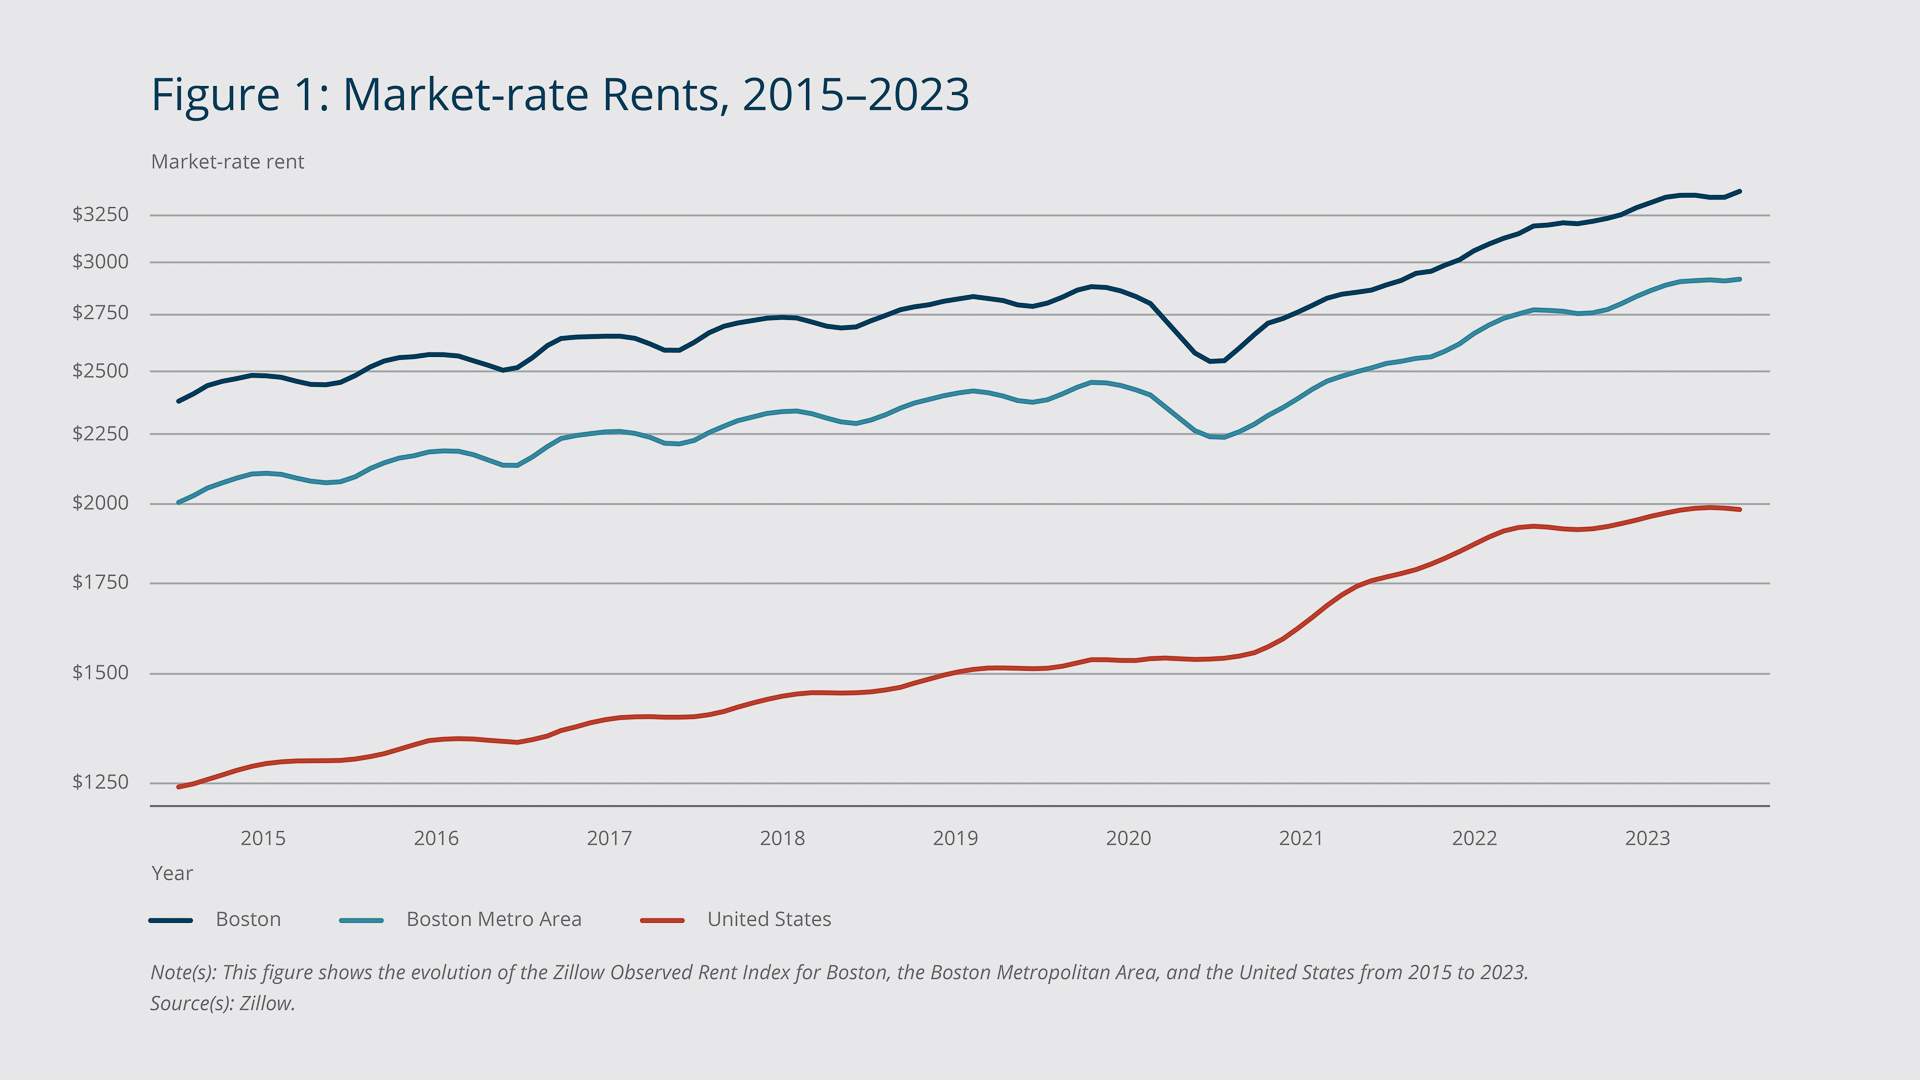
Over the past decade, rising rents have been a significant issue across the United States (see Figure 1). From 2015 to 2020, apartment rents nationwide increased 3.6 percent annually on average. After stagnating during the initial phases of the COVID-19 pandemic, national rents surged at the start of 2021 and increased a total of nearly 30 percent over the subsequent three years.
Rising rents, often attributed to a shortage of available housing, spotlight the urgent need to accelerate housing construction, particularly in Boston and other “superstar cities”1 where rents have been rising acutely. Recent data from the Boston Planning and Development Agency (BPDA) underscore this urgency. As of July 25, 2023, 199 new projects encompassing a total of 23,000 residential units were stalled in the BPDA pipeline. The agency had approved the projects, but developers had not begun construction likely because it was not financially feasible to do so.2 In response, Boston Mayor Michelle Wu has explored policy options to jump-start residential construction. One such option draws inspiration from New York’s playbook: incentivizing developers to build by granting them tax abatements for new construction.3

Federal Reserve Bank of Boston
Mayor Wu tasked a team of local researchers, including myself, to evaluate the potential impact of tax abatement for new construction in Boston. Through our research (Alejandro et al. 2024 ), we gained valuable insight into the challenges associated with construction in Boston as well as the broader complexities of stimulating new residential development.
Three findings stand out. First, tax abatement can be effective in accelerating the transition of properties from the BPDA pipeline to the housing market. Although in the current environment, the policy would not fully address the backlog because for a substantial number of projects, it would not provide the developers with enough financial incentive to begin construction. Second, tax abatement is a costly solution because developers receive tax breaks on many buildings that would be built without an abatement. Lastly, and perhaps most importantly, tax abatement is most effective when it addresses the underlying issues constraining construction. In Boston's case, the key issue is high construction costs, which tax abatement may not have the scope to address.
Sign up for Research Department Updates.
Tax Abatement Can Increase Housing Supply
A developer’s decision to pursue a construction project boils down to a simple calculation. First, the developer calculates the return on their investment in the building—the return on capital. To do so, they divide the expected annual revenue from the project once it is complete and fully leased up by the total construction cost. The revenue, commonly known in the real estate realm as net operating income, is equal to rental income minus the expenses associated with operating the building, which include property taxes. The construction cost includes the “hard costs” of the physical construction, “soft costs” such as design and marketing, land costs, and the short-term financing costs incurred from borrowing money to build the project.
A developer then compares the return on capital to a hurdle rate, which reflects the expected rate of return that investors seek from new residential construction. The hurdle rate is affected by such factors as interest rates and anticipated future real estate rents and prices. If the return on capital surpasses this hurdle rate, the project moves forward.4
Tax abatement enhances net operating income, which raises the return on capital and therefore could increase the flow of new properties onto the market and, in Boston’s case, alleviate the BPDA pipeline congestion. Our study for the City of Boston assesses the extent to which it could do so and at what cost.
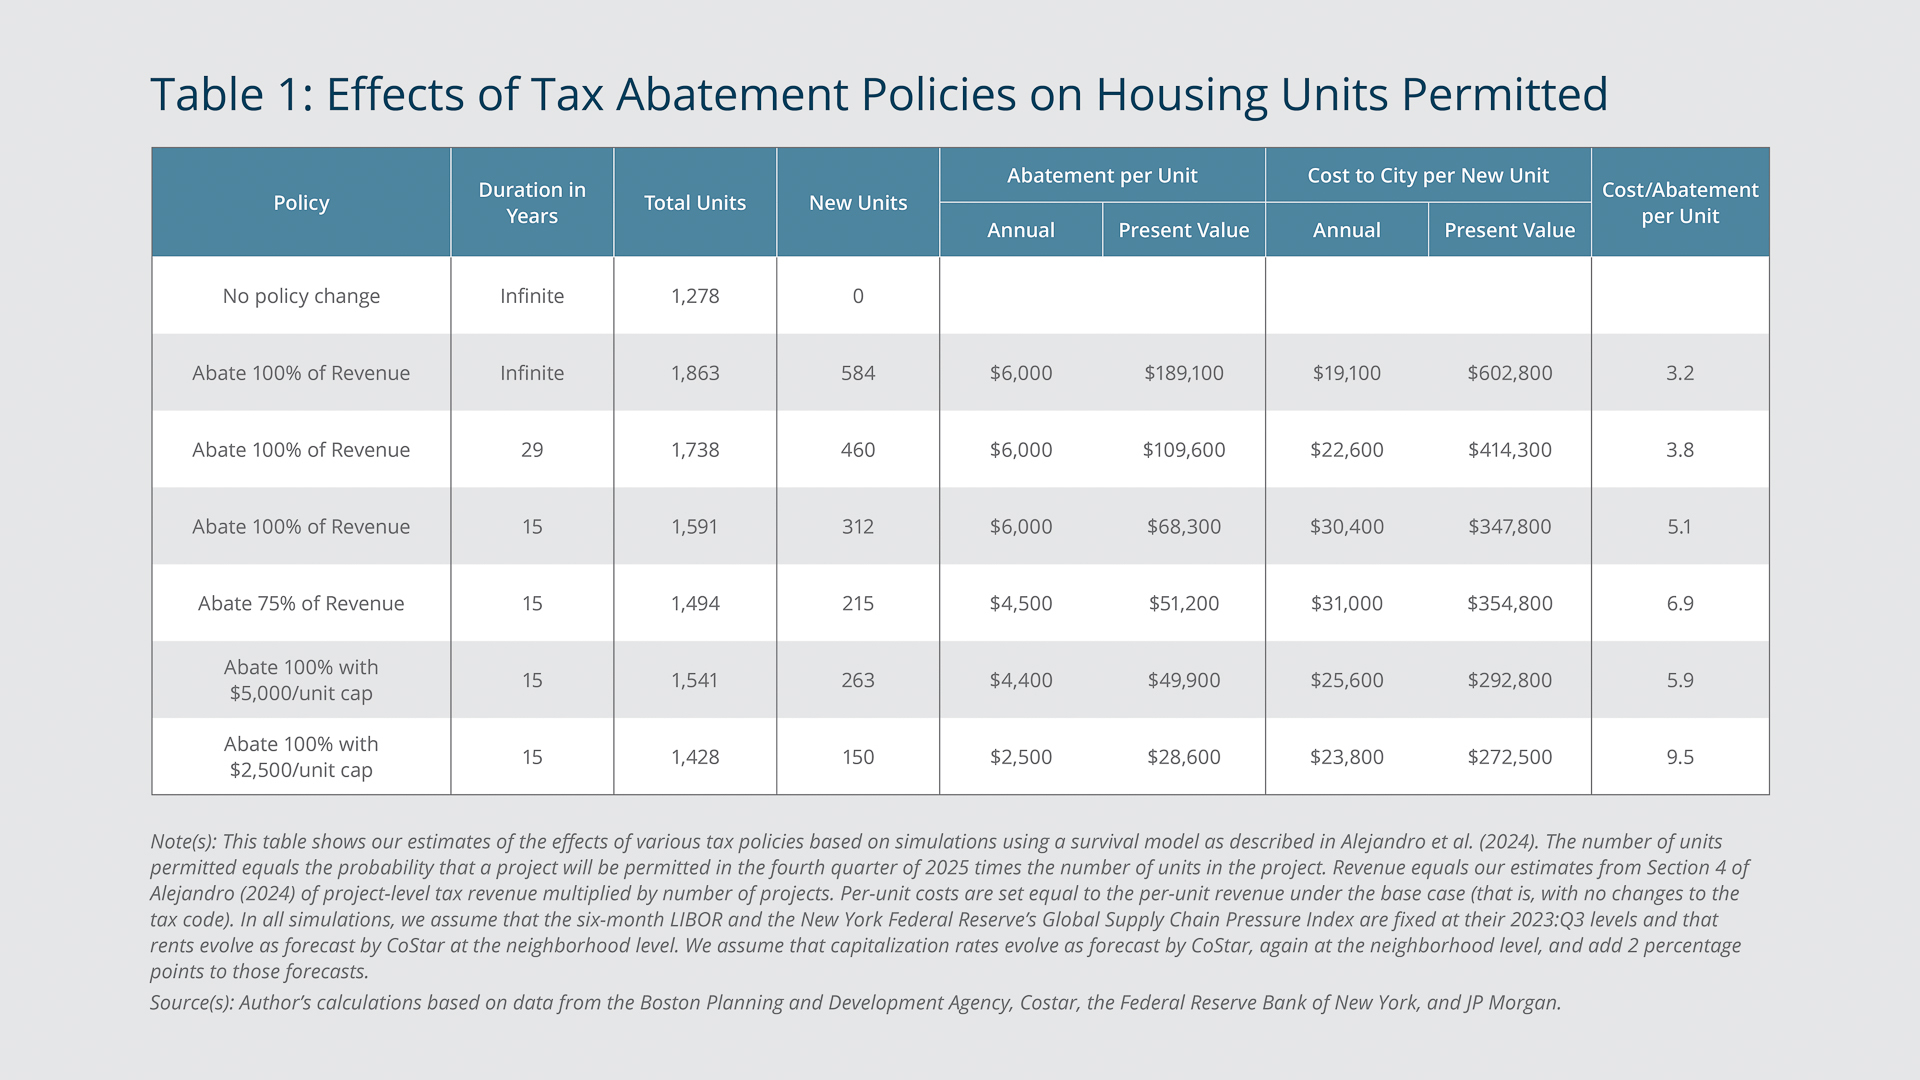
Our analysis focuses on a subset of 77 market-rate multifamily rental projects totaling 7,795 units. (For this study, multifamily projects are defined as buildings containing five or more housing units.) The subset omits projects in the BPDA pipeline that are unlikely to be eligible for tax abatement.5 We estimate that without any policy change, projects comprising approximately 1,300 rental units would move forward to construction because the developers’ return on capital already exceeds the hurdle rate. Implementing full tax abatement on all new construction projects in perpetuity would increase the net operating income per unit by roughly $6,000 a year, or $190,000 in present value.6 The consequently higher return on investment for developers would result in a 40 percent increase in new construction, to almost 1,900 units.
Federal Reserve Bank of Boston
An uncapped and perpetual tax abatement provides a useful upper bound on the potential impact of this type of policy, but typically these policies are limited in time and scope. Table 1 summarizes our findings for Boston for full tax abatement and an array of alternative options, including a partial tax abatement, limiting the abatement to 15 or 29 years, and capping the abatement at $2,500 or $5,000. Each would result in proportionally smaller increases in new construction.7
The Cost of Not Identifying Which Projects Need Abatements
In addition to showing the potential gains from tax abatement, Table 1 conveys the central challenge associated with employing tax abatements to stimulate new construction. This challenge lies in directing the subsidy exclusively toward projects for which an abatement is essential. Not being able to identify such projects before the policy’s implementation massively increases the so-called tax expenditure of the policy—the revenue forgone due to the abatement.
Consider the scenario for Boston of full tax abatement provided indefinitely. This policy would result in the construction of 1,863 units. Of those units, 1,278 would be built without an abatement because, according to our analysis, the return on capital for those projects is already higher than the hurdle rate. Therefore, the number of additional units that the policy would produce is 584. However, the city would have to disburse the $6,000 per year in abatements to all 1,863 new units, resulting in a tax expenditure to the city of more than $19,000 per year for each of those 584 units. In essence, for every dollar allocated to a marginal project, more than two dollars would be directed to inframarginal projects that would be constructed even without the subsidy.
In the 29-year scenario, a 100 percent abatement creates 460 units at an annual cost of about $22,600 (present value of $414,000) per unit, while an abatement capped at $5,000 per-unit for 15 years produces 263 units at a cost of $25,600 ($293,000 present value) per unit. A 75 percent tax abatement for 15 years generates fewer units (215) and costs more ($31,000, $355,000 per unit) than the $5,000 per-unit, 15-year credit. Instead of uniformly reducing taxes by 75 percent, the abatement capped at $5,000 per unit offers full relief to more affordable buildings and less to expensive luxury ones.
When Is Tax Abatement Most Effective?
Tax abatement can be effective if it addresses the root cause of low residential investment. Two historical examples investigated by Rossi-Hansberg, Sarte, and Owens (2010) and Schwartz et al. (2006), in Richmond, Virginia, and New York City, respectively, illustrate how policy that invests in residential construction can substantially increase the housing supply in a cost-effective fashion. In these instances, developers received subsidies to rejuvenate or replace abandoned properties.
Rossi-Hansberg, Sarte, and Owens (2010) found that Richmond’s federally funded Neighborhood-in-Bloom program, which operated from 1999 through 2004, raised property values by 2 to 5 percent in the targeted neighborhoods, or $2 to $6 for every $1 spent on subsidies.
Schwartz et al. (2006) studied New York City’s “Ten Year Plan,” a $5 billion expenditure mostly in the form of subsidies that resulted in the construction or rehabilitation of more 182,000 units from 1985 through 2000. The authors focused on the spillover effects of the 66,000 new units that the program produced through either new construction or the gutting and reconstruction of uninhabitable buildings. They found that the prices of properties in the immediate vicinity of this newly built subsidized housing appreciated faster than property prices in areas just beyond the immediate vicinity. Moreover, their simple cost-benefit analysis suggested that the tax benefit to the city from the new properties and increased values of nearby existing properties exceeded the cost of the subsidies.
Abandoned properties not only blight communities but also drive down rents of neighboring properties, resulting in low net operating income and low return on capital and, therefore, less construction of new properties. By providing subsidies to developers for the renovation or replacement of abandoned buildings, policymakers could boost the return on constructing new housing. In addition to directly increasing housing supply, this new investment could initiate a virtuous circle by eliminating blight and prompting more new construction through knock-on effects. However, the root cause of the housing shortage in Boston is not abandoned properties. It appears to be high construction costs, which tax abatement may have limited scope to address.
Soaring Construction Costs Can Be a Prohibitive Problem
Excessively high rents are the main concern in Boston. So why are returns on investment in construction inadequate to spur substantial new construction?
One plausible explanation involves the rise in hurdle rates since the Federal Reserve began increasing the federal funds rate in 2022. This has pushed up market interest rates on construction financing and multifamily mortgages, raising hurdle rates by an estimated 1 to 2 percentage points. Hurdle rates are generally difficult to observe, but available data suggest that while hurdle rates have increased, they are not significantly higher than they were in 2019, when the number of projects in the BPDA pipeline was one-third smaller than it is today.
Federal Reserve Bank of Boston
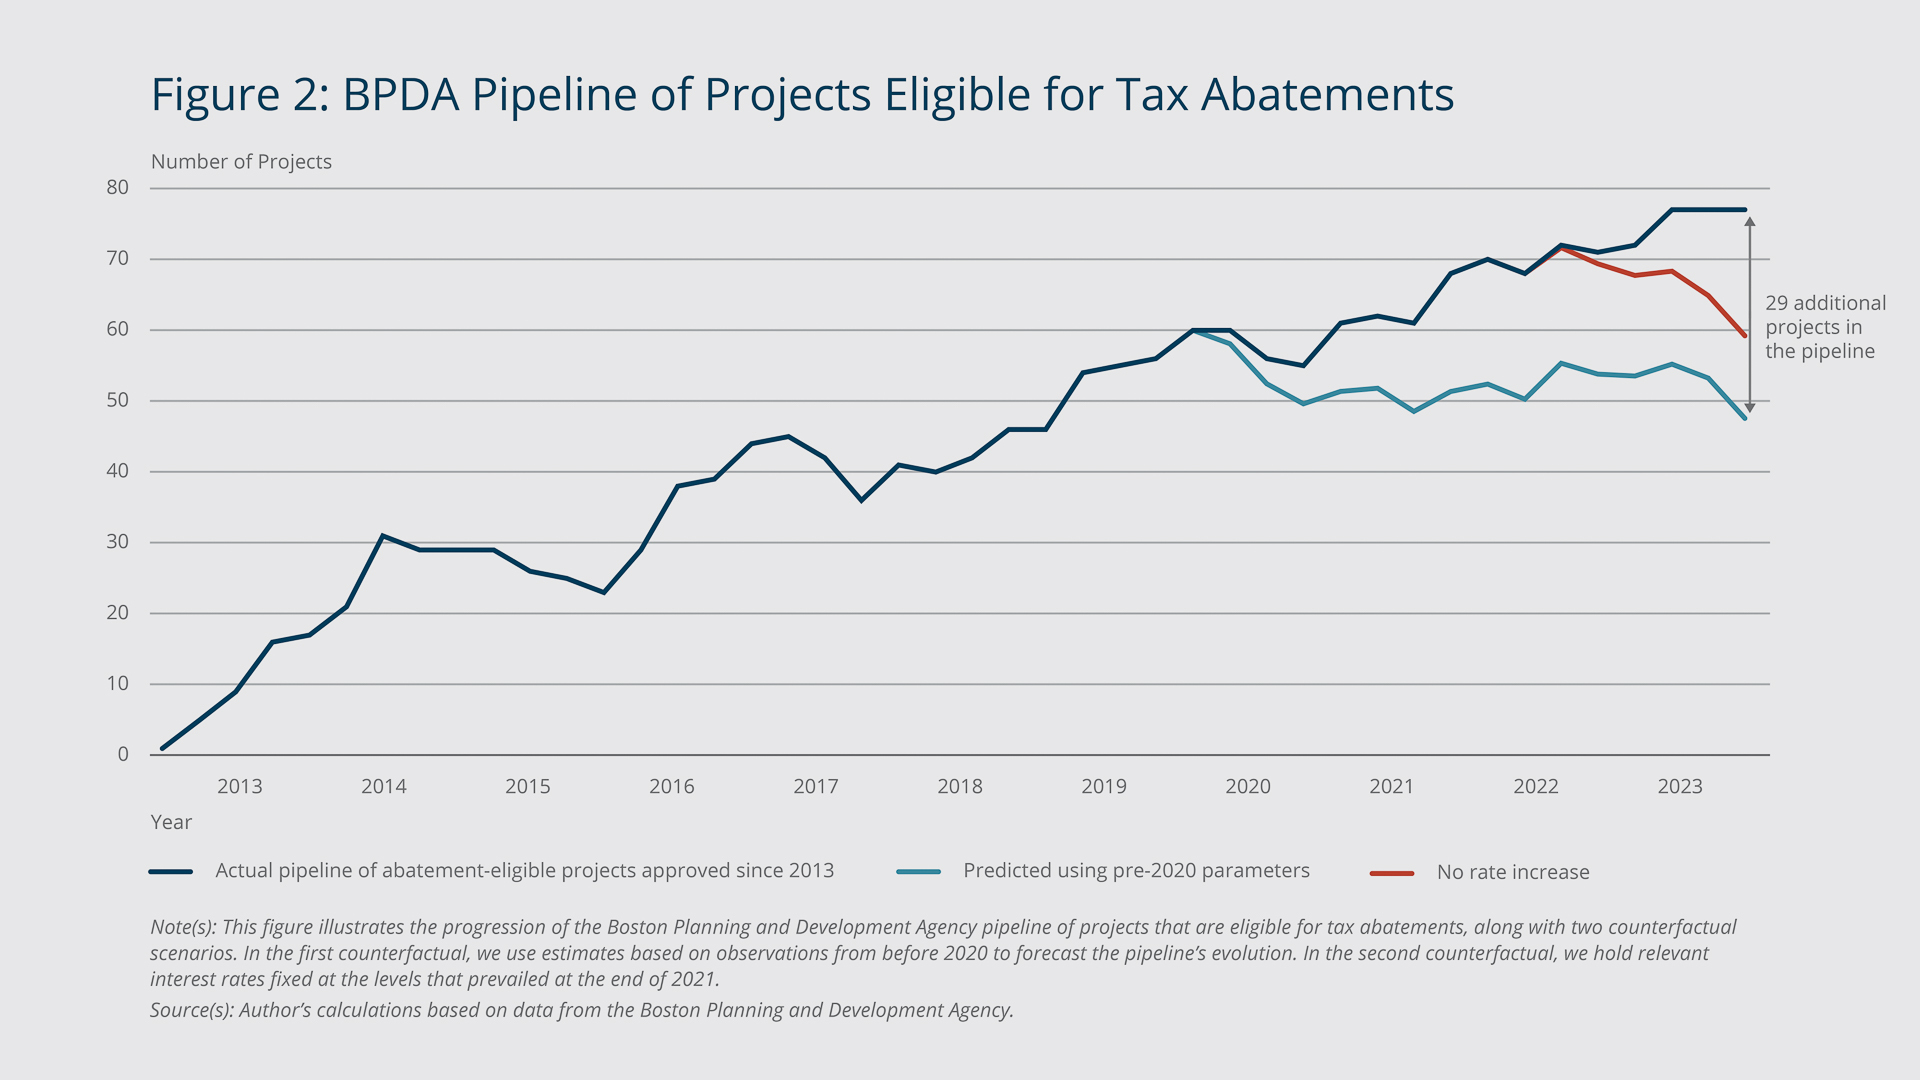
Figure 2 shows the changes in the size of the pipeline since 2013, when our data set starts. It is worth emphasizing that a substantial pipeline of projects is a standard occurrence. Before the COVID-19 pandemic, approximately 10 percent of projects in the pipeline received permits each quarter, suggesting that the median project typically remained in the pipeline for approximately a year and a half. With an estimated addition of roughly five projects per quarter, or about 20 projects annually, there would be about 50 projects in the pipeline at any given time. Therefore, we view the pipeline as roughly in balance on the eve of the pandemic.
Following the start of the pandemic, the permitting rate decreased from 10 percent of BPDA-approved projects per quarter to approximately 5 percent, leading to a significant increase in the size of the pipeline. Figure 2 illustrates that if projects had advanced at pre-pandemic rates, the pipeline would now include only 48 projects, compared with the 77 we observe.
Our examination suggests that from 2020 to 2022, rising costs due to supply chain issues were the primary challenge for developers, although historically low interest rates during this time mitigated some of this difficulty. By 2022, supply chain issues had improved, but rising interest rates counteracted that improvement. We estimate that higher interest rates account for about half of the additional 29 projects in the pipeline.
Federal Reserve Bank of Boston
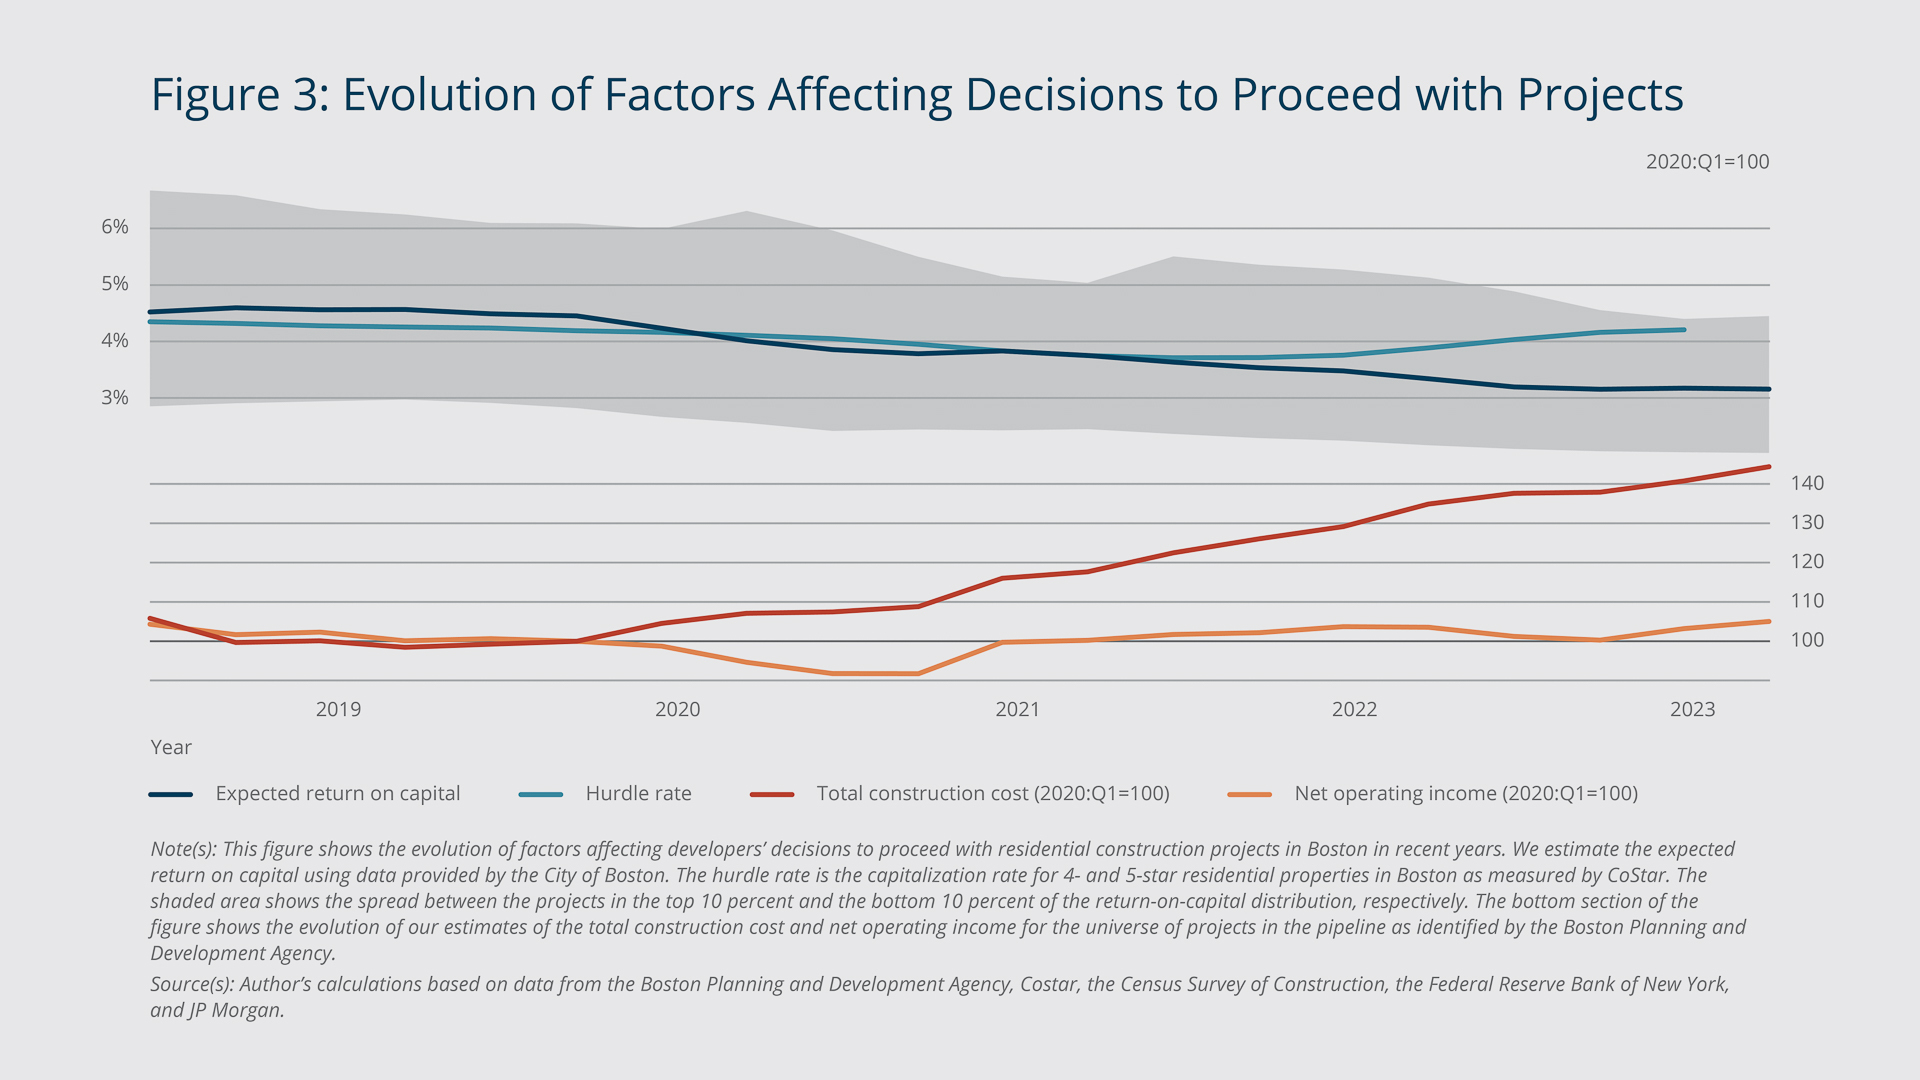
Figure 3 illustrates what happened. The upper portion of Figure 3 displays the hurdle rate (light blue line), which, as noted earlier, is the expected rate of return sought by investors engaging in new residential construction. For the expected return on capital (dark blue line), we employ data from developers, building permits, and tax records to estimate the anticipated net operating income on new construction and the total project costs. The shaded area shows the spread between the projects in the top 10 percent and the bottom 10 percent of the return-on-capital distribution, respectively. The fundamental premise of this economic model is that any project landing above the light blue line likely will proceed, whereas the developers of projects that fall below the light blue line likely will opt to delay.
Figure 3 further highlights that until the middle of 2020, the dark blue line remained substantially higher than the light blue line, indicating that most projects were likely feasible during that period. However, this does not imply a static economic environment. Across 2020 and 2021, we observe a decline in both the expected return on capital and the hurdle rate. This decrease in the hurdle rate was influenced by policymakers reducing interest rates to counter the effects of the pandemic.
The situation shifted in 2022, as the return on capital continued to decline while the hurdle rate increased. Consequently, by 2023, a significant proportion of the projects in the sample were no longer financially viable. The figure indicates that if we compare 2023 with 2021, lower returns and higher hurdle rates were equally to blame for the problem. However, if we compare 2023 with 2019, the figure shows that the hurdle rate had returned close to its 2019 level; therefore, lower returns on investment drove all the deterioration.
To explain why returns on investment declined so sharply, we revisit our Boston project data and break down the expected return on capital into its components: net operating income (the numerator) and total construction costs (the denominator). The lower segment of Figure 3 shows that construction costs have surged 40 percent since 2020 and that net operating income has failed to keep pace, at least partly because inflation drove up operating costs. Due to the surge in construction costs, most of the buildings that would have been profitable to build in 2019—when much of the pipeline was still on the drawing board—are now far from viable.
Could a property tax abatement policy have the scope to address this issue? In Boston, real estate taxes on residential multifamily buildings are approximately 1 percent of the building’s fair-market value. Therefore, eliminating property taxes in perpetuity could increase the return on capital by only about 1 percentage point, which is significantly less than the effect of increased construction costs. Add any increase in hurdle rates due to rising interest rates, and it becomes even clearer why tax abatement would not lead to substantial additional construction in Boston: Given rising construction costs, most projects in the BPDA pipeline would have such a low return on investment that a 1 percent increase in net operating income would not push them to be profitable. Consequently, while tax abatement may lead to a transitory increase in residential construction investment, if the tax rate is not high enough—and therefore the tax break not large enough—it likely would not solve the underlying problem of high costs.
The views expressed herein are solely those of the authors and should not be reported as representing the views of the Federal Reserve Bank of Boston, the principals of the Board of Governors, or the Federal Reserve System.
Endnotes
- Gyourko, Mayer, and Sinai (2013) coined the term “superstar cities.” It refers to cities where the demand for housing outstrips the supply due to their strong and broad appeal to potential residents.
- According to the Boston zoning code, the BPDA must assess the design of real estate developments, considering their impact on both the local community and the city as a whole. Projects enter the pipeline upon completion of this review and approval by the BPDA Board. The pipeline consists of all approved projects that have not yet been permitted. Permitting typically implies that the developer is ready to start construction because the permitting fee constitutes approximately 1 percent of the project’s value.
- One well-known example is New York’s 421a program, initiated in 1971. Under 421a, the typical tax abatement lasted for 25 years and required properties to include affordable housing components and fulfill other policy objectives.
- In our model, the factors governing the return on investment in a project include the number of quarters since approval of the project, rent growth, interest rates, and supply chain challenges measured by the Federal Reserve Bank of New York’s Global Supply Chain Pressure Index. We calculate the hurdle rate for new construction using the capitalization rate, which we derive from the ratio of net operating income to property price for Boston multifamily projects (residential buildings that contain five or more housing units) sourced from CoStar, a commercial real estate data provider.
- The subsample excludes owner-occupied units in mixed developments, and it excludes units in the Suffolk Downs project because the property extends beyond the Boston border. Additionally, we remove public housing and properties with a significant proportion of inclusionary zoning apartments, typically with diverse funding sources.
- The $6,000 reflects that the property tax rate in Boston is roughly 1 percent and the value of the typical new unit is about $600,000. To compute the net present value, we discount at a 3 percent rate reflecting a 5 percent interest rate and 2 percent expected growth in rents and prices.
- The presented results are derived from the bottom panel of Table 4 in Alejandro et al. (2024), which employs the survival approach within the pessimistic scenario as detailed in the paper. Although additional scenarios are outlined in the top panel of Table 4 and in Table 5 of the report, they are excluded from this discussion due to the comparable underlying patterns in the results.
References
Alejandro, Patricia, Mary Ellen Carter, Denise DiPasquale, Edward Glaeser, Adam Guren, and Paul Willen (2024). “Report on the Potential Impacts of Property Tax Abatement on Rental Housing Construction in Boston.” Federal Reserve Bank of Boston Research Department Working Papers No. 24-1.
Gyourko, Joseph, Christopher Mayer, and Todd Sinai. 2006. “Superstar Cities.” American Economic Journal: Economic Policy 5(4): 167–199. DOI: 10.1257/pol.5.4.167
Rossi-Hansberg, Esteban, Pierre-Daniel Sarte, and Raymond Owens III. 2010. “Housing Externalities.” Journal of Political Economy 118(3): 485–535.
Schwartz, Amy Ellen, Ingrid Gould Ellen, Ioan Voicu, and Michael H. Schill. 2006. “The External Effects of Place-based Subsidized Housing.” Regional Science and Urban Economics 36(6): 679–707.

 About the Authors
Paul S. Willen,
Federal Reserve Bank of Boston
Email: Paul.Willen@bos.frb.org
Resources
Site Topics
Keywords
- Tax abatement ,
- housing supply ,
- Boston
JEL Codes
- H2
Citation
Willen, Paul S. 2024. “Addressing Housing Shortages through Tax Abatement.” Federal Reserve Bank of Boston Current Policy Perspectives 24-2.
Related Content
New England Study Group Past Meetings
Regional Consolidation of Local Government Services in New England: Opportunities and Challenges in Realizing Greater Cost Efficiencies
Regional Consolidation of Local Government Services in New England: Opportunities and Challenges in Realizing Greater Cost Efficiencies
Can Subsidized Housing Help Address Homelessness in New England?