New England Economic Conditions through April 2, 2024 


Key Takeaways
- New England saw robust employment growth in February 2024, adding 9,000 jobs during the month and continuing to exceed its pre-pandemic employment benchmark. Employment in the educational and health services sector was 1.6 percent above its February 2020 level, and with 3.1 percent growth over the past year, the sector has helped lead overall employment growth in the region.
- Unemployment in New England was 3.4 percent in February 2024, which was below the national rate of 3.9 percent but represents a year-over-year increase of 0.2 percentage point. Annual growth in the region in labor force participation and initial claims of unemployment insurance suggests that both labor-force entry and layoffs have contributed to the elevated unemployment rate.
- Year-over-year price growth for February 2024 was slower in New England (2.1 percent) compared with the United States overall (3.2 percent). Price growth in the region was driven by rising shelter, food, transportation, and medical prices, as all other product categories experienced a decline.
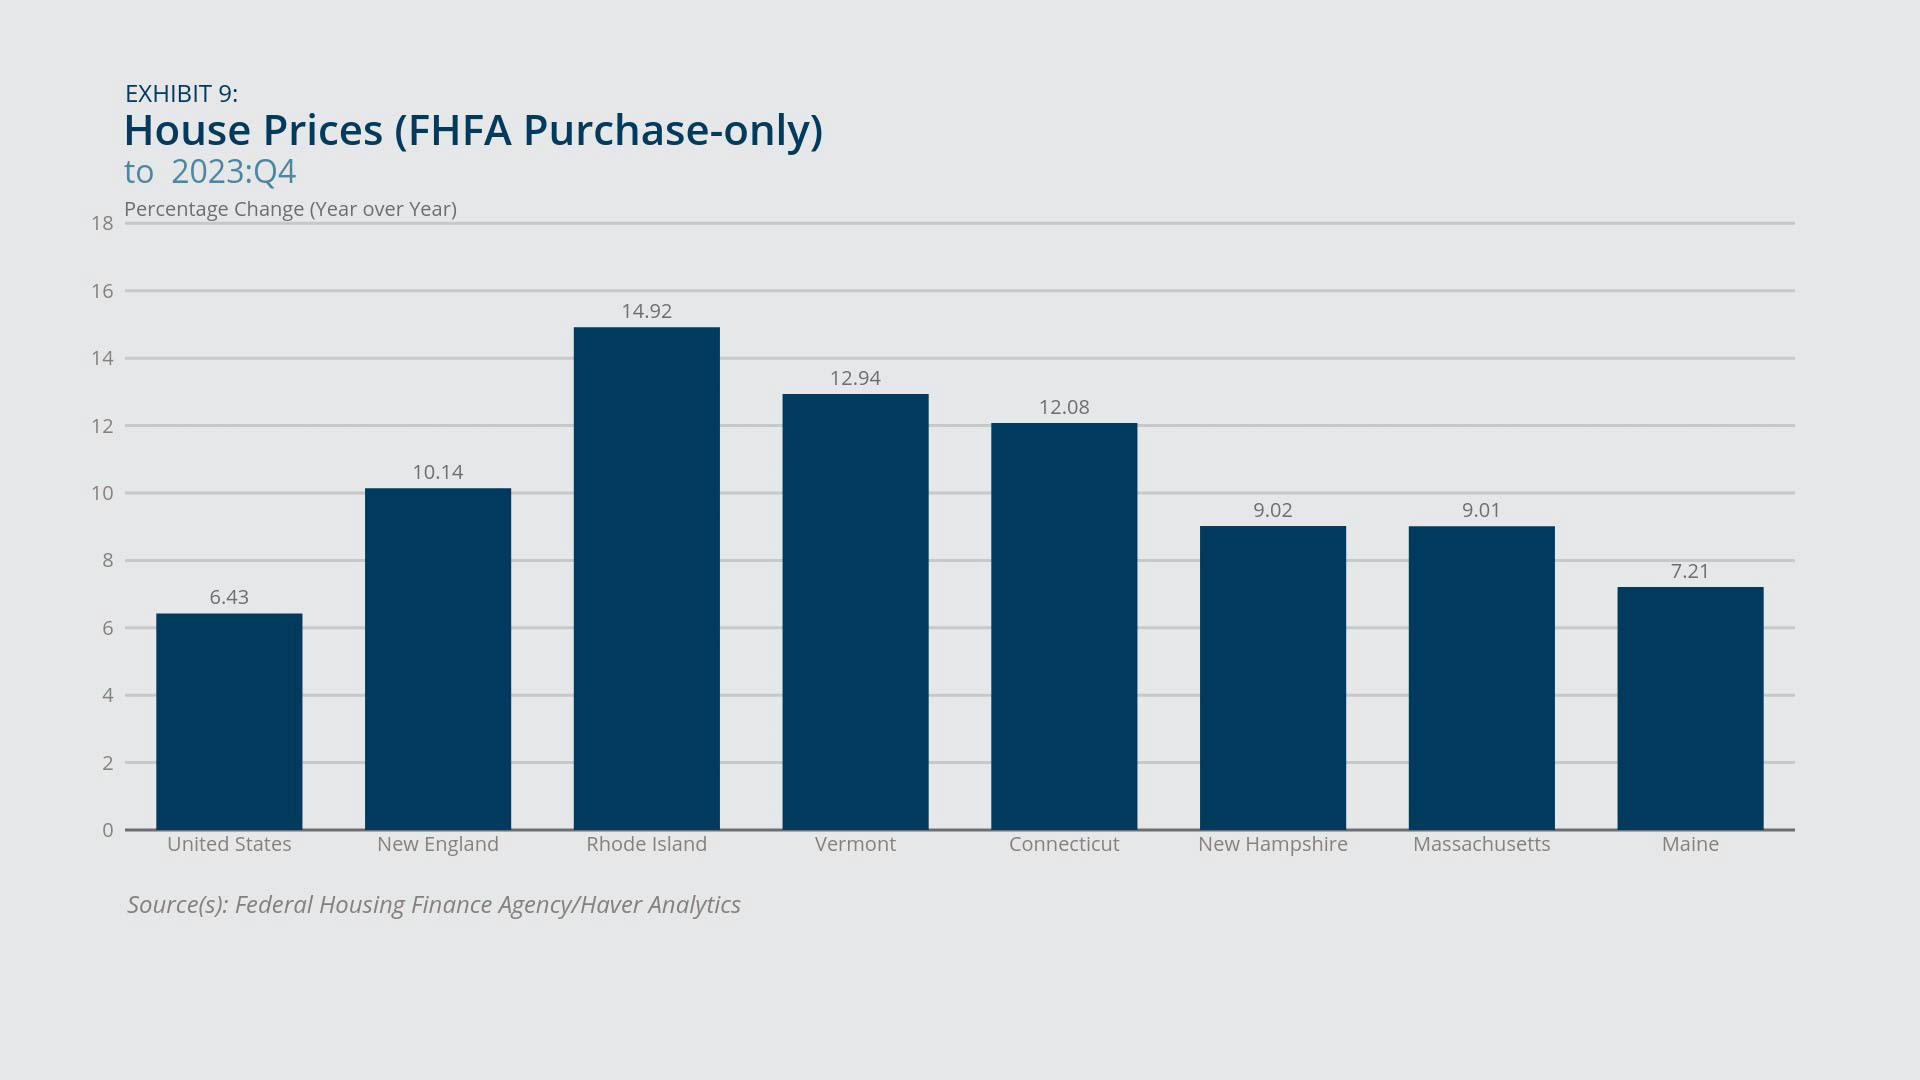
- New England house prices increased year-over-year at the highest rates in Rhode Island and Vermont and at the lowest rates in Massachusetts and Maine in the fourth quarter of 2023. In contrast to residential house-price patterns, office rents in the Boston area increased minimally, consistent with an ongoing rise in vacancy rates.
Sign up for new research and data on the New England economy.
Payroll Employment
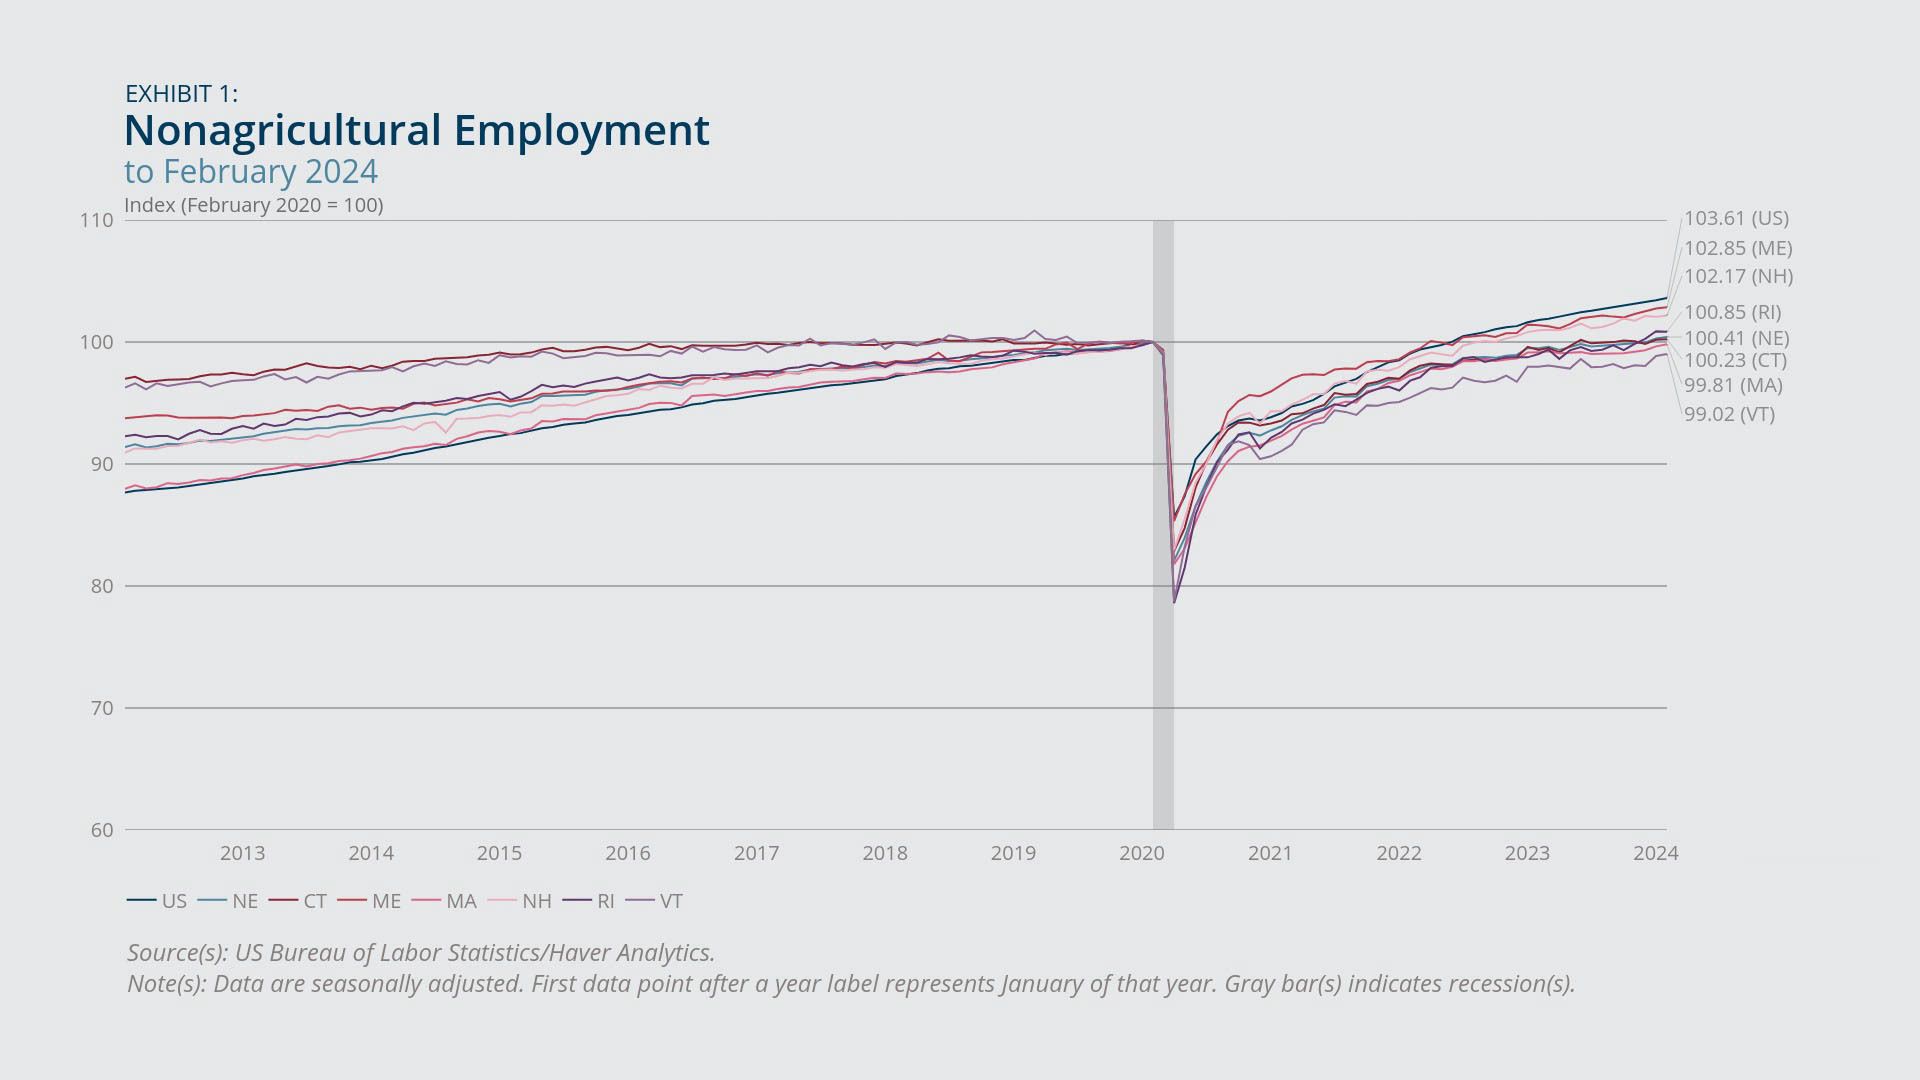
- The region exhibited robust employment growth in February 2024, adding 9,000 jobs during the month.
- Since the onset of the pandemic and over the past year, job growth in the educational and health services sector has helped drive overall employment growth in New England.
Payroll employment in New England grew robustly in February 2024, adding 9,000 jobs during the month. With this growth, the region further exceeded its pre-pandemic employment benchmark (Exhibit 1). Employment growth since February 2020 remained notably slower in the region (0.4 percent) than in the nation as a whole (3.6 percent). New England exhibited stronger employment growth over the past year, although this recent growth still trails the corresponding year-over-year growth rate in the United States (0.9 percent and 1.8 percent, respectively, not shown). Employment in Maine, New Hampshire, Rhode Island, and Connecticut has grown beyond its pre-pandemic benchmarks. In Massachusetts and Vermont, employment is below its February 2020 levels, although employment in Massachusetts is closely approaching its pre-pandemic benchmark (0.2 percent below the February 2020 level).
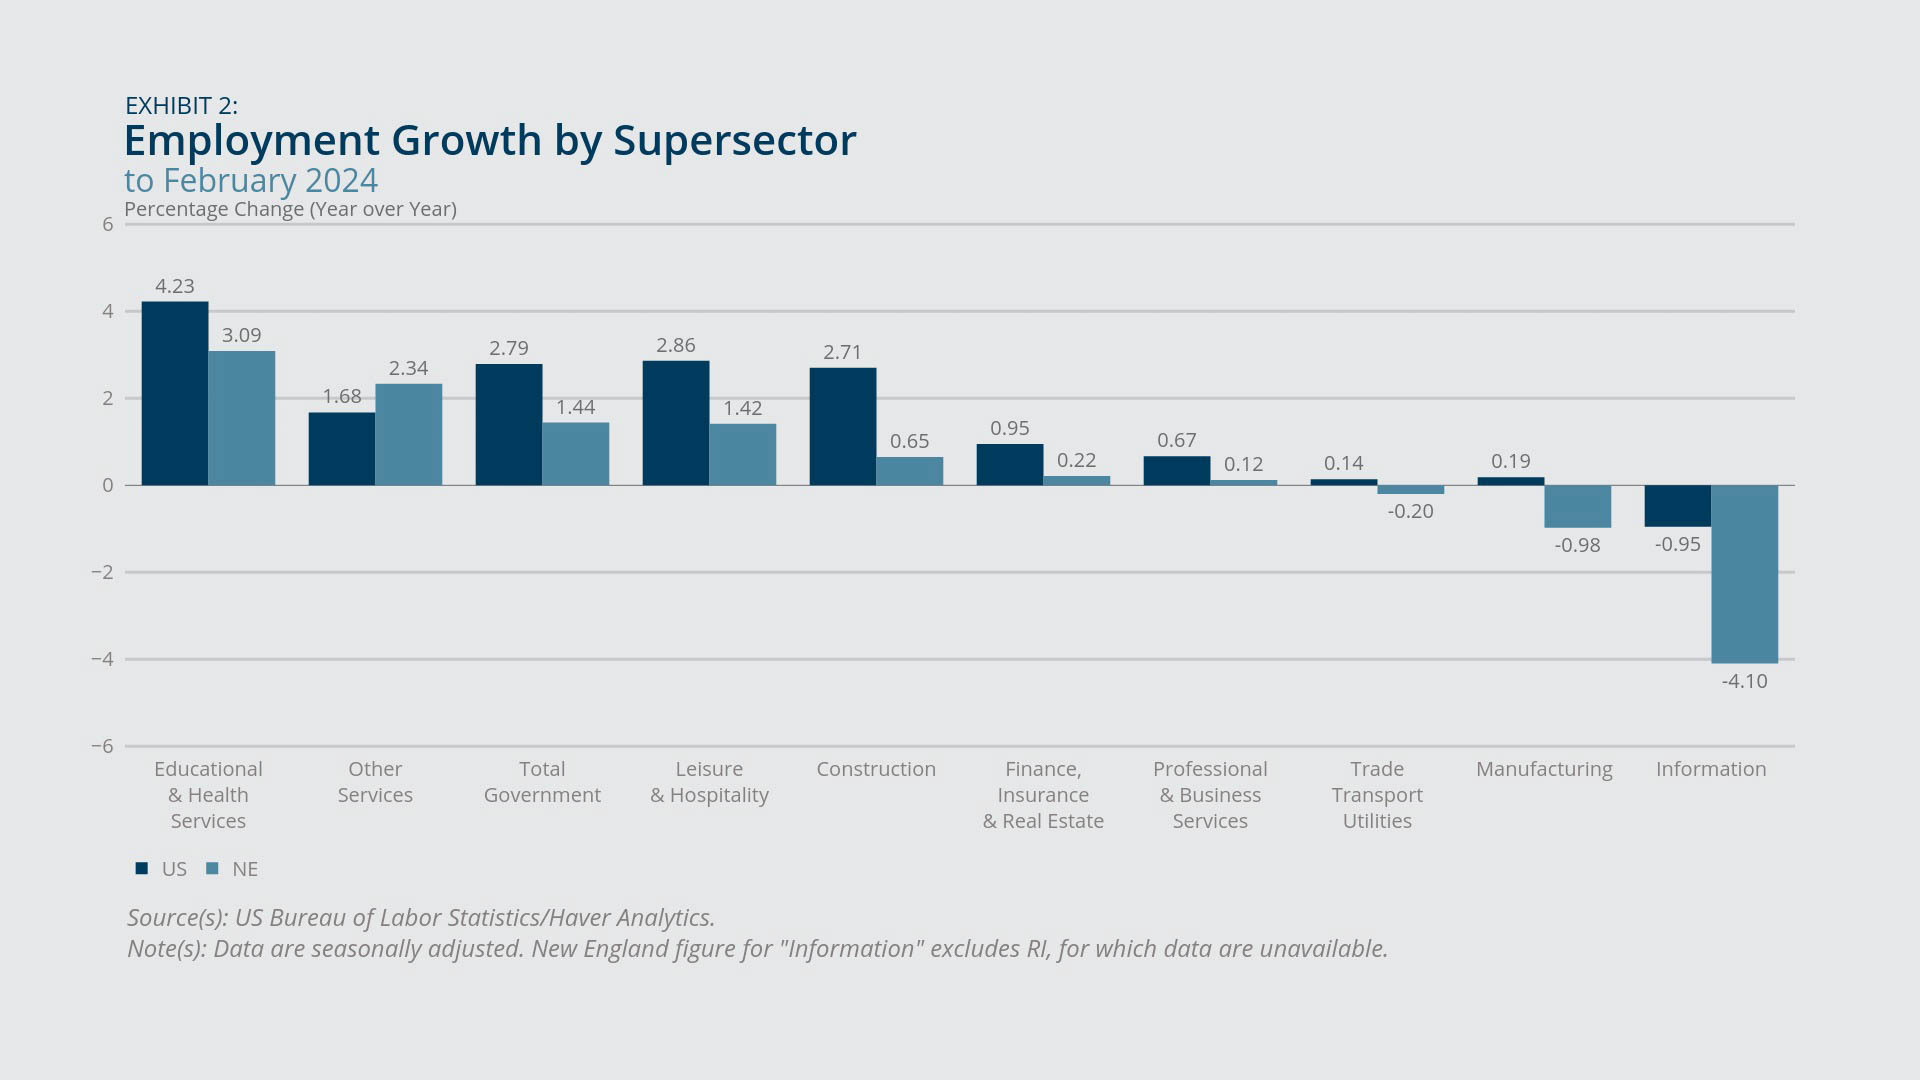
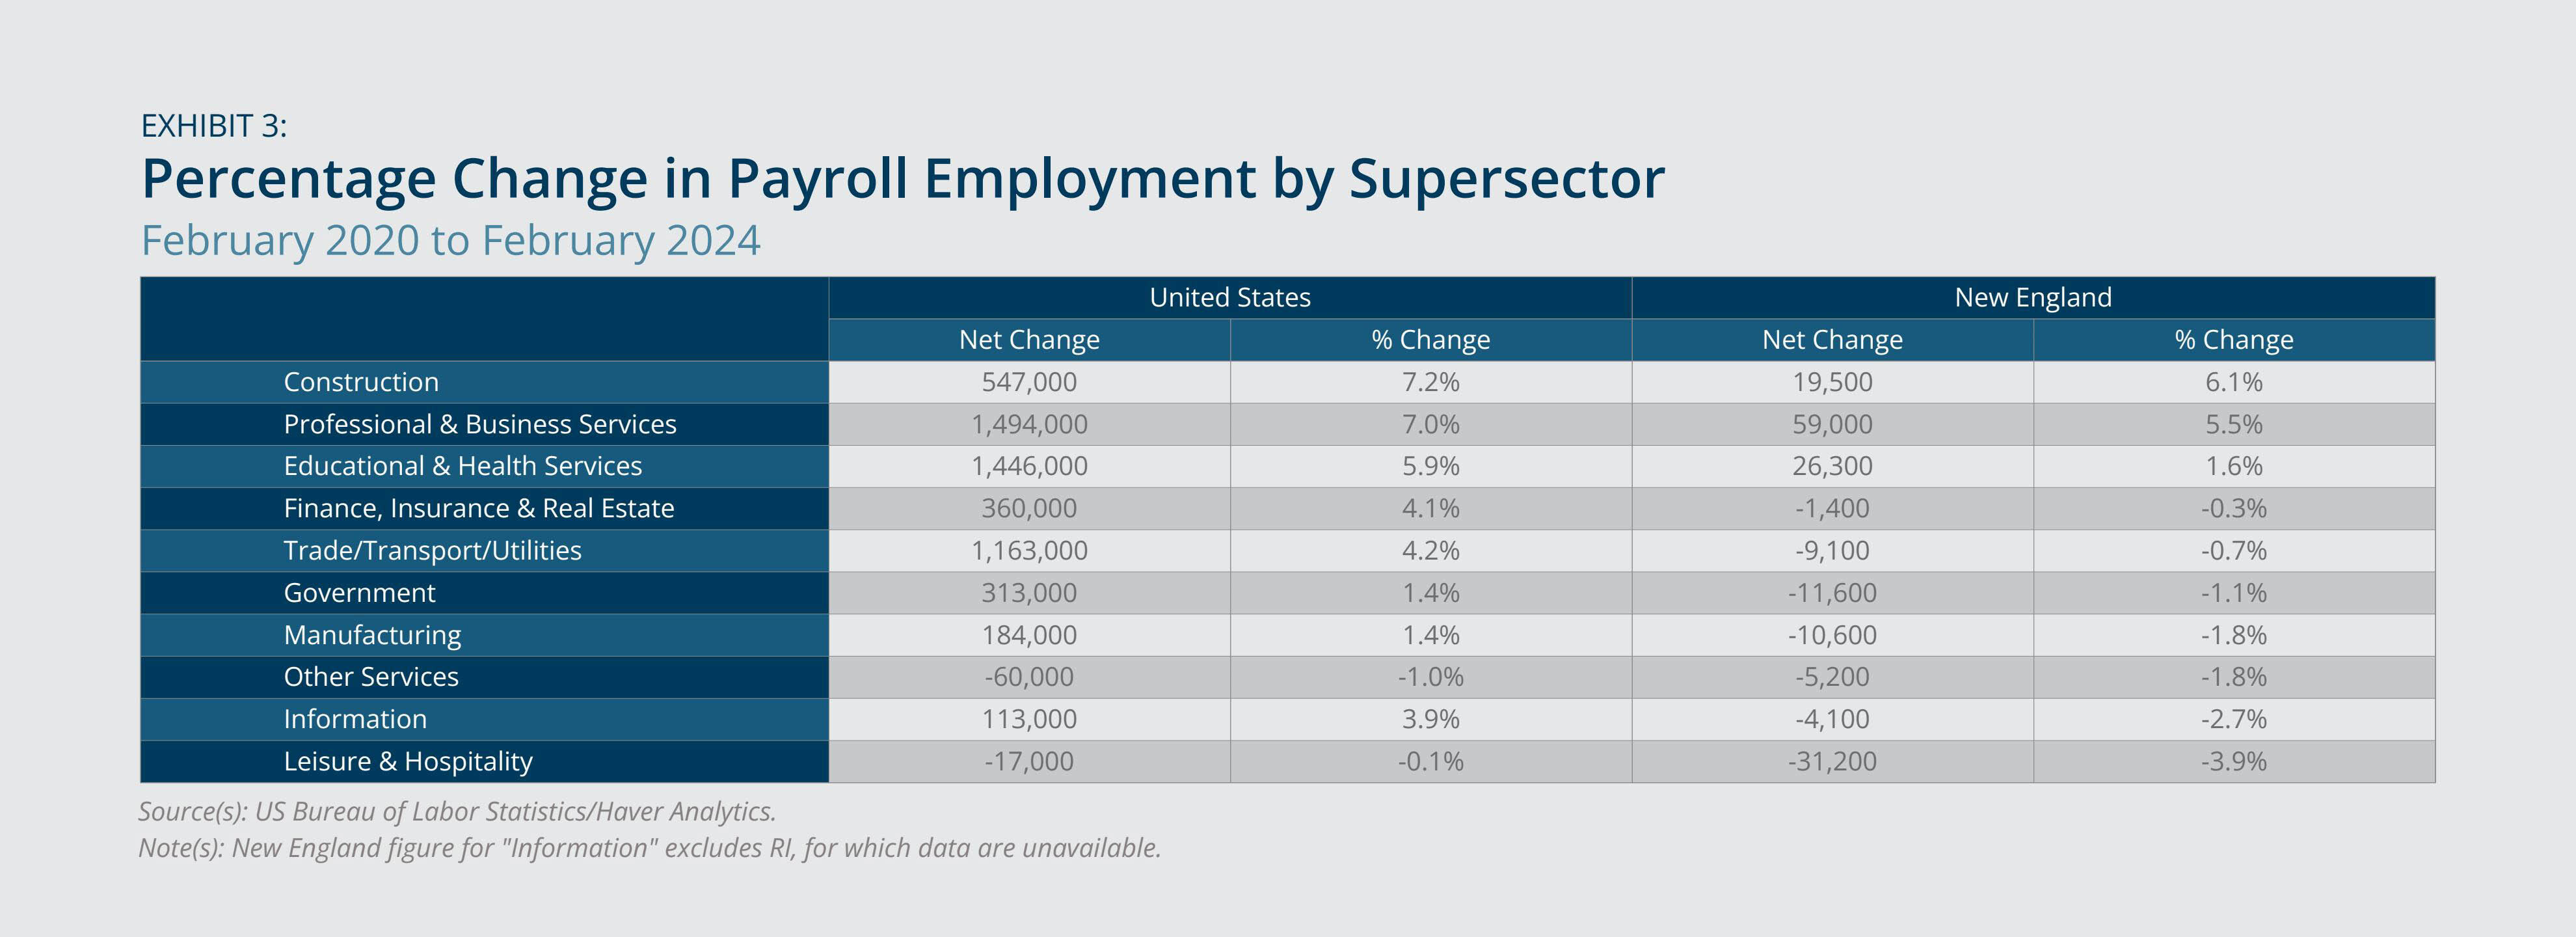
Employment growth in New England also differed across sectors. In February 2024, educational and health services exhibited the largest year-over-year job growth in the region (3.1 percent), followed by other services (2.3 percent) and government (1.4 percent) (Exhibit 2).1 However, assessing the broad period from the start of the pandemic through February 2024 shows that the construction sector experienced the largest job growth (6.1 percent), followed by professional and business services and educational and health services (5.5 percent and 1.6 percent, respectively) (Exhibit 3). By contrast, employment in leisure and hospitality, which experienced a large negative impact from the pandemic, remained below its February 2020 benchmark (3.9 percent lower) and continued to reflect the largest such gap among sectors.

Federal Reserve Bank of Boston
Federal Reserve Bank of Boston
Federal Reserve Bank of Boston
Unemployment and Labor Force Participation
- The low unemployment rate in New England was below the US rate and reflected a slight year-over-year increase.
- Growth over the last year in labor force participation and initial claims of unemployment insurance in the region suggests that both entry into the labor force and layoffs likely contributed to slightly higher unemployment.
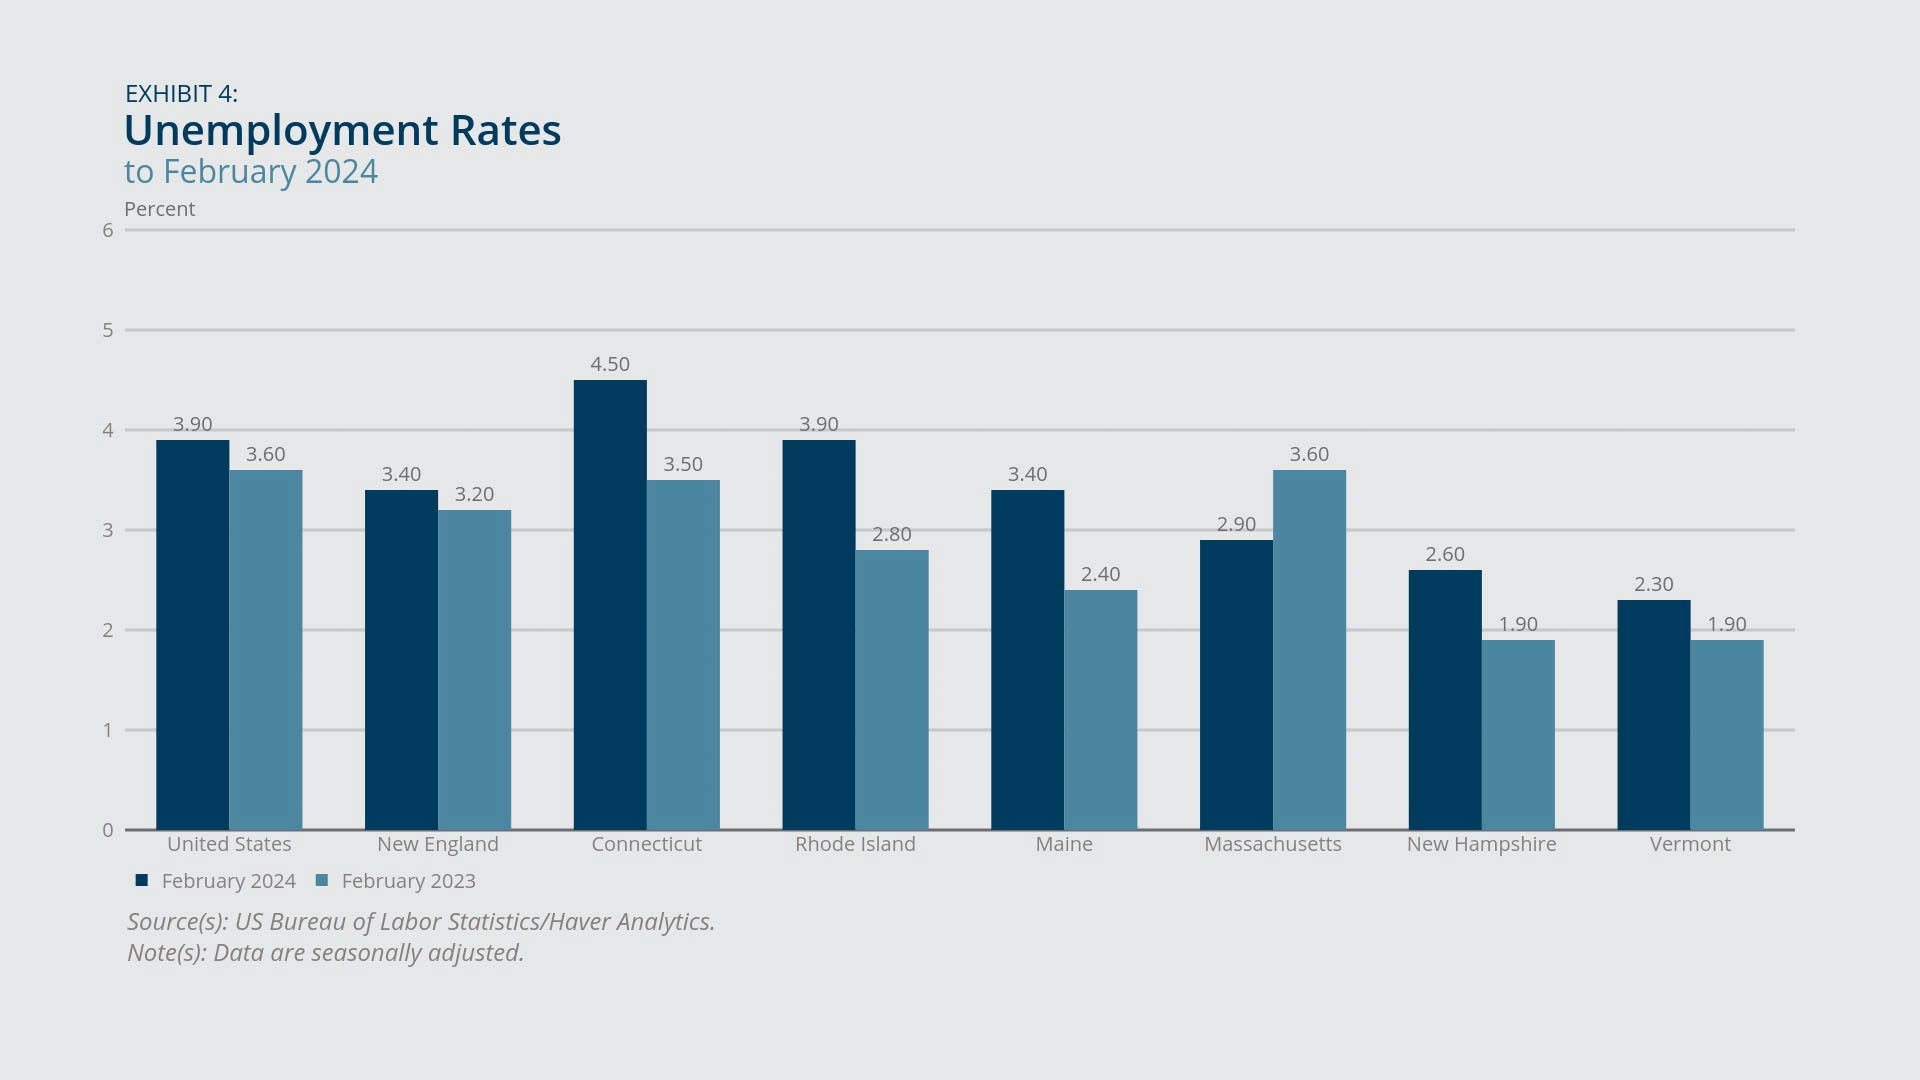
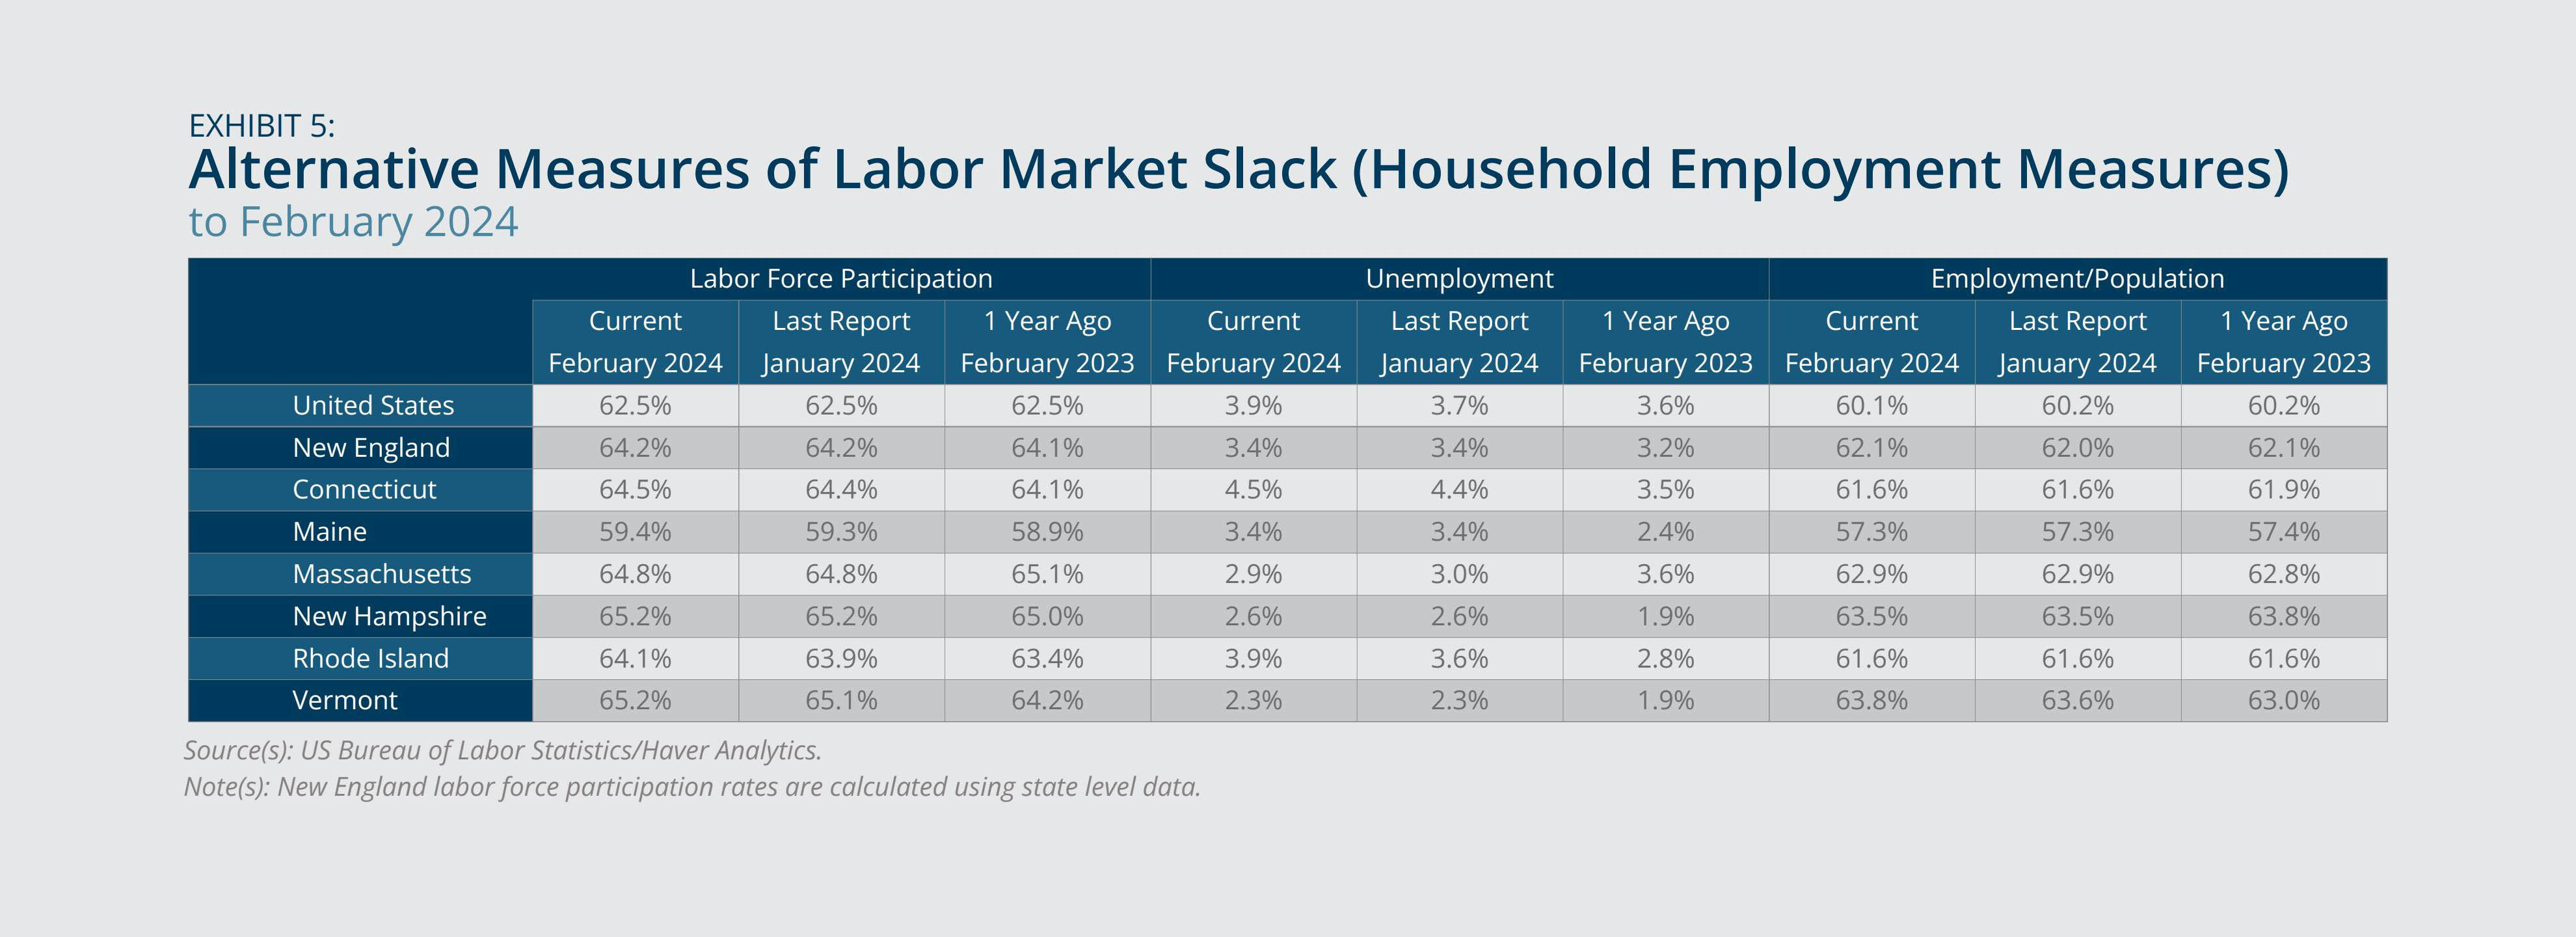
Unemployment in New England was 3.4 percent in February 2024 based on household surveys, reflecting a year-over-year increase of 0.2 percentage point and falling below the concurrent national rate of 3.9 percent (Exhibit 4). Among the New England states, unemployment rates ranged from a low of 2.3 percent in Vermont to a high of 4.5 percent in Connecticut. Additionally, every state in the region except Massachusetts experienced a year-over-year increase in the unemployment rate. In Massachusetts, the unemployment rate fell 0.7 percentage point to 2.9 percent in February 2024.
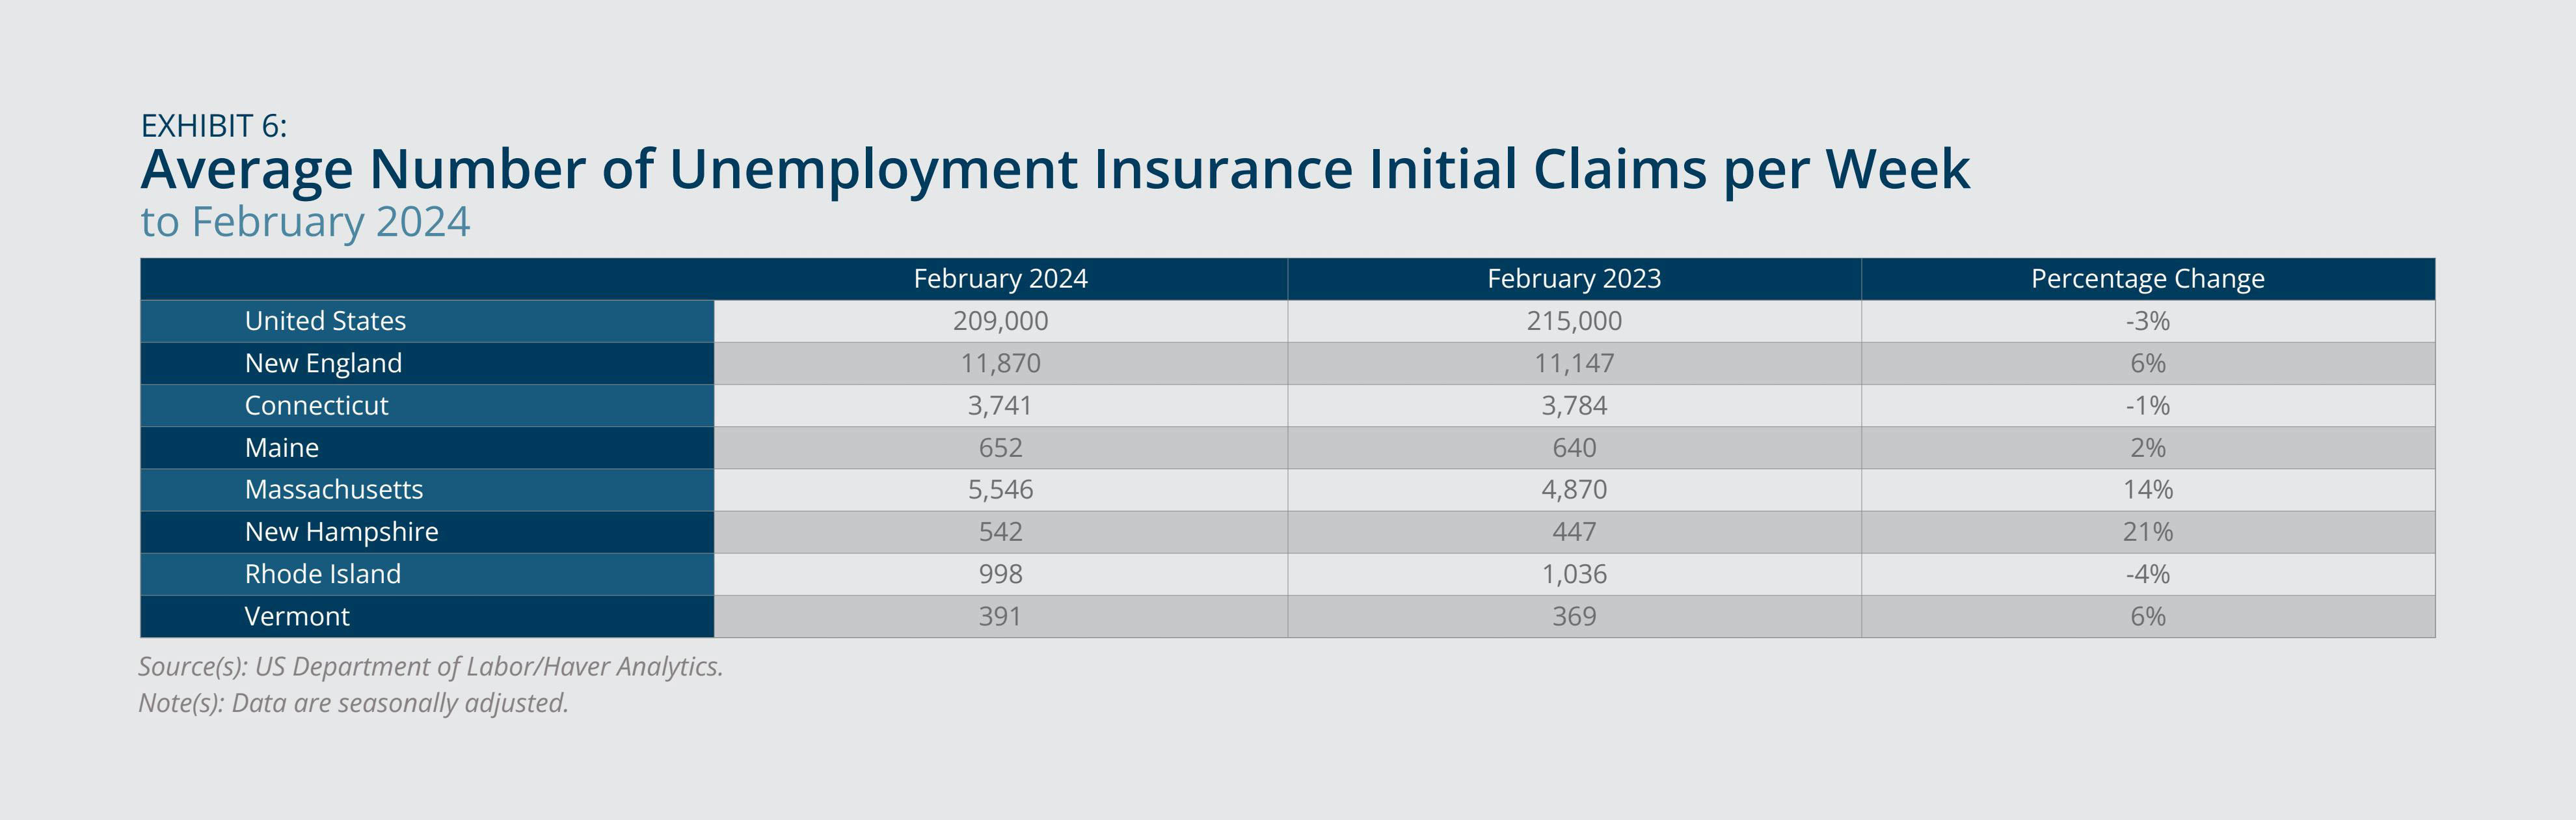
Labor force participation rates (Exhibit 5) and average weekly initial unemployment insurance (UI) claims (Exhibit 6) help highlight mechanisms contributing to observed changes in unemployment rates in New England as a whole and in each of its states. In the region, the participation rate increased year-over-year by 0.1 percentage point in February 2024 to 64.2 percent, which was higher than the national rate of 62.5 percent. New England saw a year-over-year rise in initial UI claims for the same period, which indicates that that both entry into the labor force and layoffs contributed to the region’s slightly elevated unemployment rate.2
A similar assessment applies to Maine, New Hampshire, and Vermont, all of which experienced rising participation rates and mounting initial claims. In Connecticut and Rhode Island, annual growth in unemployment rates is seemingly due in part to higher participation rates, as initial claims fell concurrently.3 By contrast, the year-over-year unemployment-rate decline in Massachusetts apparently is partly due to diminished labor force participation (0.3 percentage point decline), as initial UI claims rose year-over-year during that period.
Federal Reserve Bank of Boston
Federal Reserve Bank of Boston
Federal Reserve Bank of Boston
Inflation
- US inflation continued to exceed price growth in New England, with both rates remaining relatively unchanged over the last several months.
- Increases in shelter, food, transportation, and medical prices drove price growth in the region.
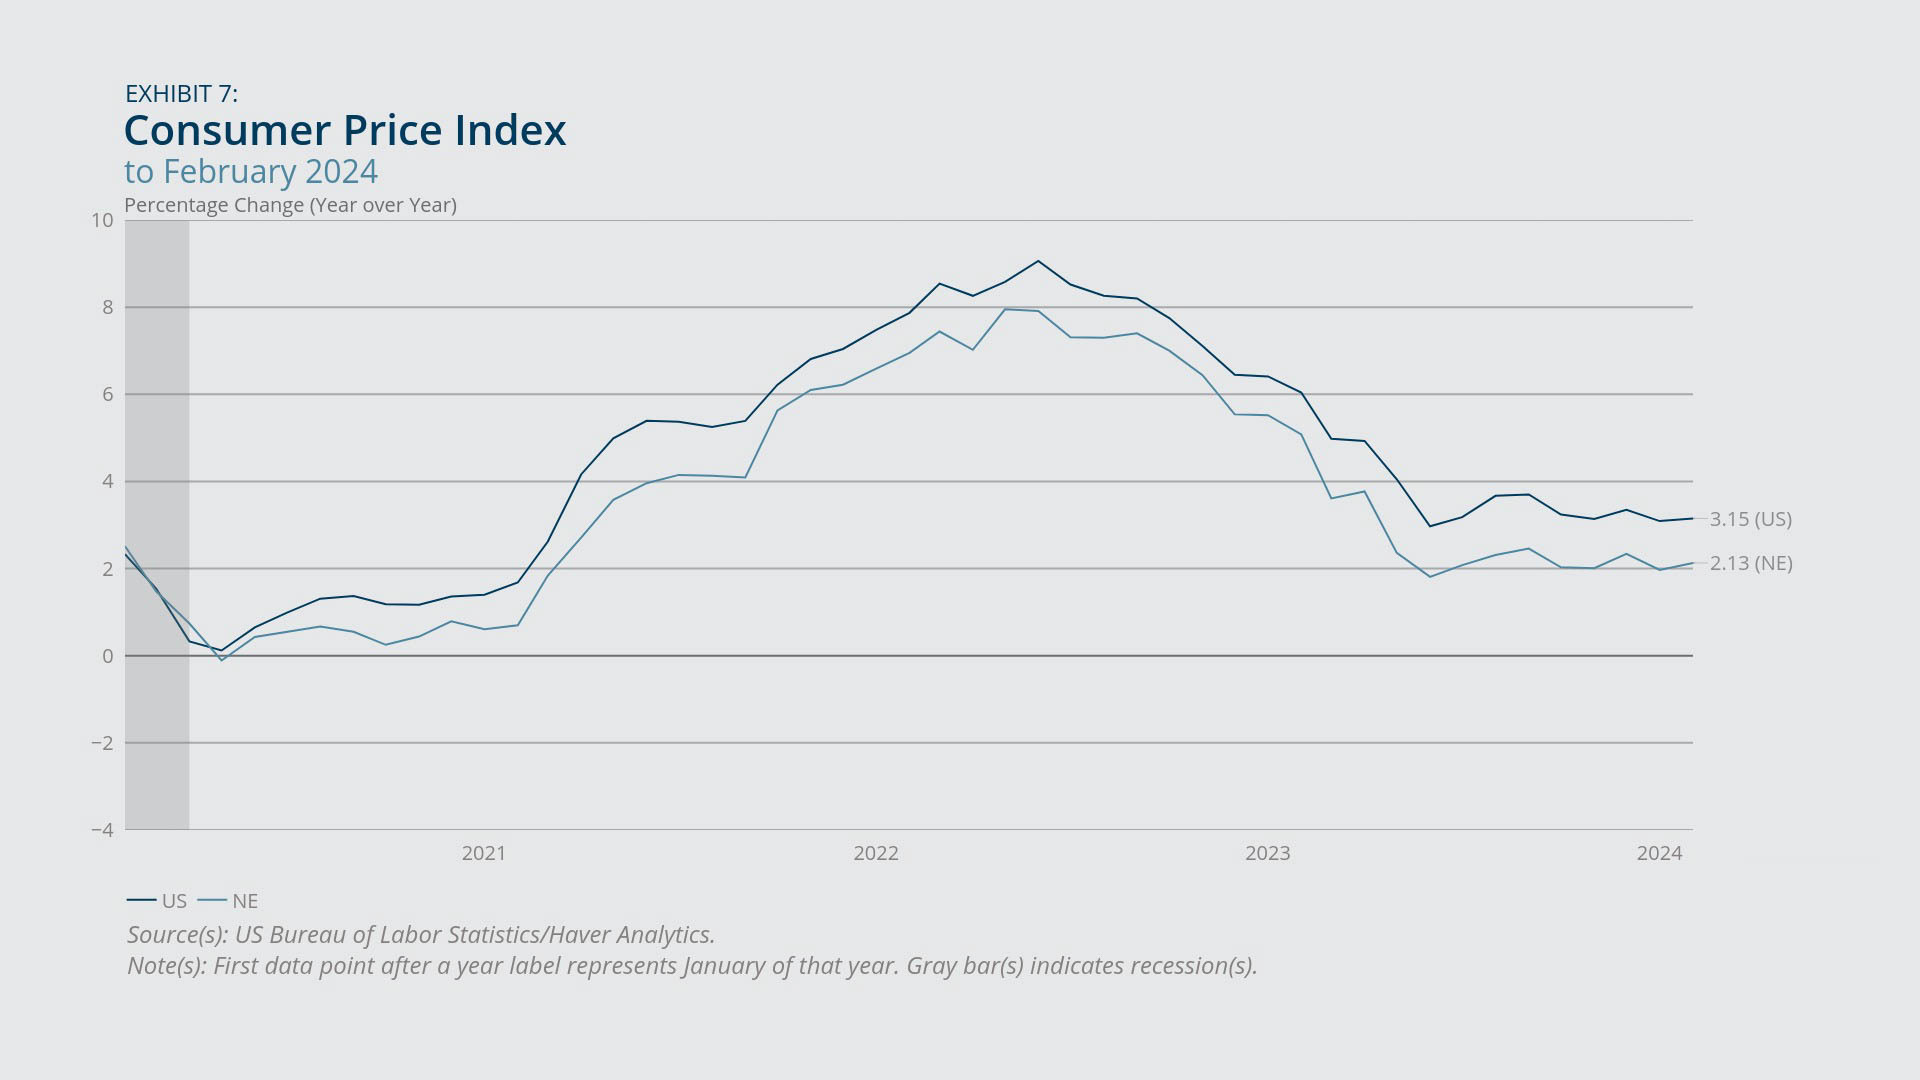
In February 2024, the inflation rate for New England was roughly 1 percentage point below the US rate, based on the Consumer Price Index: 2.1 percent versus 3.2 percent (Exhibit 7). These annual growth rates reflect a slight uptick for the region (0.2 percentage point) and the nation (0.1 percentage point) compared with annual growth in the previous month. This minimal change in inflation rates continues the trend observed since the second half of 2023.
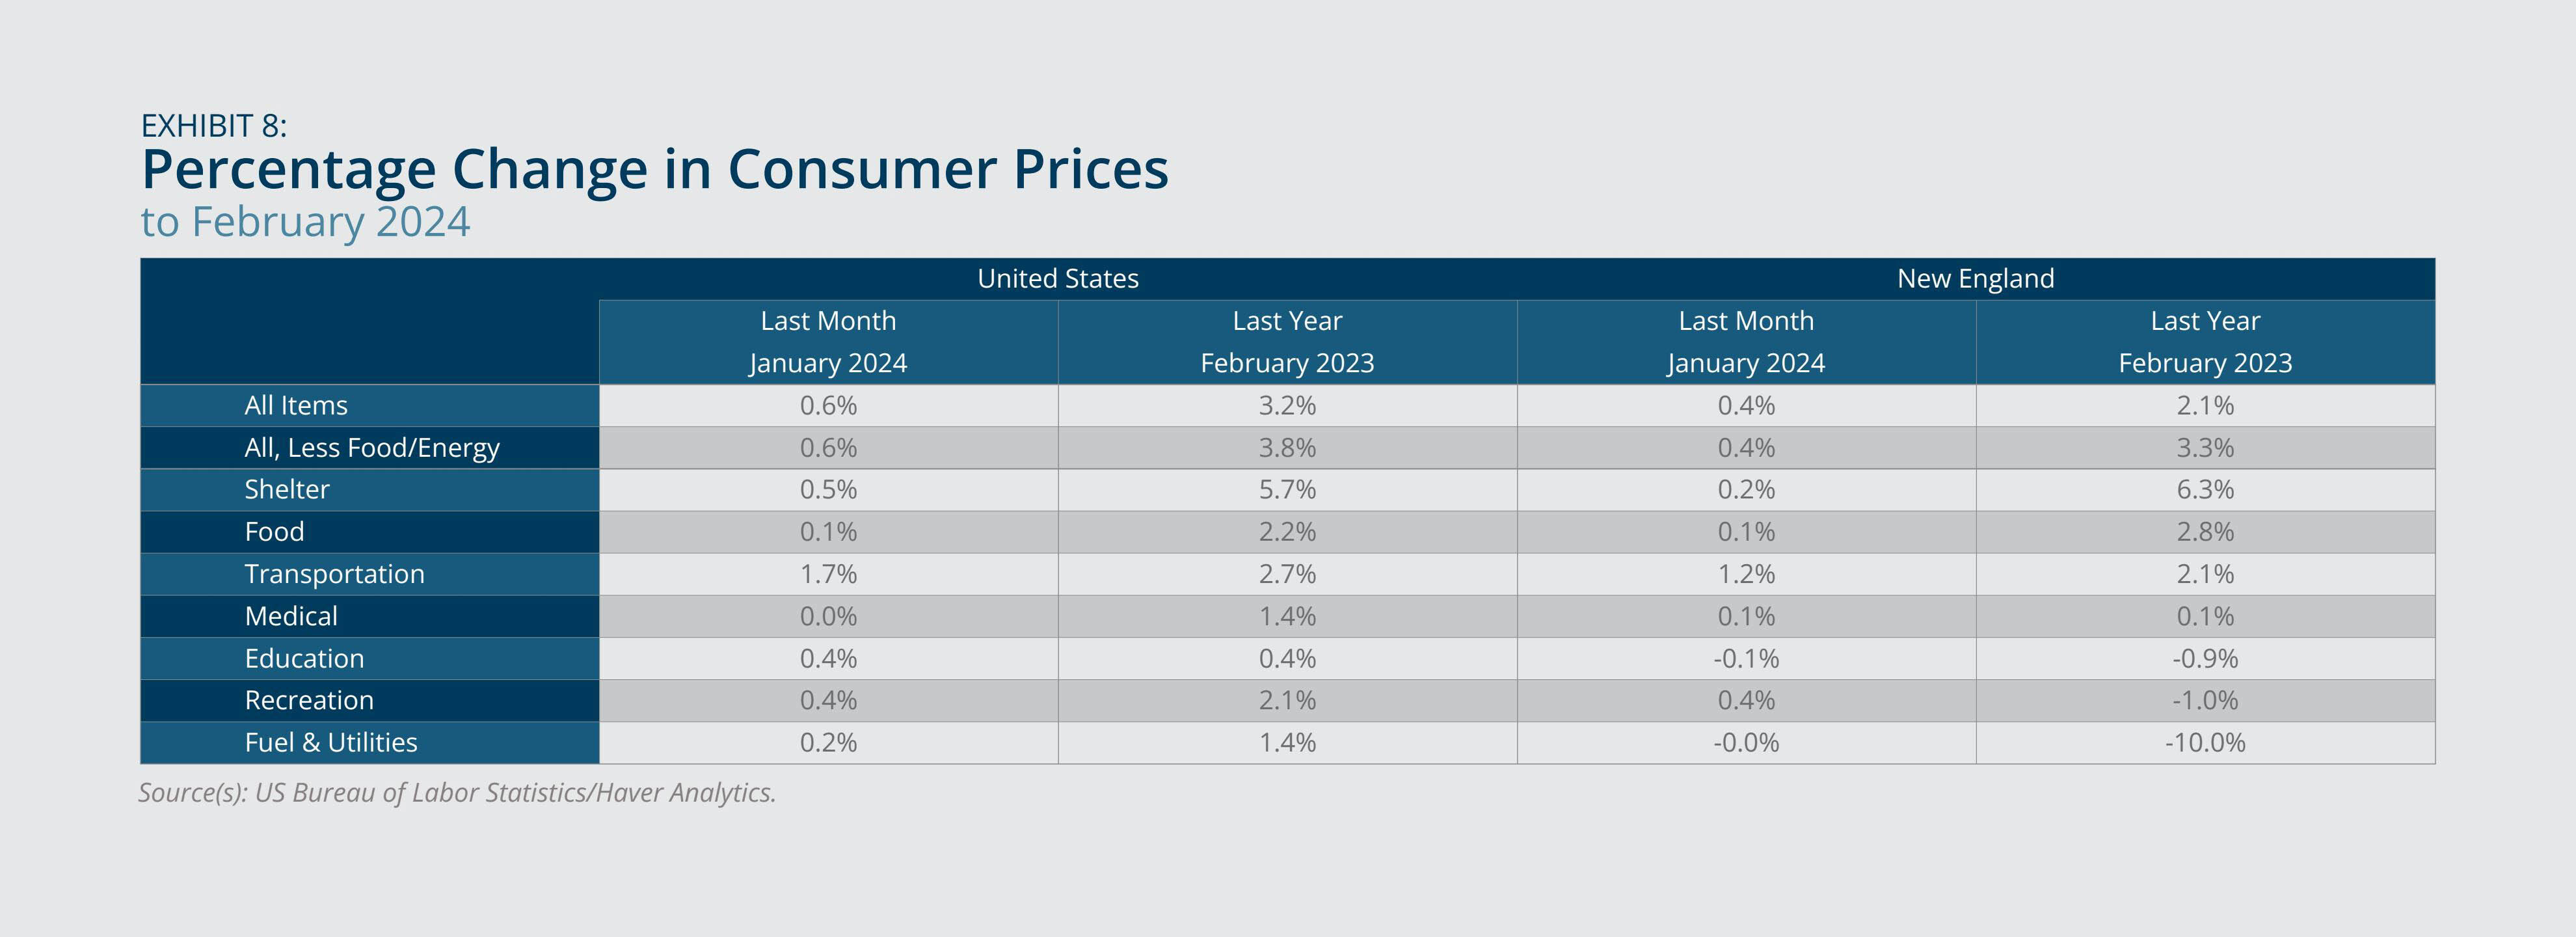
Rising shelter, food, transportation, and medical prices were the drivers of price growth in the region, as all other expenditure categories experienced a year-over-year decline (Exhibit 8). At the national level, all expenditure categories displayed positive annual price growth. Core inflation in New England (3.3 percent) exceeded the overall inflation rate in the region, reflecting in part a large decline in fuel and utilities prices (10 percent decrease)
Federal Reserve Bank of Boston
Federal Reserve Bank of Boston
Real Estate Markets
- New England experienced notably higher annual house-price growth compared with the United States.
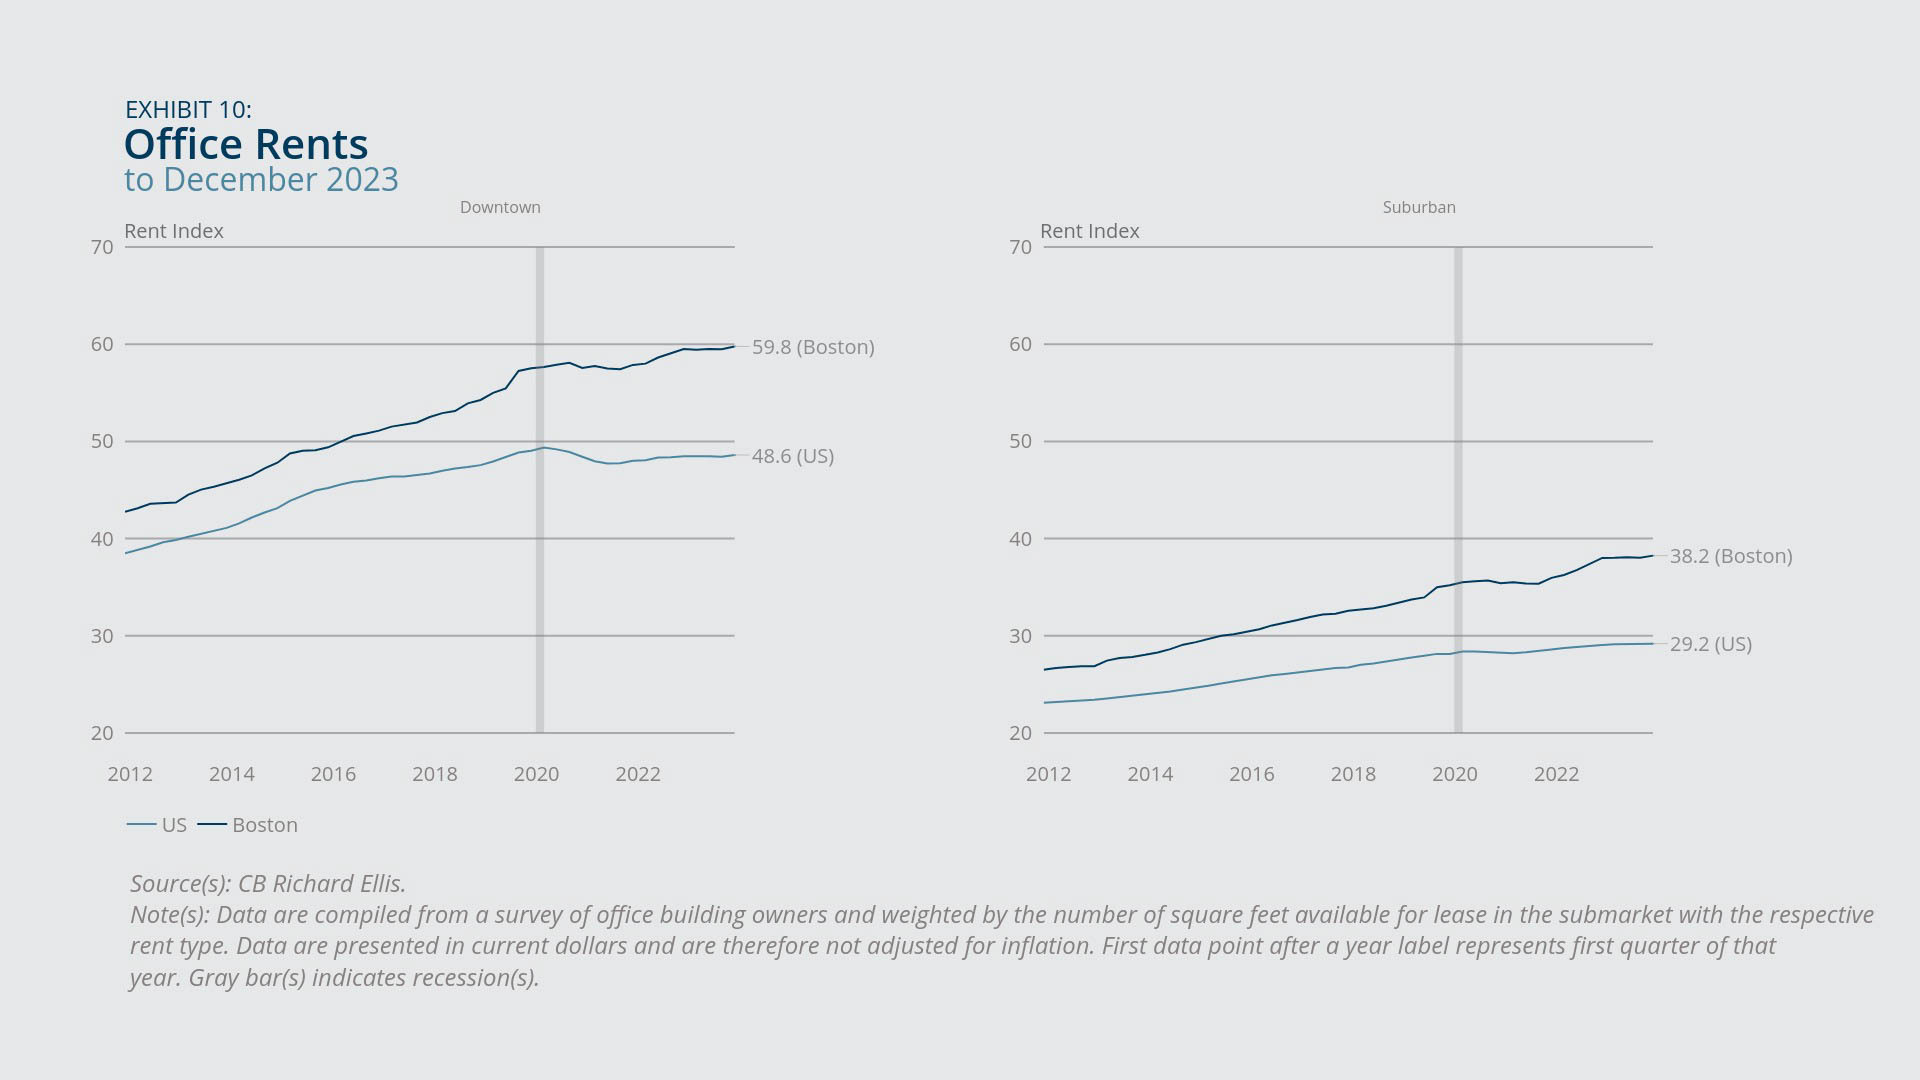
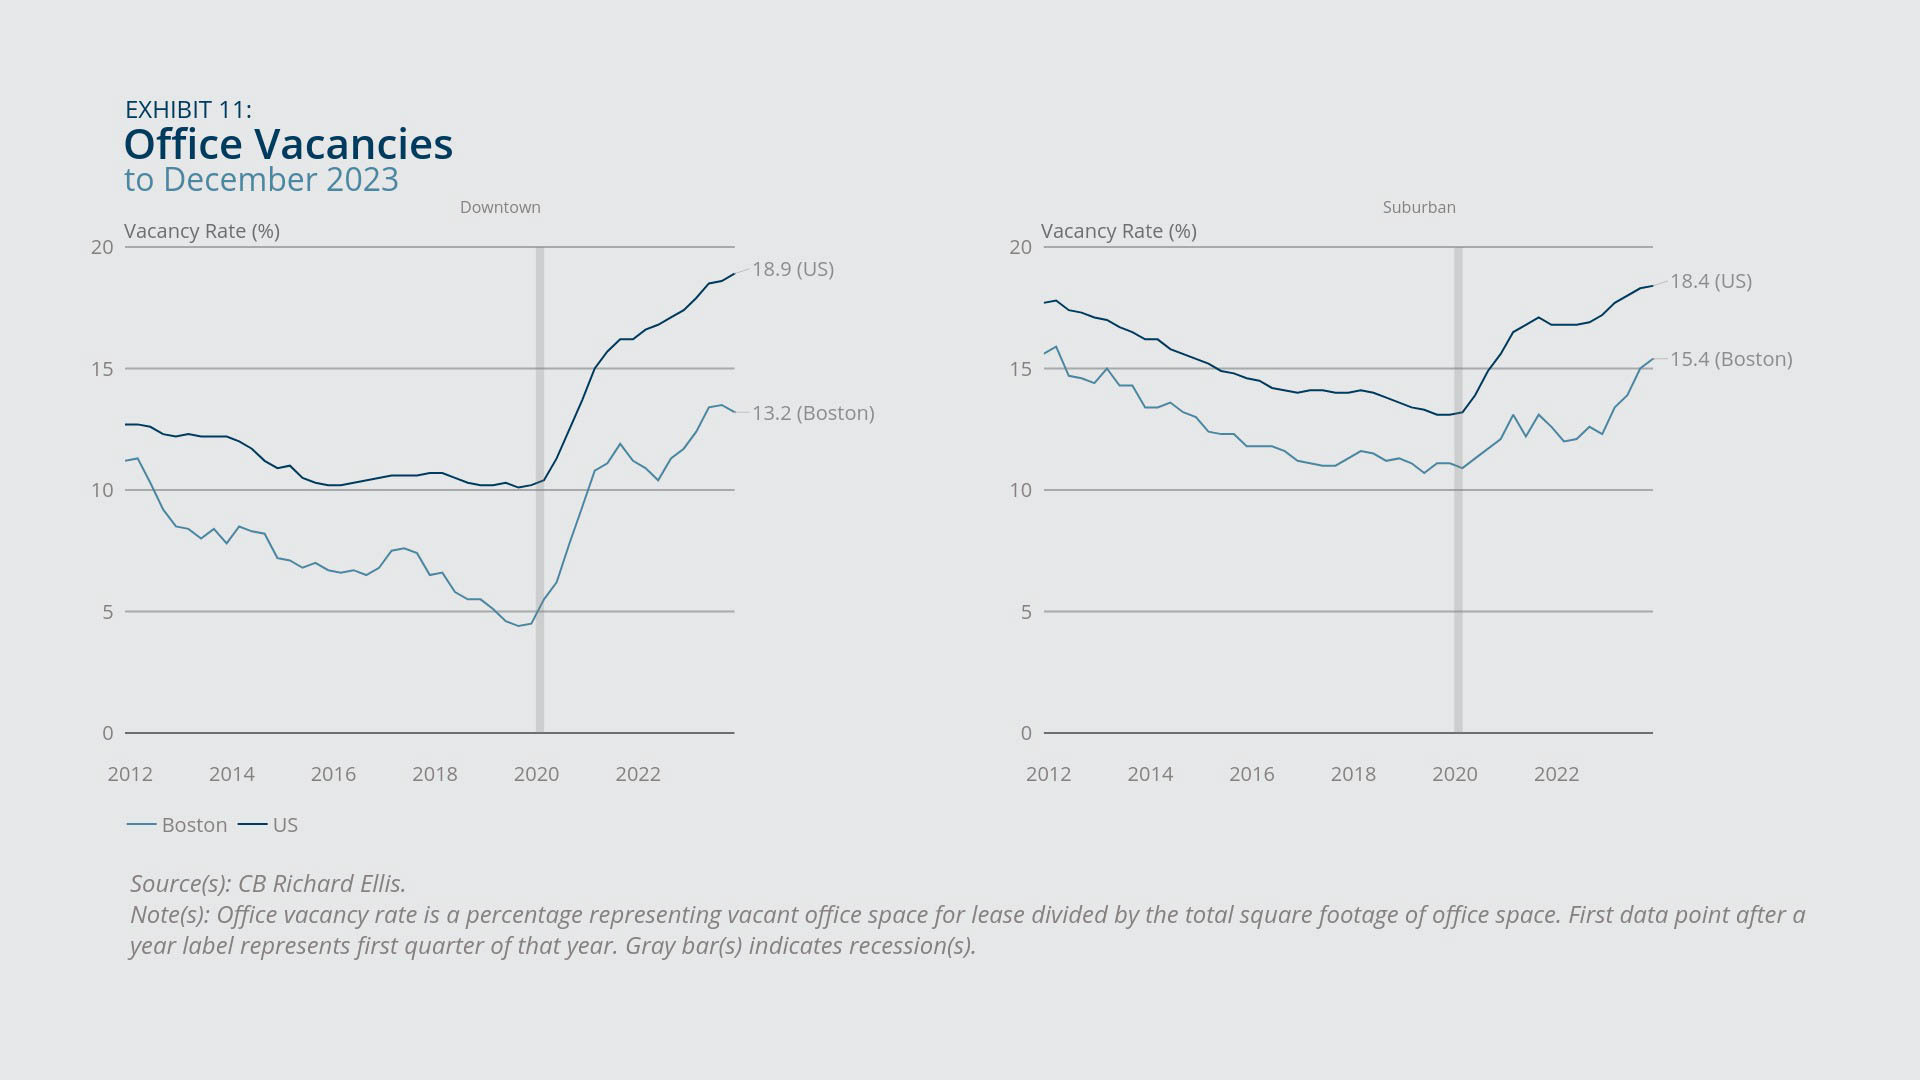
- In downtown and suburban Boston, office rents remained relatively stable, while the office vacancy rate continued to increase year-over-year.
House prices, as measured by the Federal Housing Finance Agency House Price Index, grew year-over-year for New England in the last quarter of 2023 (10.1 percent), far surpassing the corresponding national growth rate (6.4 percent) (Exhibit 9). Among the region’s states, house-price growth was highest in Rhode Island and Vermont (14.9 percent and 12.9 percent, respectively) and lowest in Massachusetts and Maine (9.0 percent and 7.2 percent, respectively), and in each state, it exceeded the US rate. A low housing inventory continues to be cited as an important source of rising house prices.5
By contrast, office rents in the commercial real estate market rose minimally, as measured by a Rent Index from CB Richard Ellis. In the fourth quarter of 2023, office rents increased modestly year-over-year in the Boston area (0.4 percent downtown and 0.6 percent suburban) as well as the nation (0.2 percent downtown and 0.4 percent suburban) (Exhibit 10). Consistent with the sluggish growth in office rents, the prevalence of office vacancies has continued to rise, resulting in high vacancy rates in the last quarter of 2023 in both Boston (13.2 percent downtown and 15.4 percent suburban) and the United States (18.9 percent downtown and 18.4 percent suburban) (Exhibit 11). These conditions in the commercial real estate market may have fiscal implications, as declining property values have prompted building owners to seek reductions in related tax liabilities.6
Federal Reserve Bank of Boston
Federal Reserve Bank of Boston
Federal Reserve Bank of Boston
Consumer Confidence
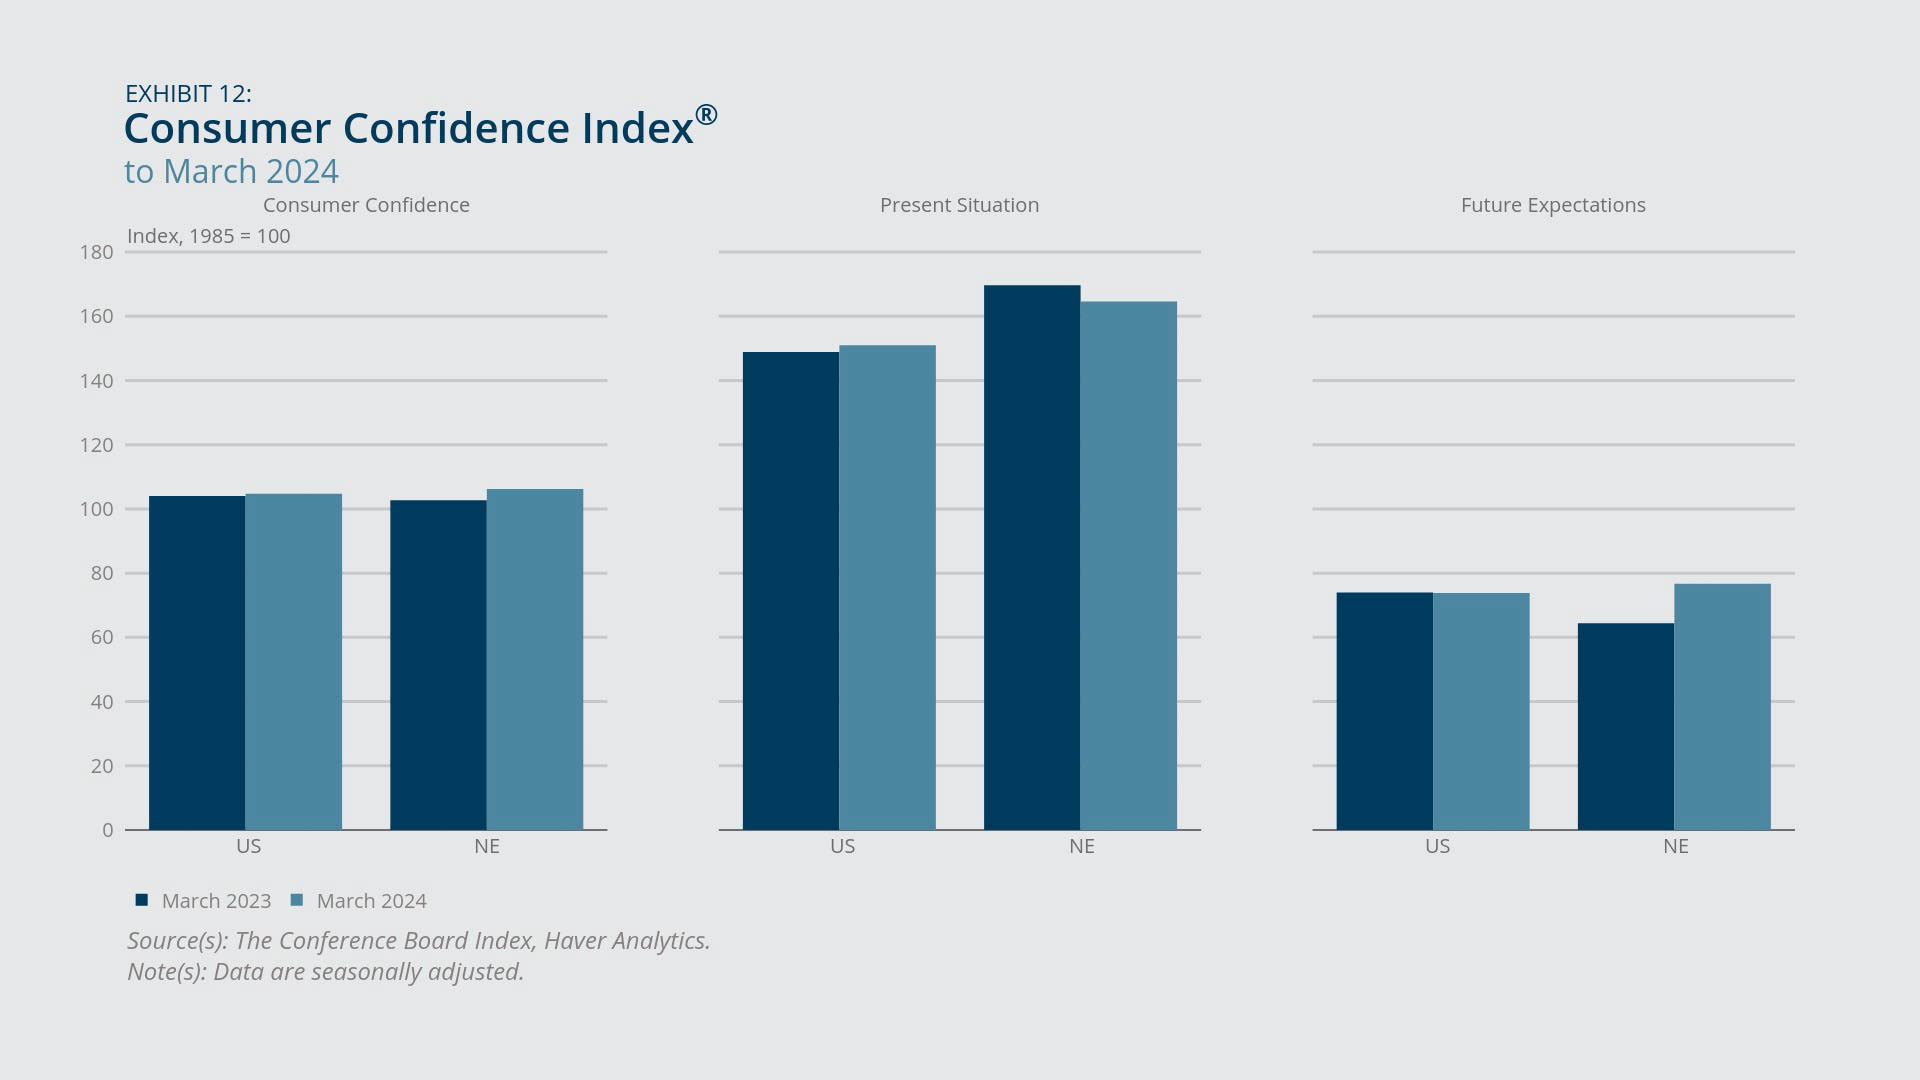
- Consumers in New England and the United States were slightly more confident in March 2024 than they were a year earlier.
Consumer confidence in March 2024, as measured by the Conference Board’s Consumer Confidence Index, experienced a small year-over-year increase in both New England and the United States (Exhibit 12). In the region, this increase was driven by improved future expectations, as consumer sentiment about the present declined. By contrast, the national increase in consumer confidence resulted from a more positive outlook about the present, as consumer expectations about the future decreased slightly. Relative to levels in the previous month, consumers in March indicated an uptick in worries about food and gas prices. However, concerns about gas prices have been trending downward generally, while alarm about the US political environment has increased.7
Federal Reserve Bank of Boston

 About the Authors
Osborne Jackson,
Federal Reserve Bank of Boston
Osborne Jackson is a senior economist at the New England Public Policy Center in the Federal Reserve Bank of Boston Research Department. His research interests include labor economics and urban and regional economics.
Email: Osborne.Jackson@bos.frb.org
Matthew Sexton, Federal Reserve Bank of Boston
Acknowledgments
Kelly Jackson, Federal Reserve Bank of Boston
Endnotes
- Using available disaggregated data that are not seasonally adjusted, we find that year-over-year employment growth in New England was 3.3 percent for educational and health services in February 2024, with lower growth for educational services (2.1 percent) compared with health care and social assistance (3.6 percent).
- From February 2023 to February 2024, the region’s civilian noninstitutional population increased by 67,000 persons (0.5 percent) while the labor force increased by nearly 55,000 workers (0.7 percent), including an increase of more than 19,000 unemployed workers. Therefore, the increase in unemployed workers reflected by the rise in initial claims (723 more) made a relatively small contribution to the net positive change in the number of unemployed workers.
- During the February 2023–February 2024 period, the civilian noninstitutional population in Connecticut grew by 15,000 persons (0.5 percent) while the labor force grew by more than 20,000 workers (1.1 percent). The labor force growth was driven entirely by an increase of over 20,000 unemployed workers, given that the state saw a concurrent decline of more than 200 employed workers. In Rhode Island over the same period, the civilian noninstitutional population increased by 5,000 persons (0.6 percent) and the labor force increased by nearly 9,400 persons (1.6 percent), including an increase of more than 6,500 unemployed workers. Thus, in both states, the decrease in unemployed workers reflected by the fall in initial claims (43 fewer in Connecticut and 38 fewer in Rhode Island) had a relatively small mitigating effect on the net positive change in unemployed workers.
- From February 2023 to February 2024, the civilian noninstitutional population in Massachusetts grew by 30,000 persons (0.5 percent) while the labor force increased minimally, by fewer than 300 workers (0.01 percent). The labor force increase was driven entirely by an increase of more than 23,500 employed workers, given that the state saw a concurrent decrease of over 23,200 unemployed workers. Thus, the increase in unemployed workers reflected by the rise in initial claims (676 more) had a relatively small mitigating effect on the net negative change in unemployed workers.
- See Dylan Sloan, “Jerome Powell Says `The Housing Market Is in a Very Challenging Situation Right Now’ and Interest Rate Cuts Alone Won’t Solve a Long-running Inventory Crisis,” Fortune, March 8, 2024.
- See Catherine Carlock, “As Office Market Slump Continues, More Downtown Property Owners Are Seeking Tax Breaks,” Boston Globe, February 26, 2024.
- See “US Consumer Confidence Little Changed in March,” Conference Board press release, March 26, 2024.
Resources
Site Topics
Keywords
- Regional economy ,
- Economic Conditions ,
- New England