Q2 2018: Snapshot of the New England Economy through June 19, 2018 


Economic activity continued to improve in 2018
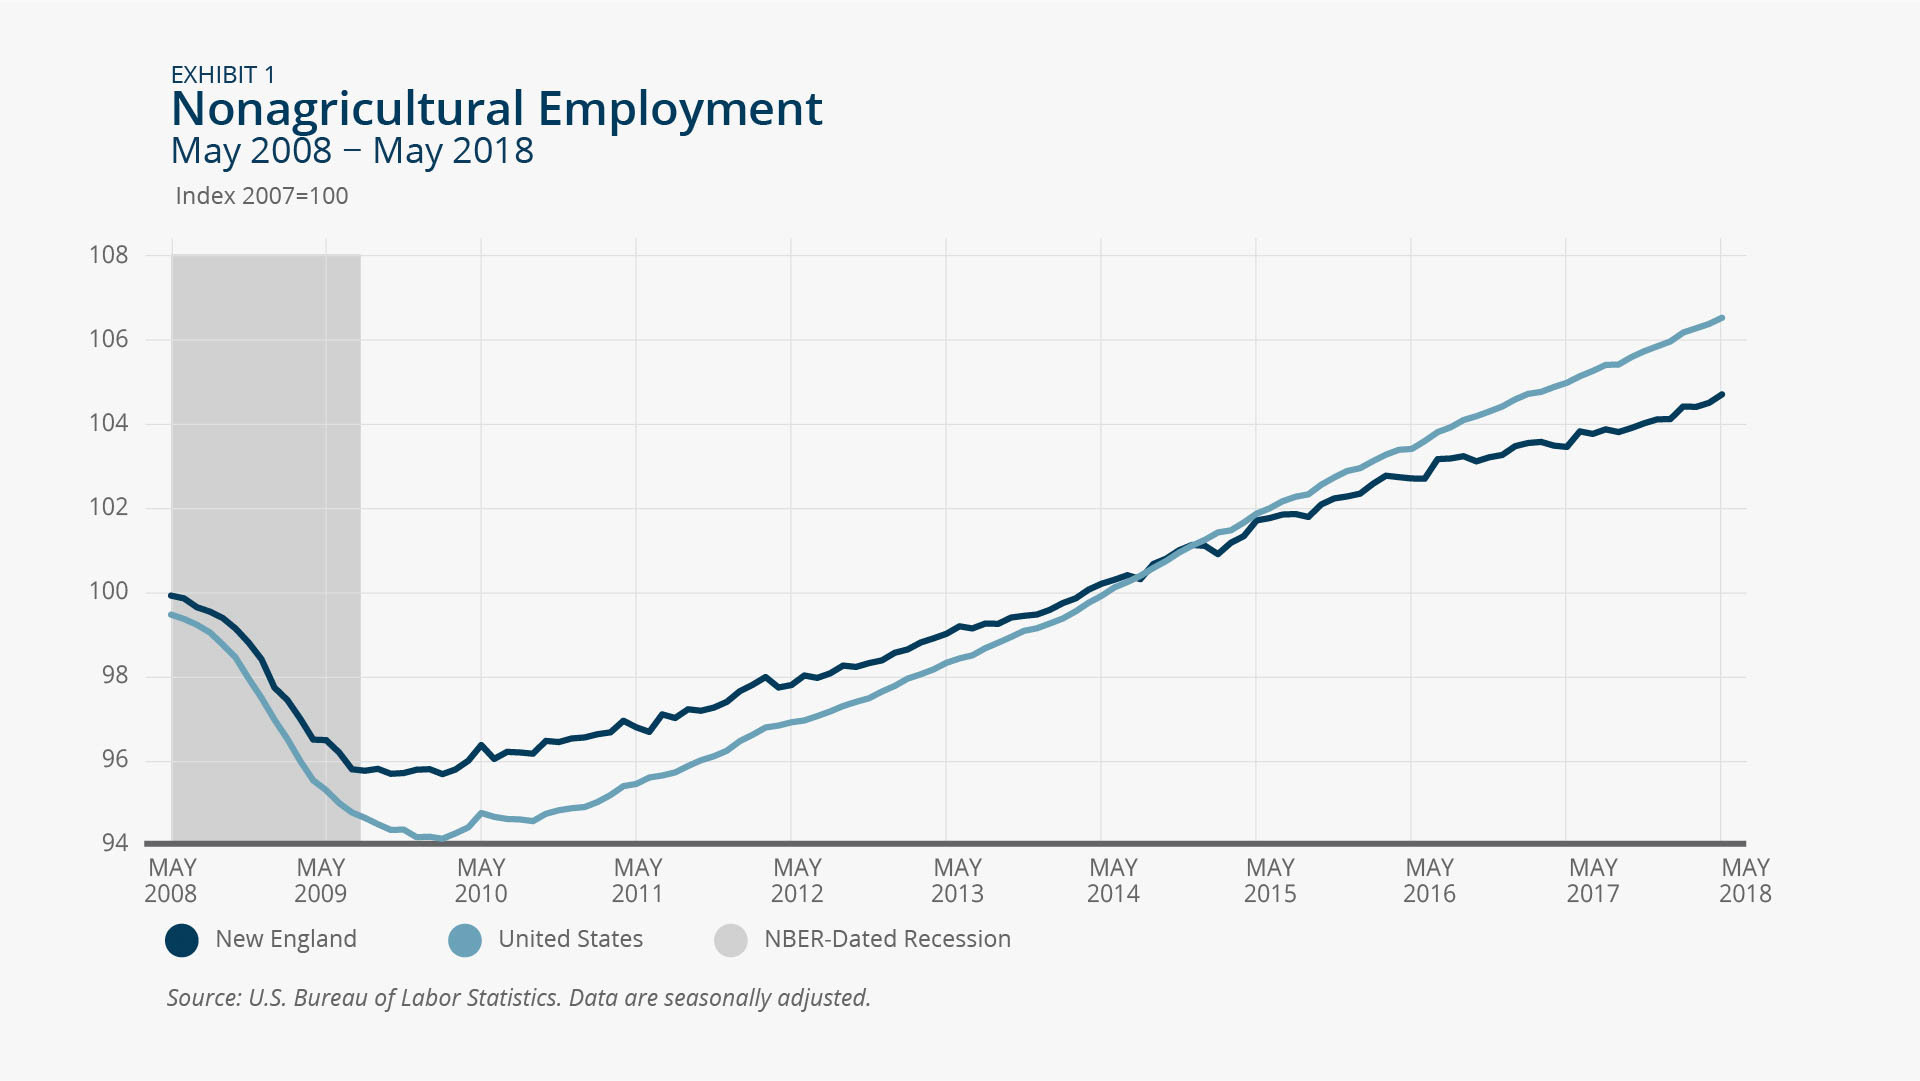
In the early months of 2018, New England and the United States continued to see improvements in economic indicators. Through May 2018, employment increased and unemployment rates fell relative to one year prior. Through the first quarter of 2018, home prices continued to climb both regionally and nationally compared to the same period in 2017.
Payroll Employment
Employment grows in New England at a slightly slower pace than the nation
New England continued to post job gains through May 2018. Between Payroll employment increased 1.6 percent nationally and 1.3 percent regionally between May 2017 and May 2018 (Exhibit 1). Although employment increased over this period in each of the New England states, the job growth rates varied and were all below the national growth rate. Within New England, New Hampshire posted the strongest year-over-year job gains through May 2018, increasing 1.9 percent (Exhibit 2). Year-over-year payroll employment was weakest in Vermont, growing by 0.4 percent.
Construction job gains in New England outpace national growth
In May 2018, the construction supersector led the region in employment growth, with year-over-year gains (4.9 percent) that outpaced national employment growth in construction (4.1 percent) (Exhibit 3). Similarly, regional job growth in the professional & business services supersector and the leisure & hospitality supersector both exceeded national job growth in those supersectors. Over the same time period, government employment shrank in the region by 0.2 percent while nationally, government jobs grew 0.1 percent. Manufacturing employment increased in five of the six New England states; Maine (2.9 percent), Connecticut (2.6 percent), Rhode Island (2.5 percent), and New Hampshire (2.5 percent) all experienced manufacturing job growth above the national rate for that supersector (2.0 percent). Employment in the information supersector dropped 2.6 percent year-over-year in New England and fell 0.7 percent nationally.

Federal Reserve Bank of Boston
Federal Reserve Bank of Boston
Federal Reserve Bank of Boston
Unemployment
Unemployment rates declined in four New England states
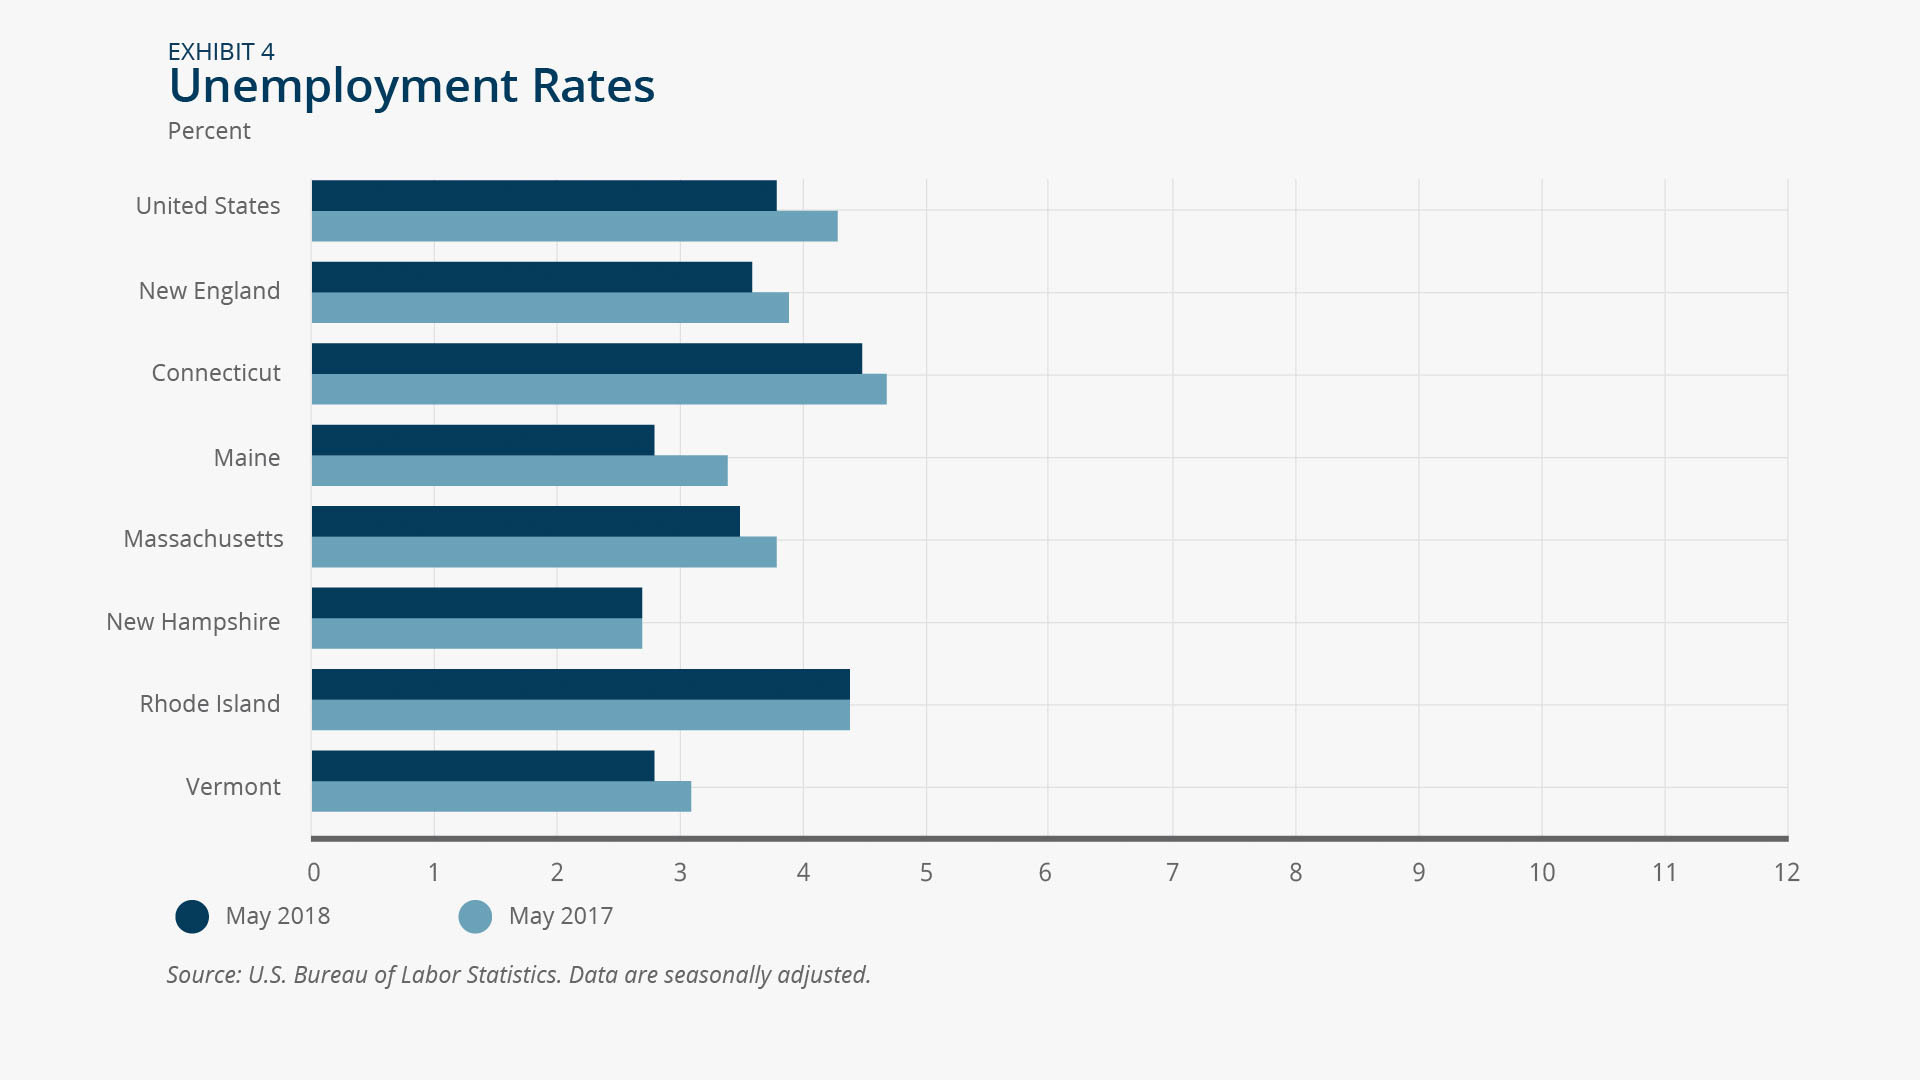
Four of the six New England states saw unemployment rate declines between May 2017 and May 2018. The exceptions were New Hampshire and Rhode Island, where the unemployment rate remained flat at 2.7 percent and 4.4 percent, respectively (Exhibit 4). Considering the region as a whole, the unemployment rate decreased 0.3 percentage points year-over-year, resulting in a rate of 3.6 percent. New England unemployment has continued at that rate since February 2018 and remains at its lowest level since June 2001. As of May 2018, New Hampshire retained the lowest unemployment rate in the region, followed by Maine and Vermont, both at 2.8 percent. Only two states, Connecticut (4.5 percent) and Rhode Island (4.4 percent), had unemployment rates that exceeded the national rate (3.8 percent), which is at its lowest level since April 2000.
Federal Reserve Bank of Boston
Home Prices
Rhode Island records the fastest house price growth in the region
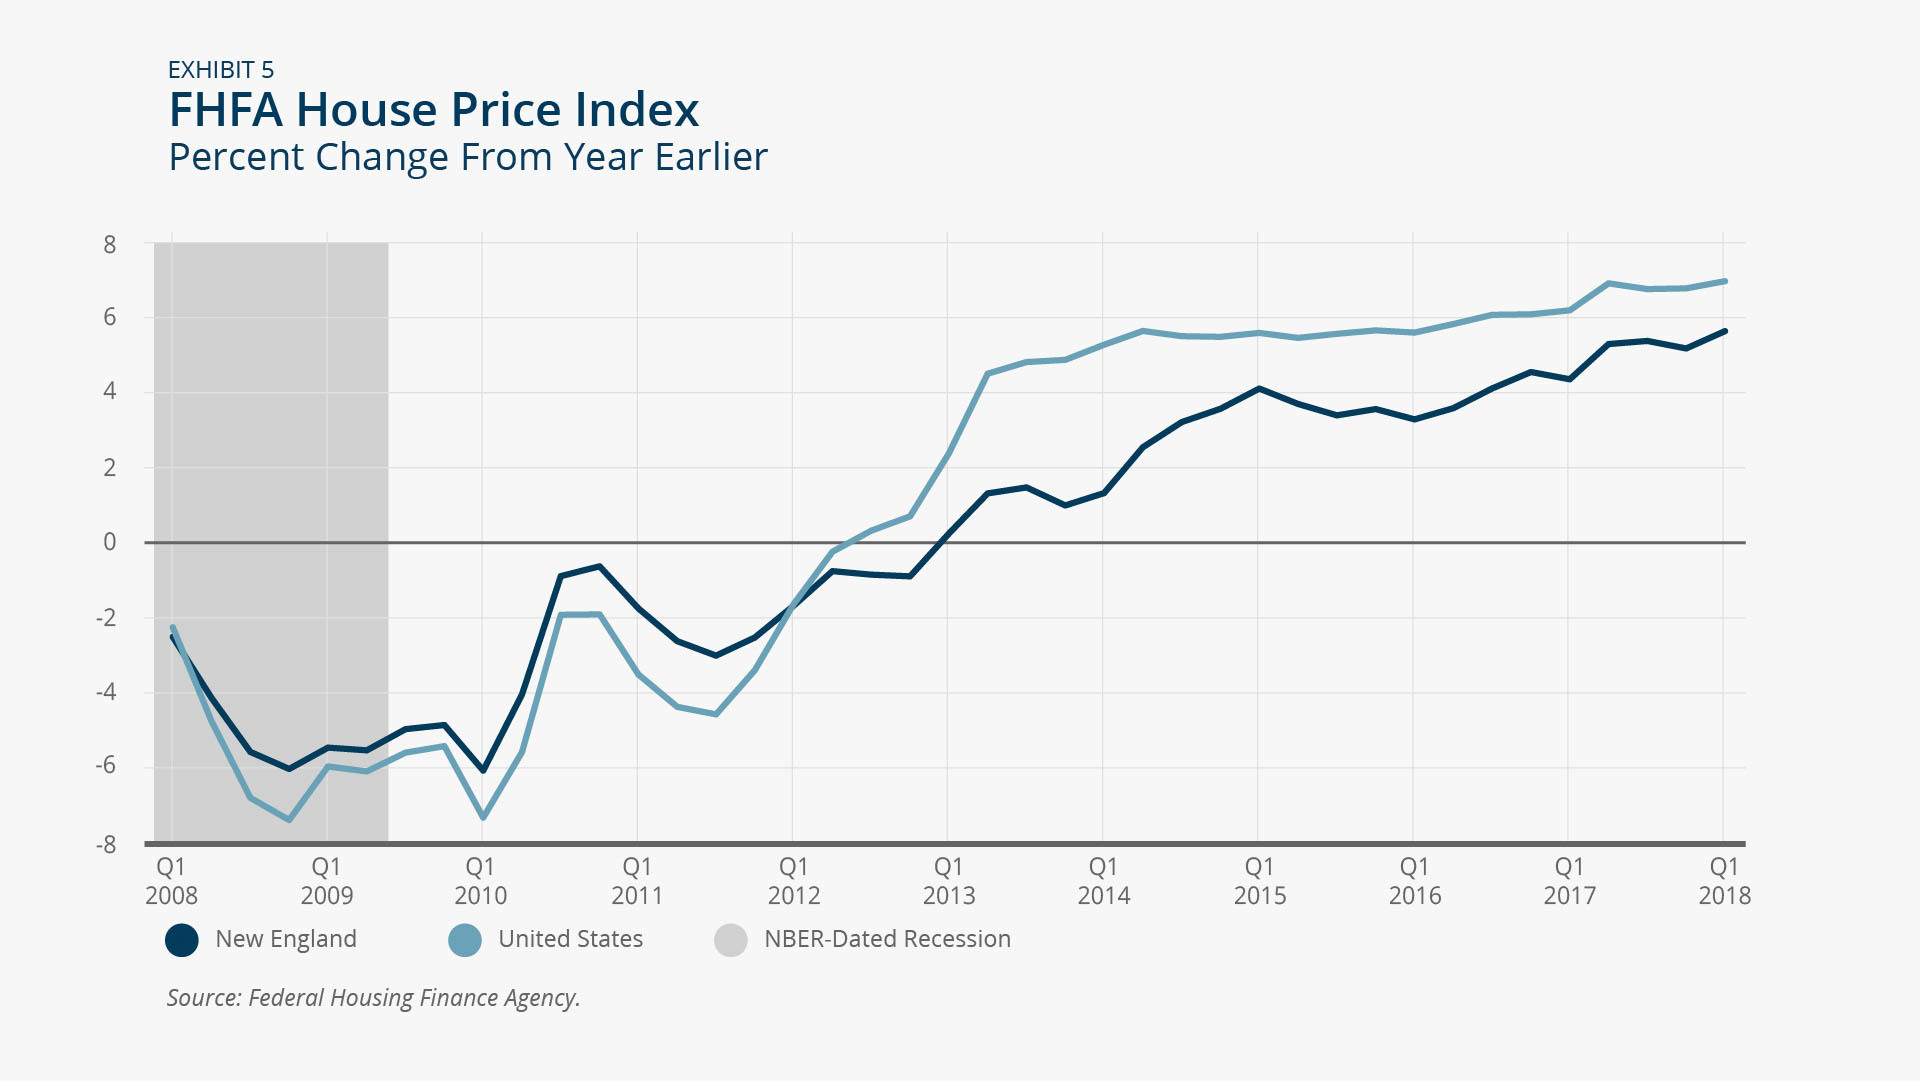
Home prices continued to rise in the nation and region, with national growth rates still exceeding regional rates (Exhibit 5). Between the first quarter of 2017 and the first quarter of 2018, home prices increased 6.6 percent nationally and 5.3 percent regionally. All six New England states reported positive house price growth year-overyear (Exhibit 6), but Rhode Island (8.3 percent), New Hampshire (6.9 percent), and Massachusetts (6.6 percent) all exceeded or equaled the national growth rate. House price growth in Connecticut, 3.3 percent, was the lowest in the region over the period considered.
Federal Reserve Bank of Boston
Federal Reserve Bank of Boston

 About the Authors
Riley Sullivan,
Federal Reserve Bank of Boston
Riley Sullivan is a senior policy analyst with the New England Public Policy Center. His research interests include income inequality and urban and regional economics. Sullivan is also the editor of New England Economic Indicators, a Federal Reserve Bank of Boston regional data resource. He earned his master’s degree in public policy from Georgetown University and his BA in history from Boston College.
Email: riley.sullivan@bos.frb.org
Resources
Site Topics
Related Content
Q2 2021: Snapshot of the New England Economy through June 28, 2021
Q2 2020: Snapshot of the New England Economy through June 22, 2020
Q2 2022: Snapshot of the New England Economy through June 27, 2022
Q2 2017: Snapshot of the New England Economy through June 19, 2017