The COVID-19 Pandemic’s Impact on Public Transportation Ridership and Revenues across New England 


| Key Facts | |
| In New England, 12 of the 38 transit systems rely on directly generated revenue to cover at least one-quarter of their operating expenses. | |
| All but one of those 12 systems saw their ridership decline by more than one-half during the first year of the pandemic. | |
| Local bus ridership has seen the smallest decline among the modes of public transit. | |
| The combined appropriations from the three federal stimulus packages fully replaced transit systems’ lost revenues. | |
 |
|
In New England and elsewhere, public transportation was among the many sectors immediately impacted by the COVID-19 pandemic. Essential workers and members of the labor force with no teleworking options and no alternate means of transportation continued to rely on public transit following the onset of the pandemic. However, with business closures, event cancellations, and social distancing regulations in effect, ridership dropped sharply, hampering transit systems’ ability to generate revenue. As of June 2021, ridership remained depressed despite the relaxation of restrictions and a general resumption of economic activity, though it is anticipated to grow slowly as workers return to offices in larger numbers. Systems with a greater reliance on fares for revenue saw large budget gaps emerge, and many responded by reducing services. In Massachusetts, MBTA service cuts garnered substantial news coverage, but the ridership declines and their implications extend beyond the large transit systems. This brief explores the trends in ridership and financing of all public transit systems in New England. The continued financial health of public transit systems has been on policy agendas, as evidenced by the substantial sums appropriated in the three COVID-19–related federal stimulus packages and the pending bipartisan infrastructure bill.
The appropriations in the three stimulus packages were sufficiently large to fully offset the immediate revenue losses, and—when combined with the funding in the infrastructure bill—they could enable transit systems to make changes that might be necessary to maintain long-term financial viability and entice riders to return to public transit in a post–COVID-19 world.
This brief examines information on how each transit agency in New England was funded before the pandemic. It uses long-term trends in ridership, the impact of the pandemic on ridership, and the share of operating expenses covered by revenue generated through ridership to identify areas that may require significant reforms, potentially including funding changes or service modifications, in order to maintain financial viability after the stimulus funds have been exhausted.
Sign up for new research and data on the New England economy.
How Ridership Has Changed during the Pandemic
Public transit ridership dropped sharply in March and April of 2020, and though it has risen recently across all modes, it has remained down throughout New England and the nation. Figure 1 illustrates the year-over-year decline in the number of passenger trips1 across the four main public transit modes through June 2021: local rail (which in New England is only the Massachusetts Bay Transportation Authority’s [MBTA] T subway system), local bus, commuter bus/rail, and demand response. Throughout most of the pandemic, commuter bus and rail trips in the region were down slightly less than the national average, but that trend reversed in the spring of 2021.

Federal Reserve Bank of Boston
While the number of passenger trips remained low for all modes of public transit relative to pre-pandemic levels, local bus and demand-response services regionally and nationally were operating closest to their pre-pandemic passenger-trip levels in June 2021. This higher level of ridership for local bus and demand-response services (though still around 40 percent lower than the pre-pandemic levels) is consistent with findings from other recent studies and is likely due to the riders who use those services having fewer options compared with other commuters.
Several recent studies focusing on specific metropolitan areas find that ridership declined more in zones with a greater amount of commercial land; declined more in zones with a higher percentage of white, educated, or high-income individuals; and declined less in zones with a greater number of essential jobs. Studies that observe patterns throughout the day find that the declines in ridership were largest during rush hours.2
Table 1 describes the decline in ridership across the full reporter (see box below) transit agencies in New England over the first 16 months of the pandemic.3Among the New England agencies, the MBTA lost the greatest number of passenger trips in the first year of the pandemic, about 340 million. In the first four months of the pandemic, the MBTA saw a 73 percent decline in ridership relative to March 2019 through June 2019. More recently, from March 2021 through June 2021, the MBTA saw a slightly more moderate, 64 percent decline in ridership relative to March 2019 through June 2019. Twelve other agencies in the region saw their ridership fall more than 50 percent in that most recent period.
Characteristics of New England Transit Systems
While the Massachusetts Bay Transportation Authority (MBTA) is the largest transit system in New England, 37 other “full reporter” agencies are located across the six states. The Federal Transit Administration (FTA) requires these 38 agencies to report ridership on a monthly basis. This brief uses these agencies’ ridership data as its sample. The region’s 55 other, smaller agencies are classified as either “reduced reporters” or “rural reporters.” They report to the FTA on an annual basis, and so their ridership data do not yet show the impact of the pandemic.
Before the pandemic, nearly half of all public transit trips in New England occurred on the MBTA’s T subway system, which is the only subway system in the region. There are 34 local bus systems spread across all six states, including expansive systems such as the Rhode Island Public Transit Authority (RIPTA), which services the entire state. Most agencies, regardless of size, offer demand-response rides. These rides do not follow set routes; they instead do pickups and drop-offs at requested locations. Many of the small agencies whose monthly ridership we are not able to observe operate only demand-response transit and often only for disabled individuals.
Led by the MBTA, 12 agencies across the region each averaged more than 2.5 million passenger trips annually before the pandemic. These systems are vitally important to their riders and their local economies. In Vermont, for example, 60 percent of passengers on any given bus ride have no other way to make that trip, which highlights the necessity of affordable and reliable public transit for Vermonters.
Table 1: Ridership by New England Full Reporter Transit Agencies
Number of passenger trips in thousands, March 2020–June 2021
| Agency | Change in Number of Passenger Trips (in Thousands) | Percentage Decline March 2020–June 2020 Relative to March 2019–June 2019 | Percentage Decline July 2020–February 2021 Relative to July 2019– February 2020 | Percentage Decline March 2021–June 2021 Relative to March 2019–June 2019 |
| Massachusetts Bay Transportation Authority | -340,584 | -73% | -70% | -64% |
| Rhode Island Public Transit Authority | -12,191 | -56% | -56% | -53% |
| CT Department of Transportation - Hartford | -8,852 | -43% | -41% | -39% |
| Pioneer Valley Transit Authority | -8,289 | -59% | -64% | -56% |
| Greater Bridgeport Transit Authority | -3,711 | -60% | -52% | -46% |
| CT Department of Transportation - New Haven | -3,491 | -33% | -33% | -39% |
| Brockton Area Transit Authority | -2,146 | -67% | -56% | -55% |
| Green Mountain Transit Authority | -1,911 | -56% | -52% | -42% |
| Greater Portland Transit District | -1,677 | -65% | -57% | -58% |
| Southeastern Regional Transit Authority | -1,592 | -56% | -42% | -30% |
| Woods Hole, MV and Nantucket Steamship Authority | -1,542 | -61% | -26% | -10% |
| Merrimack Valley Regional Transit Authority | -1,532 | -67% | -55% | -43% |
| Worcester Regional Transit Authority | -1,457 | -54% | -32% | -20% |
| CT Department of Transportation - Stamford | -1,253 | -42% | -30% | -31% |
| Lowell Regional Transit Authority | -1,156 | -67% | -61% | -56% |
| CT Department of Transportation- Waterbury- NET | -1,032 | -38% | -34% | -34% |
| Cape Cod Regional Transit Authority | -935 | -63% | -57% | -41% |
| Cape Cod Regional Transit Authority | -935 | -63% | -57% | -41% |
| Norwalk Transit District | -849 | -50% | -41% | -41% |
| Montachusett Regional Transit Authority | -789 | -53% | -55% | -47% |
| Casco Bay Island Transit District | -764 | -68% | -44% | -65% |
| Greater Attleboro-Taunton Regional Transit Authority | -753 | -63% | -56% | -53% |
| MetroWest Regional Transit Authority | -734 | -71% | -68% | -67% |
| Northern New England Passenger Rail Authority | -632 | -90% | -87% | -65% |
| Southeast Area Transit District | -492 | -45% | -35% | -32% |
| CT Department of Transportation - New Britain | -450 | -61% | -49% | -40% |
| Housatonic Area Regional Transit | -400 | -51% | -44% | -38% |
| City of Nashua | -339 | -74% | -54% | -41% |
| Greater Hartford Transit District | -335 | -64% | -46% | -34% |
| Cooperative Alliance for Seacoast Transportation | -295 | -68% | -49% | -41% |
| Berkshire Regional Transit Authority | -293 | -50% | -40% | -31% |
| CT Department of Transportation New Britain -Dattco. | -265 | -54% | -50% | -57% |
| Milford Transit District | -196 | -44% | -48% | -47% |
| Western Maine Transportation Services, Inc. | -185 | -72% | -57% | -63% |
| Cape Ann Transportation Authority | -126 | -59% | -39% | -25% |
| Greater New Haven Transit District | -120 | -53% | -37% | -25% |
| Rhode Island Department of Transportation | -41 | -95% | -61% | N/A |
| Valley Transit District | -25 | -57% | -35% | -27% |
| Source(s): US Department of Transportation, Federal Transit Administration, National Transit Database, Monthly Adjusted Module Data Release, June 2021. Note(s): Full reporter agencies operate the larger transit systems and are required to submit monthly ridership data to the Federal Transit Administration; smaller agencies, which are classified as reduced reporters or rural reporters, submit data on an annual basis. |
||||
The MBTA Compared with Other Large Systems
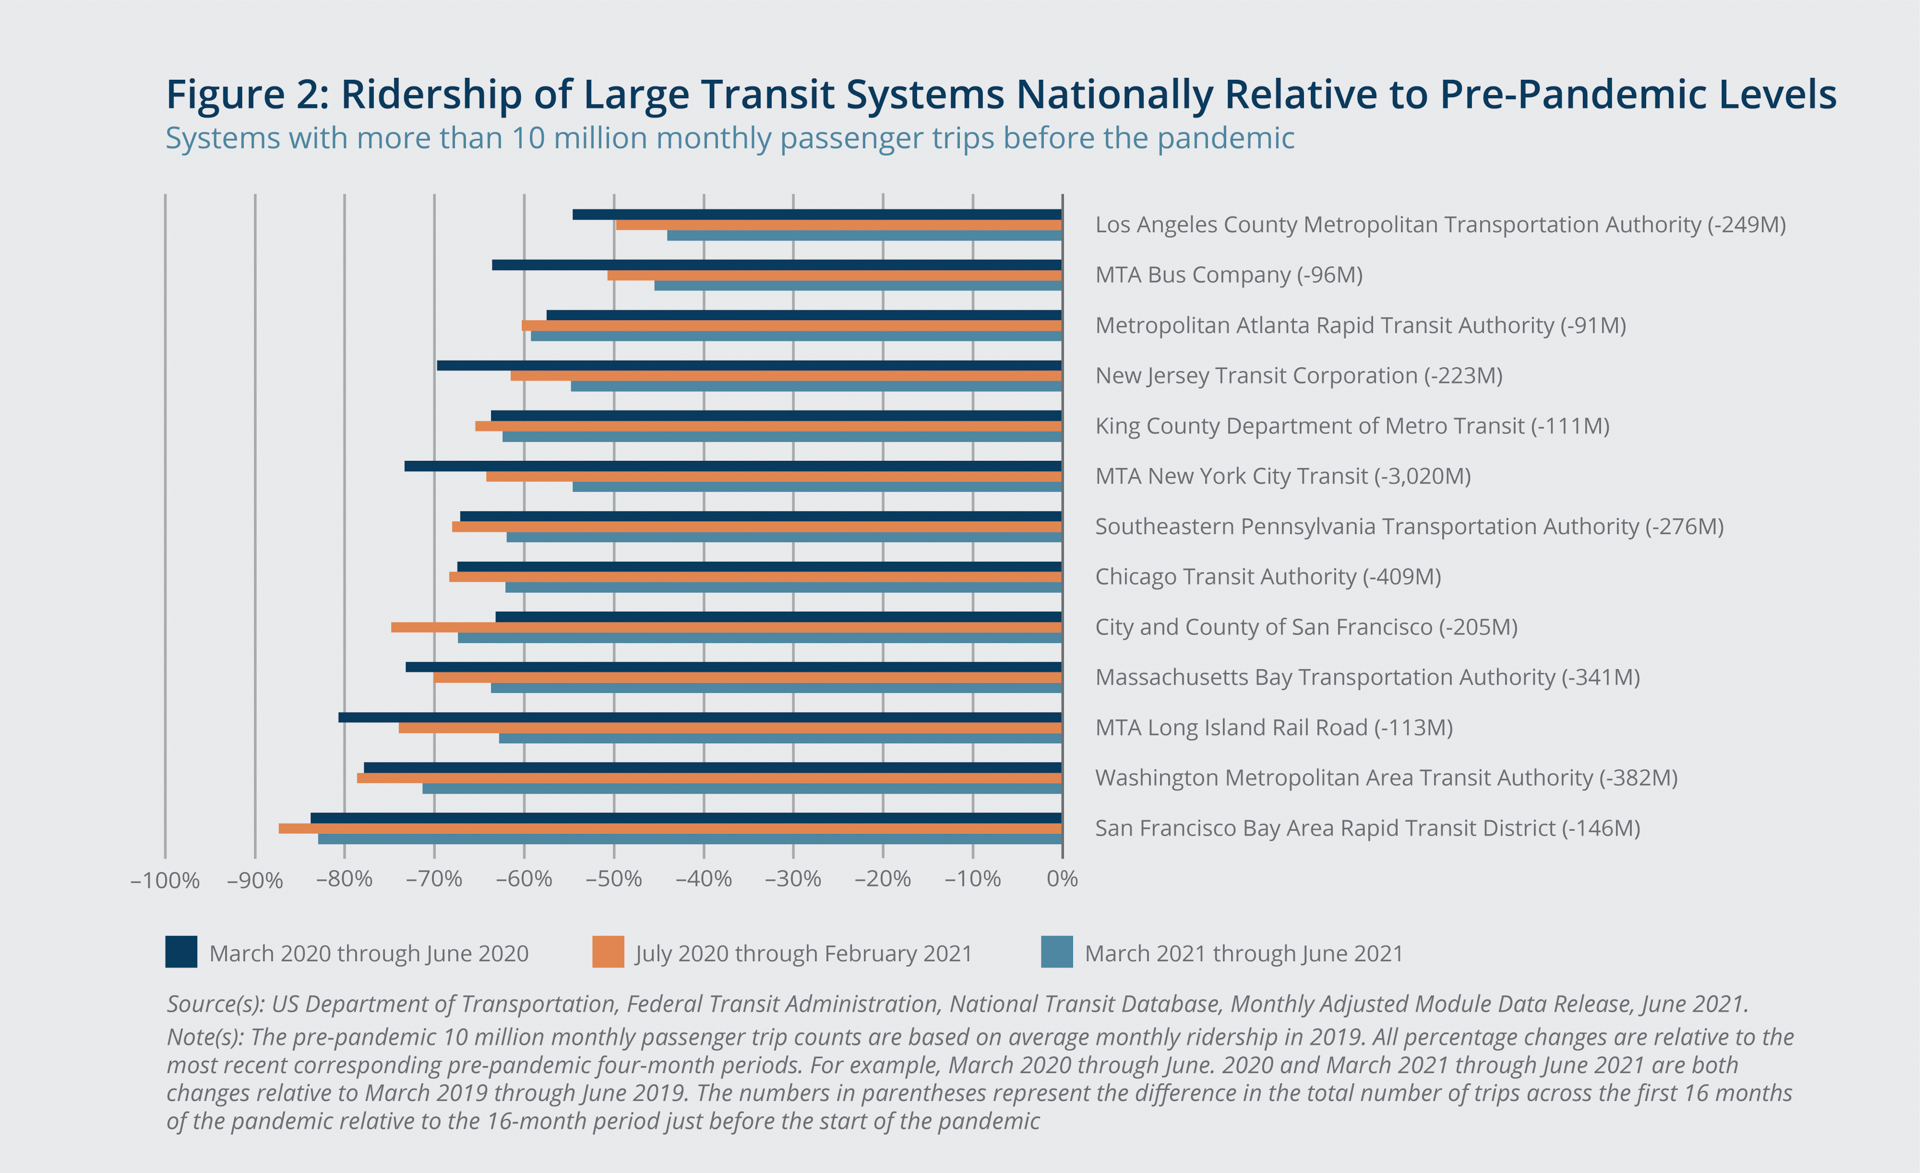
MBTA ridership is not comparable to those of other systems across New England due to its size and the outsized reliance that urban residents and suburban commuters working in Boston have on the system. Figure 2 uses the same time blocks at Table 1 to illustrate the changes in ridership for the transit agencies across the country that had averaged more than 10 million monthly passenger trips before the pandemic. Though the agencies are comparable in size, many extenuating factors make it difficult to directly compare them. The system with the largest decline, the San Francisco Bay Area Rapid Transit District, known as BART, is a commuter rail into and out of the city. Its large loss of riders comports with the national trend of commuter rail services seeing the steepest drop in ridership. The moderate though still substantial ridership declines for the Los Angeles and New York City bus systems align with the national trend for local bus systems. The numbers next to the agency names represent the difference in total number of trips across the first 16 months of the pandemic relative to the 16-month period just before the start of the pandemic.
Federal Reserve Bank of Boston
Given the MBTA’s mix of transit modes, the agency’s early ridership decline of 73 percent is comparable to the ridership declines of many other large systems that include local rail, local bus, commuter rail, and demand-response services. Faced with pandemic-related ridership declines and the resulting revenue losses, many of these large systems had made or were on the verge of making substantial cuts to their services to maintain financial solvency. These systems, on average, receive a greater portion of their revenue from fares compared with smaller systems. Of these large systems, BART is the most reliant on this directly generated revenue; it covered 69 percent of the agency’s operating expenses in 2019. The MBTA covered about 47 percent of its operating expenses in 2019 with revenue collected directly from passengers, largely in the form of fares and parking fees at stations.
Pre-pandemic System Finances
Every public transit system in New England uses directly generated revenues (from passenger fares, parking lot fees, and selling advertising space primarily) to help fund operating expenses. The other sources of revenue include local appropriations, state appropriations, federal appropriations, and taxes directly assessed on residents to support the systems. In New England, only Rhode Island uses direct taxes; in other parts of the country, they are a more common feature in funding formulas.
The systems that are more reliant on directly generated funds are subject to large shocks when ridership declines the way it did during the pandemic. Four of the 38 full reporter systems in New England relied on directly generated revenue to cover at least half of their operating expenses in 2019. Eleven of the systems that saw their ridership decline by more than one-half during the first year of the pandemic relied on fares and other directly generated sources of revenue to fund at least one-quarter of their expenses in 2019.
The smaller public transit systems in New England are, on average, less reliant than the larger systems on directly generated revenue to cover operating expenses, but there are a few notable exceptions. These include the small systems in New Hampshire, which, on average, fund 75 percent of their operating expenses with directly generated revenue. The smaller systems in the other New England states generally are more reliant on local, state, and federal appropriations.
Figure 3 combines the decline in ridership during the first 16 months of the pandemic (March 2020 through June 2021) and the share of expenses covered by directly generated revenue in 2019 for each of the public transit agencies in each New England state. While we cannot yet observe the state of finances for these systems during the pandemic, the systems located closest to the upper-right corner of the plot likely would have faced the largest gaps in their budgets if they had not reduced their services (the overall number of trips made by the agency’s mode or various modes of transport) and received additional government funding to help close those gaps. The systems that are least reliant on directly generated revenue may still be concerned about total revenues if state and local funding is jeopardized because other, competing policy priorities require additional funding.
Federal Reserve Bank of Boston
Federal Stimulus and Appropriations
The most substantial policy responses to the pandemic’s effect on public transit systems were included in three federal stimulus packages: the Coronavirus Aid, Relief, and Economic Security (CARES) Act; the Coronavirus Response and Relief Supplemental Appropriations Act of 2021 (CRRSAA); and the American Rescue Plan (ARP). The CARES Act, enacted in March 2020, allocated $25 billion for public transportation. For many transit agencies, this funding bridged their budget gap for months as they faced increased costs associated with enhanced cleanings and the purchase of personal protective equipment and lost revenue from declines in fares and other directly generated revenue streams. The CRRSAA was passed in December 2020 and allocated $14 billion for additional assistance to transit agencies, which continued to face looming service cuts to maintain solvency. Table 2 shows, by New England urbanized areas (UZAs),4 how these two packages helped to offset the revenue losses from the first 16 months of the pandemic.
For many agencies in New England, the CARES and CRRSAA funding negated the immediate need to reduce services. However, longer-term concerns remain, because it will likely be years before the agencies see their ridership return to pre-pandemic levels. The ARP, passed in March 2021, included $30.5 billion for public transportation. With this additional funding, agencies have a greater buffer to adjust to long-term changes in ridership, allowing them to avoid making immediate service reductions. Taken together, the three stimulus plans appropriate one to two years’ worth of operating funding to public transit agencies in New England and across the country; federal funding in 2019 covered just 5.4 percent of operating expenses across the region’s systems. Agencies are allowed to spend these appropriations on operating expenses, but a fourth piece of legislation, the pending bipartisan infrastructure plan, would allocate $39.2 billion to public transit to be used on improvements and expansions of systems.
Table 2: Estimated Lost Revenue and Stimulus Appropriations
By New England urbanized areas (UZAs), in thousands of dollars
| Estimated Share of Annual Total Revenue Lost from Directly Generated Sources, March 2020–June 2021 |
||||
| Less than 7% | 7% to 12% | Greater than 12% | ||
Increase in Average Cost Per Trip, 2010 vs. 2019 |
Less than 25% | N/A |
|
|
| 25 to 50% |
|
|
|
|
| Greater than 50% |
|
|
|
|
Looking Ahead
The COVID-19 pandemic could have resulted in deep cuts to public transit services in New England that would have disproportionately harmed people who are most reliant on those services. State and local governments are assisting by providing subsidies and considering proposals for fare-free routes, while local, state, and federal policymakers, by prioritizing public transit funding, have created an opportunity for systems to position themselves for long-term financial stability.
For many public transit agencies in the region, the pandemic only exacerbated pre-existing, long-term challenges to their financial stability. In some cases, cost increases outpaced ridership growth, causing an agency’s average cost per trip to rise substantially over the last decade. Table 3 identifies agencies that experienced the largest increases in their average cost per trip from 2010 to 2019 and those that saw the estimated greatest losses in revenue from decreased ridership during the first 16 months of the pandemic. No agency falls into both the lowest cost-growth category and the smallest losses in directly generated revenue category (top-left corner of the table). The agencies grouped in the table’s bottom-right corner saw the greatest cost growth per ride and sustained the largest losses in revenue during the first 16 months of the pandemic.
The pandemic could result in long-term shifts that disrupt transit systems. These could include changes in commuting behavior and a decreased willingness to ride on crowded trains and buses, among others. The full extent of such changes is unknown at this point, and certainly predicting those changes and their consequences is not the goal of this brief. However, we can note that some transit systems may be better positioned to respond to changes, while others may struggle. Systems that have experienced a substantial increase in their cost per ride and also have seen large revenue losses from a pandemic-related ridership decline—those listed in the bottom-right corner of Table 3—may be the most at risk and in need of making substantial adjustments to remain viable in the long term. The three rounds of federal stimulus funding created a substantial runway for agencies to make changes that could lead to long-term financial stability while temporarily absorbing losses and avoiding immediate reductions in services.
Experts engaged in policy debates have highlighted the risks of holding on to stimulus funds in anticipation of low ridership, claiming a lack of investment in higher-quality service could result in a self-fulling prophecy of low ridership.5 Proponents of holding on to the funds for potential future gaps in operating budgets and cutting services while ridership is low point to the increased average cost per trip if a route is servicing only a small fraction of riders while maintaining pre-pandemic frequency. Those in favor of using the funds more immediately argue that reducing services could bolster the perception that services are unreliable or inconvenient. They also note that service cuts during the peak of the pandemic disproportionately impacted essential workers who did not have access to alternate means of transportation.
Examples of areas beyond improving reliability and speed where investments could be made include higher-quality data collection around metrics such as wait times that capture rider experience, more hands-off ticketing options, and programs like the one the MBTA launched along some corridors that offer temporary transit credits to attract returning riders.6 Increasing trip frequency or adding additional vehicles may decrease density on rides. While increasing costs, such a change also could result in rise in ridership by addressing passenger concerns with being too close to each other as the pandemic lingers. The New York City subway system was among the systems that saw an uptick in crime during the pandemic. It responded by hiring additional security to allay concerns around public safety and lure riders back. Specific plans and incentives are still largely being formed and debated as the pandemic evolves. In August, the MBTA extended its Commuter Rail Flex Pass offering discounted bundles of tickets through March 2022.
Use of the large infusion of federal money now extends beyond filling the funding gap that resulted from losses to directly generated revenue. Agencies can use the money to make upgrades that may draw passengers back to public transit more quickly than they otherwise would return. Components of proposed federal infrastructure legislation could further these initiatives, including the bipartisan infrastructure bill, which, as noted above, allocates $39.2 billion to transit agencies explicitly for maintenance and expansion projects rather than for bridging gaps in operating expenses.
Data Sources
All the data come from the Federal Transit Administration’s (FTA) National Transit Database (NTD). The NTD records the financial, operating, and asset conditions of transit systems, helping to keep track of the industry and provide public information and statistics. The NTD is designed to support local, state, and regional planning efforts and help governments and other decision-makers make multiyear comparisons and perform trend analyses. It contains a wealth of information, such as agency funding sources, inventories of vehicles and maintenance facilities, safety event reports, measures of transit service provided and consumed, and data on transit employees.
Monthly trip data are released with a lag of about one month for all large and medium-sized transit agencies; smaller agencies report annually. Financial data cover all transit agencies, including the smallest agencies. Finances for 2020 will not be available until November 2021.
Endnotes
- In this brief, the term “passenger trips” refers to unlinked passenger trips, which reflect the number of times passengers board public transportation vehicles. Passengers are counted each time they board vehicles no matter how many vehicles they use to travel from their origin to their destination and regardless of whether they pay a fare, use a pass or transfer, ride for free, or pay in some other way.
- See, for example, Songhua Hu and Peng Chen, 2021, "Who Left Riding Transit? Examining Socioeconomic Disparities in the Impact of COVID-19 on Ridership,"Transportation Research Part D: Transport and Environment, 90, 102654, https://doi.org/10.1016/j.trd.2020.102654; and Luyu Liu, Harvey J. Miller, and Jonathan Scheff, 2020, “The Impacts of COVID-19 Pandemic on Public Transit Demand in the United States,” PLoS ONE, 15(11), e0242476, https://doi.org/10.1371/journal.pone.0242476.
- The table compares ridership during the March 2020–June 2021 period with ridership during the March 2019–February 2020 period; the March 2021–June 2021/March 2019–June 2019 comparisons are made to show changes from pre-pandemic levels while accounting for seasonal differences.
- A UZA is a Census-designated urban area with 50,000 residents or more.
- See Tanya Snyder, “Policy Hackathon: Can Public Transit Recover from Covid-19?” Politico, May 27, 2021, https://www.politico.com/news/2021/05/27/covid-public-transit-hackathon-489983.
- See David Zipper, “4 Ways Transit Can Lure Back Post-Covid Commuters,” Bloomberg CityLab, June 16, 2021, https://www.bloomberg.com/news/articles/2021-06-16/transit-needs-to-compete-for-post-covid-commuters.

 About the Authors
Riley Sullivan,
Federal Reserve Bank of Boston
Riley Sullivan is a senior policy analyst with the New England Public Policy Center. His research interests include income inequality and urban and regional economics. Sullivan is also the editor of New England Economic Indicators, a Federal Reserve Bank of Boston regional data resource. He earned his master’s degree in public policy from Georgetown University and his BA in history from Boston College.
Email: riley.sullivan@bos.frb.org
Resources
Site Topics
Keywords
- New England ,
- NEPPC ,
- COVID-19 ,
- Coronavirus ,
- public transit
Related Content
New England Study Group Past Meetings
Evictions in New England and the Impact of Public Policy during the COVID-19 Pandemic
Early Evidence from Massachusetts and Connecticut Suggests Nutritional Assistance Use Is Dramatically Increasing in New England During the Covid-19 Pandemic
Financial Strain and Material Hardship in the New England States During the COVID-19 Pandemic