The Distribution of Sectoral Price Changes and Recent Inflation Developments 


Inflation has declined across many sectors so far in 2023, but the distribution of sectoral price changes still shows atypical features, such as bimodality in which substantial masses of sectors record price changes both below and above the Federal Reserve’s 2 percent inflation target. Such bimodality was not typical before the pandemic, suggesting that sector-specific price adjustments are now playing a more important role in inflation developments. The recent slowdown in inflation was partly caused by a larger-than-normal share of the consumption basket being located in the left tail of the distribution. However, current estimates of inflation persistence at the sectoral level are relatively low, and thus the beneficial effect of deflation in a few sectors could prove short-lived. These findings suggest that uncertainty around underlying inflation may now be higher than in the years immediately preceding the pandemic.
Sign up for Research Department Updates.
After elevated readings in 2021 and 2022, consumer price inflation has moderated so far this year. Measured by the change in the total consumer price index (CPI) over 12 months, inflation fell from 6.4 percent in December 2022 to 3.1 percent in June 2023. Core inflation, which excludes volatile food and energy prices, declined by less: from 5.7 percent to 4.9 percent over the same period. Much of the stickiness in core inflation is due to persistently high shelter inflation, which accounts for 43 percent of the core CPI consumption basket. Excluding shelter from the core index, inflation slowed from 4.5 percent to 2.8 percent over the same period.1 Two other gauges that downweight the influence of sectors with more extreme price movements—trimmed-mean CPI and median CPI—declined from 6.6 percent and 7.0 percent, respectively, in December 2022 to 5.0 percent and 6.4 percent in June 2023. The June annualized monthly change in the trimmed-mean CPI was 2.7 percent, but it was 4.4 percent for the median CPI.2
These recent developments show that during periods of high and volatile inflation, measures of underlying inflation, which try to capture more persistent movements in inflation by filtering out short-term and idiosyncratic fluctuations, may diverge from one another and be difficult to interpret. This difficulty is in part due to the heterogeneous adjustments of prices across the different categories of goods and services in the consumption basket. Examining the distribution of sectoral inflation rates can offer additional insight into inflation dynamics during such episodes. This approach can provide information not found in aggregate measures of underlying inflation. Such information is especially useful when assessing the uncertainty associated with these measures.
To illustrate this point, we examine the shape of the inflation distribution across consumption categories in June 2023 and compare it with the distribution prevailing for the same month in 2021 and 2022 and in the years immediately preceding the COVID-19 pandemic. We document that, overall, sectoral price inflation has declined across much of the distribution, but the distribution continues to show some atypical features that began to appear during the inflation run-up in 2021 and 2022. For example, while there have been declines in the extreme tails (the 90th and 10th percentiles), inflation in the sectors that rank in the intermediate percentiles remains elevated. The inflation distribution shows some bimodality in which a large share of sectors experiences low inflation while another large share of sectors continues to show relatively high inflation. Multiple peaks are particularly noticeable in the distribution of core inflation excluding shelter and used vehicles, a measure of inflation that was especially low in the second quarter of 2023 and taken as evidence of a rapid decline in underlying inflation. And while bimodality is more difficult to discern in the core CPI inflation distribution due to the high weight of shelter in the index, multiple peaks are present in the distributions of both total and core personal consumption expenditures (PCE) inflation.
These findings suggest that sectoral adjustments are currently playing an unusually important role in driving inflation dynamics, which is consistent with the easing of supply bottlenecks. However, it remains to be seen how the uncertainty of the supply-side factors plays out. Indeed, the persistence in the inflation ranks of different categories in the consumption basket is estimated to be lower now than it usually is. That is, categories with relatively low inflation today may have a greater likelihood of exhibiting relatively high inflation just a few months from now—a fact that highlights the potential pitfalls of selectively removing individual categories when assessing underlying inflation. On the positive side, the inflation distribution, while still atypical, appears to be moving closer to one that is consistent with what we observed in the years immediately preceding the pandemic.
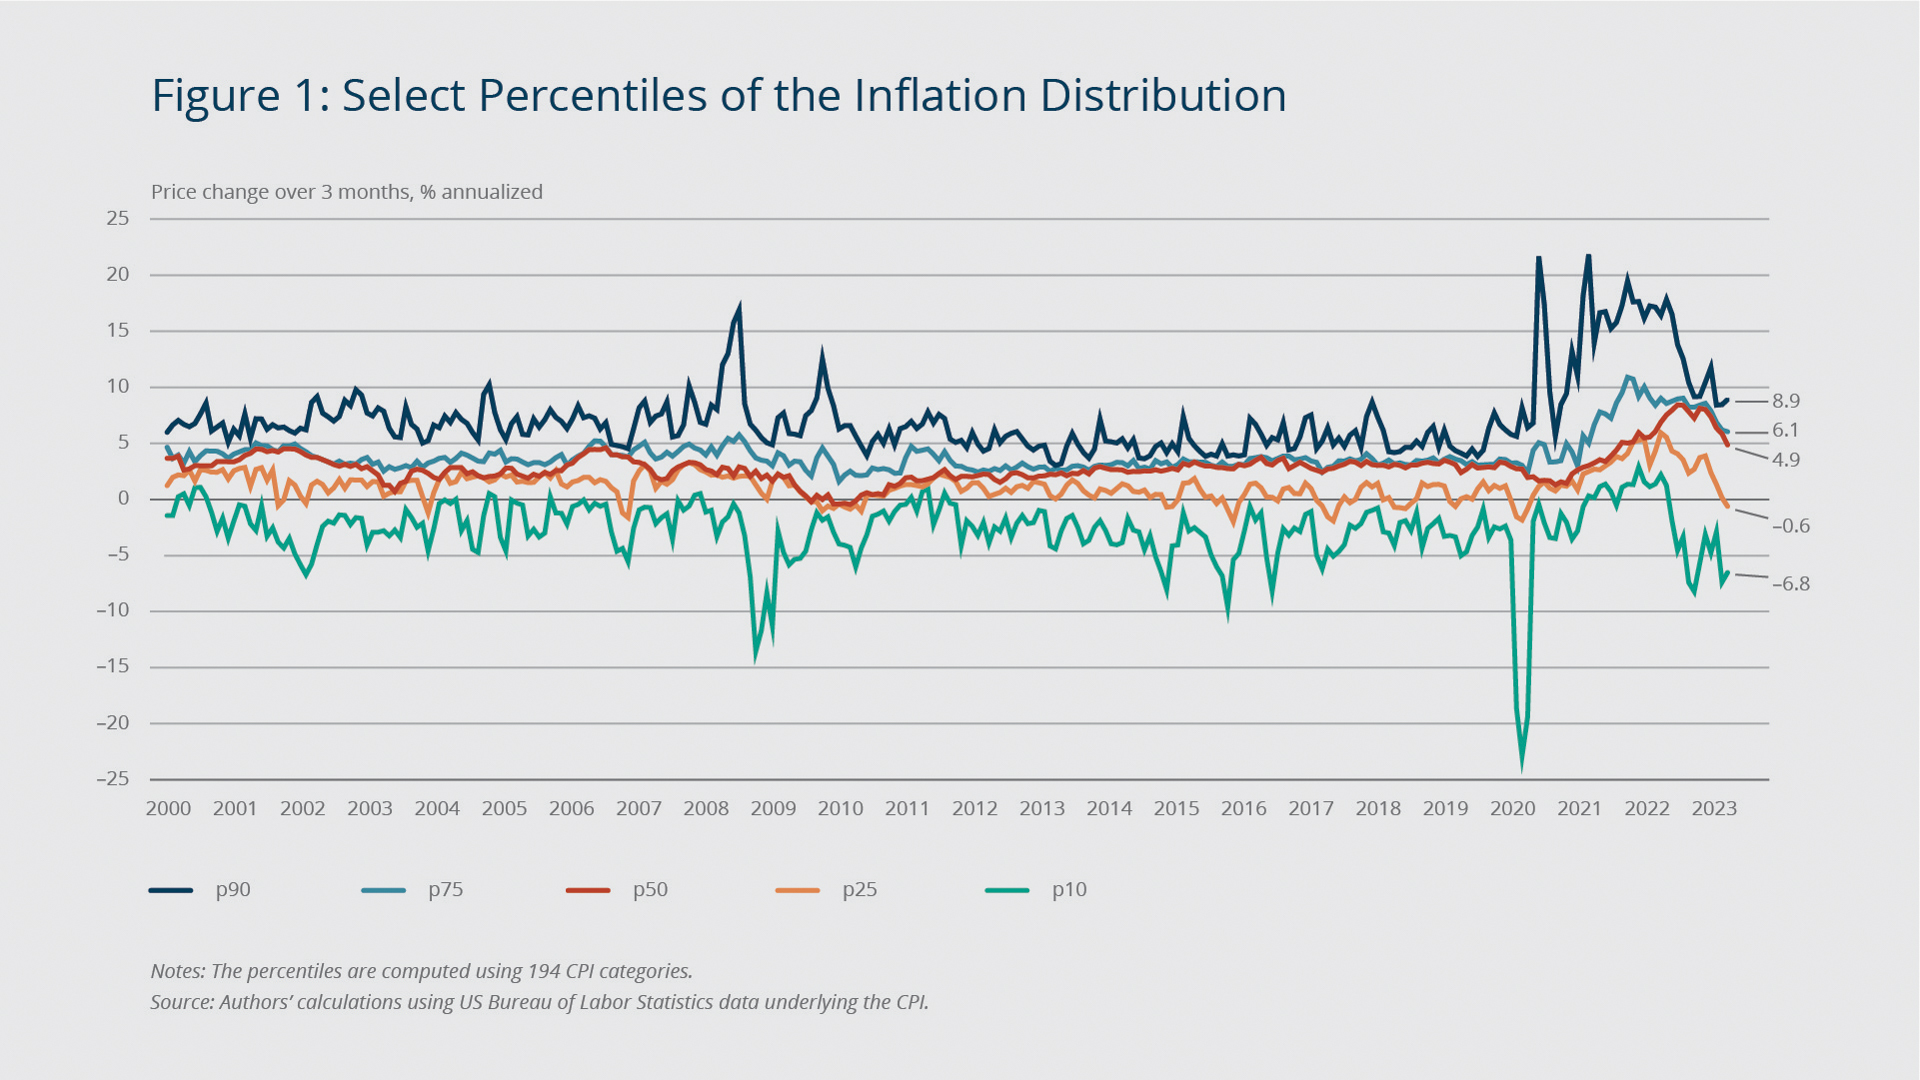
Distribution of Inflation across Consumption Categories Shows Atypical Features
Figure 1 shows select percentiles of the three-month annualized inflation weighted distribution across 194 categories of goods and services that underlie the CPI. While the 90th percentile has fallen significantly, it remains elevated relative to its pre-pandemic average over the period depicted in the chart. By contrast, the 10th percentile is at a level below its pre-pandemic average, suggesting that idiosyncratic shocks in the left tail have helped to bring inflation down. Importantly, the 75th and 50th percentiles remain elevated. Thus, a substantial mass remains concentrated at inflation levels well above the Federal Reserve’s 2 percent target. In other words, the recent moderation of aggregate inflation is driven by fewer sectors with exceptionally large price increases and more sectors with outsized price decreases.

Federal Reserve Bank of Boston
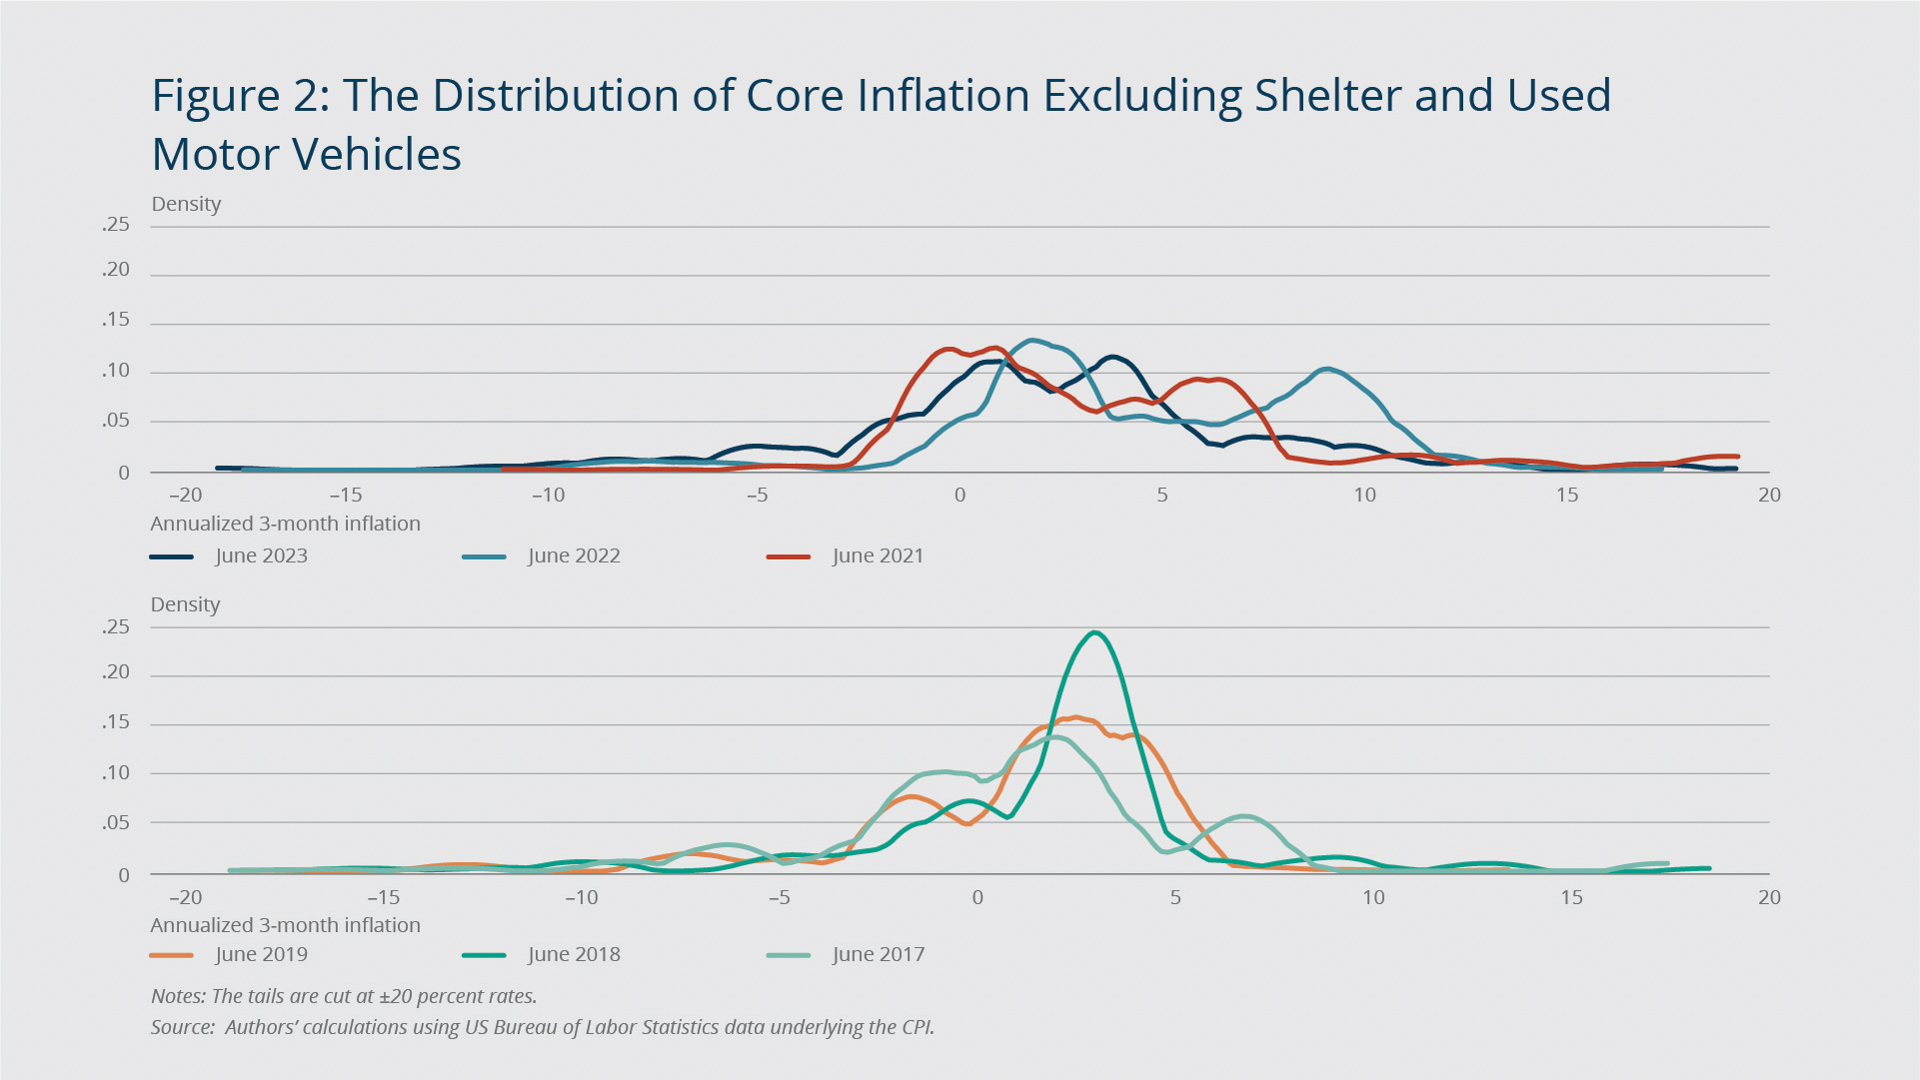
Figure 2 compares the weighted distribution of three-month annualized core inflation excluding shelter and used motor vehicles in June 2023 (the black solid line in the top panel) to that in the same month of previous years. The weights of the different categories of goods and services are set to their expenditure share.
We exclude shelter and used motor vehicles in Figure 2 for a few reasons. As already noted, this inflation gauge was running at pre-pandemic levels by the second quarter of 2023, and it is thus relevant to ask whether the underlying sectoral distribution of price changes similarly reverted to its pre-pandemic features. Measures of shelter inflation also tend to be particularly persistent because rents are typically locked in for a fixed period of time. As a result, shelter inflation does not fully incorporate the slowdown in the growth of new market rents to date. For this reason, the shelter inflation measure tends to provide a more backward-looking signal of developments in the rental-housing market, making its inclusion in gauges of underlying inflation problematic. Moreover, shelter, even at the most disaggregated level available, makes up a large share of consumer expenditures, particularly in the CPI. This feature often leads to a spike in the inflation distribution at the level of shelter inflation, even when there are no other categories with a similar inflation level. We exclude used motor vehicles because their prices have been highly volatile recently, with inflation in this category increasing sharply in the second quarter of 2023 despite an expected trend going forward that is favorable due to supply chain improvements.
Federal Reserve Bank of Boston
The figure shows that the June 2023 distribution of inflation in core goods and services categories excluding shelter and used vehicles peaks at a higher inflation rate and is wider than it was before the pandemic. Moreover, the distribution is not yet concentrated around the 2 percent target but rather appears to have two peaks where inflation in a large mass of categories is still high at about 4 percent. The June distribution, however, is more compressed than the distribution in May 2023 (not shown) and the distribution in June 2022, with the two peaks converging closer to the 2 percent target. In summary, while core CPI inflation excluding shelter and vehicles was at pre-pandemic levels in the second quarter of this year, the shape of the distribution of price changes is still different from the one prevailing before the pandemic.
Figure A.1 in the appendix shows that the distributions of total and core CPI inflation in June 2023 spike at about a 5.5 percent three-month annualized rate, which is precisely the inflation rate for shelter. While the two modes shown in Figure 2 are still visible, their densities decline from about 0.12 to just over 0.05 due to the dominance of shelter.
The distributional properties of PCE inflation, shown in Figure A.2 in the appendix, are qualitatively similar to the CPI distributions. During the 2017-2019 period, when inflation was close to the Federal Reserve’s 2 percent target rate, the PCE inflation distributions were single-peaked for both total and core measures as well as for core PCE inflation excluding shelter and used motor vehicles. But the distributions widened, and multiple peaks emerged during the inflation run-up in 2021 and 2022. By mid-2023, the distributions had narrowed but retained their multi-peaked shapes. Here, it is important to note that the shelter weight in the PCE is lower than in the CPI, dampening its effects on the distributional shape.
Overall, these findings suggest an important role for sector-specific price adjustments in driving recent inflation dynamics—a role that was less pronounced in the years immediately preceding the pandemic. The still-large dispersion in the distribution of price changes and evidence of bimodality also can limit the informational content of central-tendency measures of inflation, such as the median or the trimmed mean.
The Persistence of Inflation Ranks Has Been Relatively Low
Digging deeper into the distribution of disaggregated inflation reveals that in June 2023, inflation was higher among services (for example, restaurants, motor vehicle repair and maintenance, and hospital and related services) and some goods (for example, medical-care commodities). On the other hand, inflation was lowest among core goods and durables. It is natural to ask whether these trends are likely to persist.
Federal Reserve Bank of Boston
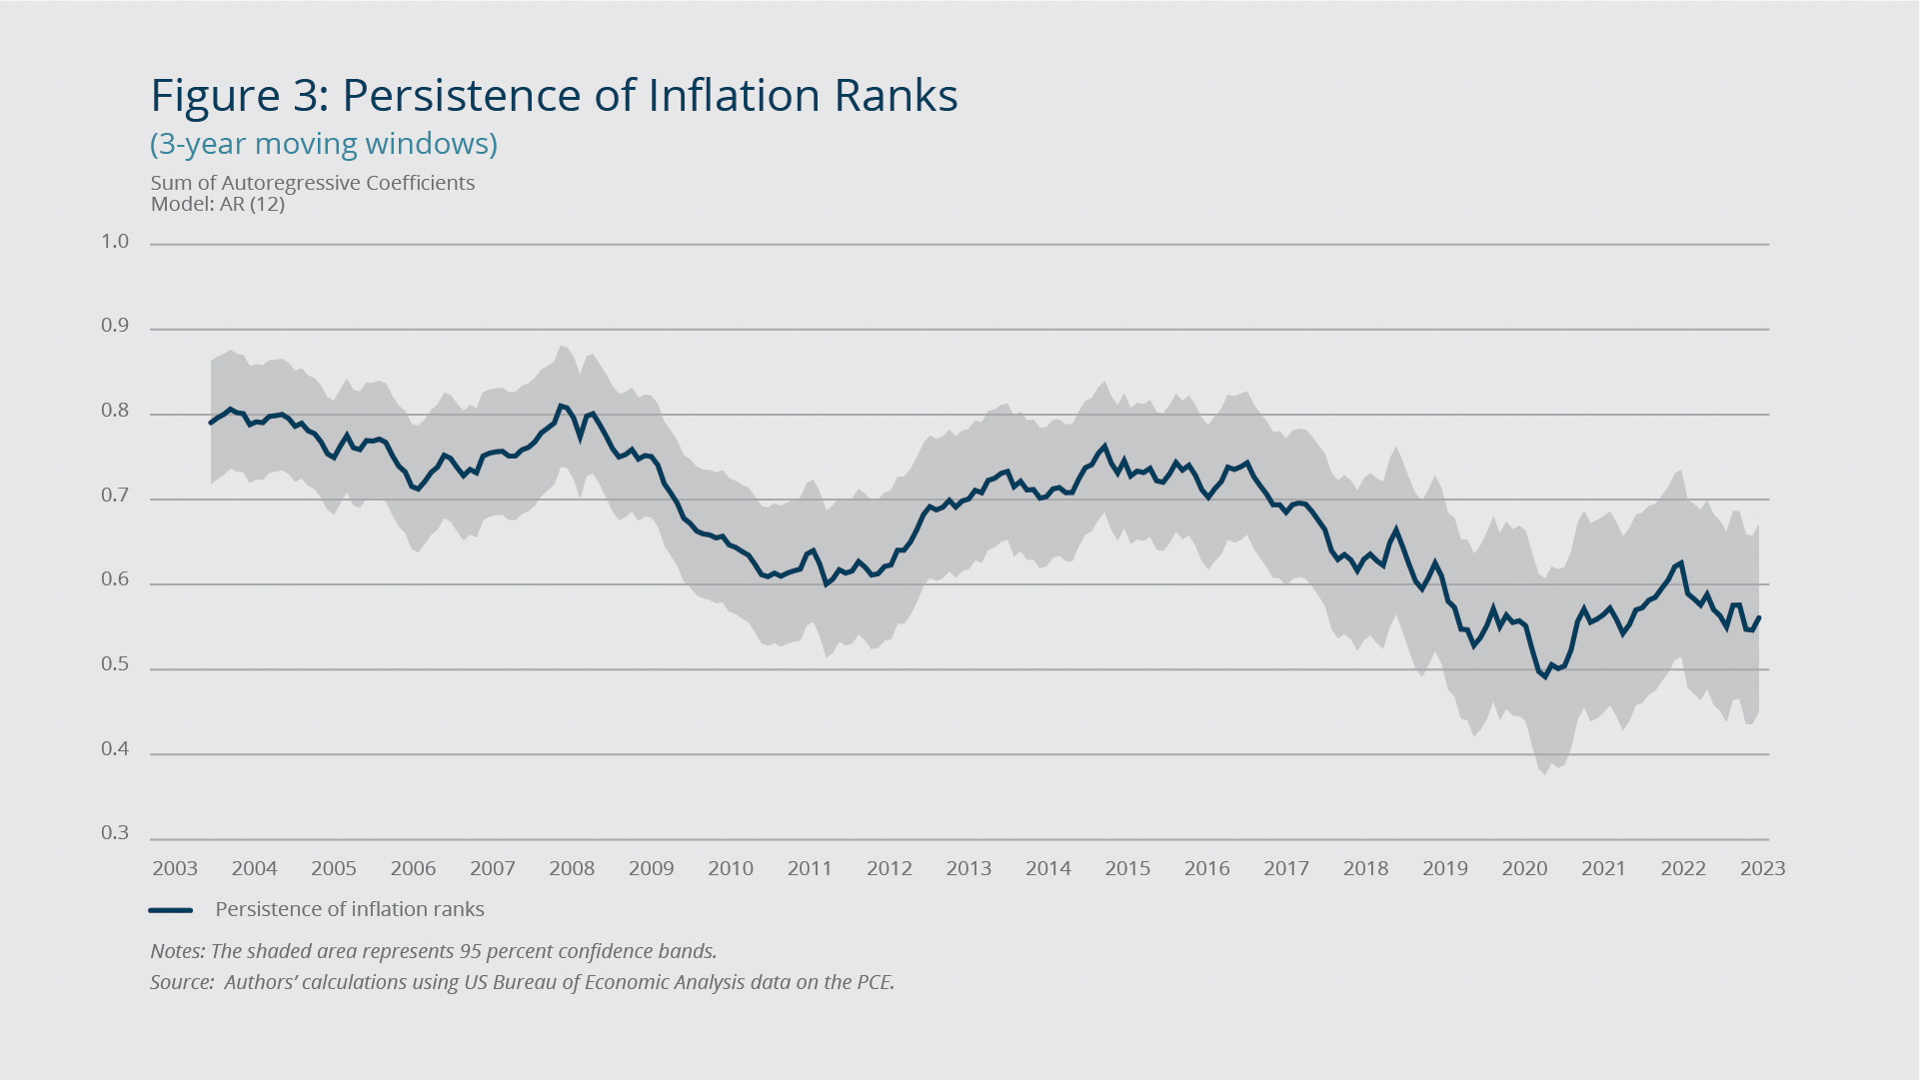
Figure 3 shows estimates of the persistence of inflation ranks. They are lower than the pre-pandemic average over the period depicted, suggesting caution against selectively focusing on inflation categories that have shown surprisingly low inflation or selectively ignoring categories that have shown surprisingly high inflation.3 Higher rank-switching implies that categories with relatively high or low inflation tend to move to a different part of the inflation distribution more quickly, which reinforces the need to watch the distributional patterns going forward.
Despite the rank-switching in the overall distribution, some consumption categories have had persistently high or low inflation since the summer of 2019.4 Unsurprisingly, shelter and three related categories are among the 12 core categories with the most persistent inflation ranks. Most of the remaining categories are services associated with relatively low-skill workers.5
Implications for the Inflation Outlook
The inflation outlook has been uncertain, but the recent decline in some popular measures of underlying inflation instills optimism that inflation is on its way down to the Federal Reserve’s 2 percent target. The analysis of the sectoral inflation distribution presented in this brief broadly supports this optimistic view but at the same time cautions against taking all of the recent improvement as a persistent development.
On the positive side, the inflation distribution has become less dispersed, and its central tendency moved lower relative to the 2022 benchmark. However, the distribution remains somewhat bimodal, which was not typical during periods of low inflation before the pandemic. And some of the decline in inflation has been helped by unusually large deflation in a small number of consumption categories, which—based on evidence from inflation-rank persistence—may not be sustained. While it is too early to draw a definite conclusion based on a few monthly observations, monitoring the distributional properties of sectoral inflation going forward may prove useful for assessing the uncertainty around measures of underlying inflation.
The views expressed herein are those of the authors and do not indicate concurrence by the Federal Reserve Bank of Boston, the principals of the Board of Governors, or the Federal Reserve System.
Endnotes
- Another component that surprised on the upside in 2023 was used vehicles, due to persistent supply chain issues in the production of new vehicles. Core inflation excluding shelter and used vehicles declined from 5.7 percent to 3.6 percent.
- The Federal Reserve Bank of Cleveland provides estimates for both of these measures. Median inflation measures the price change in the category that ranks at the 50th percentile of the distribution of price changes across all categories weighted by their expenditure share. Trimmed-mean inflation excludes a given percentage of the categories in the weighted distribution with the highest and lowest price changes.
- The persistence measure is computed as follows. First, we calculate monthly inflation rates for PCE categories at the level 4 aggregation. Next, for each month, we order and rank the categories based on their inflation rates for that month. Third, we regress these ranks on their own 12 lags using 36-month moving windows, with the first window running from July 2000 through June 2003 and the final window from July 2020 through June 2023. The sum of the autoregressive coefficients is our measure of persistence. Finally, we assign these persistence estimates to the final month of each window and plot them in Figure 3.
- To identify the categories with persistent inflation, we generate a rank for each category in every month from June 2019 through June 2022. We then compute the standardized average rank for each category by taking its mean rank (over time) and dividing it by the standard deviation of its rank (over time). The categories with the highest standardized average rank are the ones with the most persistent inflation (or deflation) over the period of consideration.
- These services include low-skill-labor-intensive services such as laundry and dry cleaning, haircuts/personal care, photo processing, and domestic services.

 About the Authors
Christopher D. Cotton,
Federal Reserve Bank of Boston
Christopher D. Cotton is an economist in the Federal Reserve Bank of Boston Research Department.
Email: Christopher.Cotton@bos.frb.org
Vaishali Garga,
Federal Reserve Bank of Boston
Vaishali Garga is an economist in the Federal Reserve Bank of Boston Research Department.
Email: Vaishali.Garga@bos.frb.org
Giovanni P. Olivei,
Federal Reserve Bank of Boston
Giovanni Olivei is a senior vice president and deputy director of research at the Federal Reserve Bank of Boston.
Email: Giovanni.Olivei@bos.frb.org
Viacheslav Sheremirov,
Federal Reserve Bank of Boston
Viacheslav Sheremirov is a senior economist in the Federal Reserve Bank of Boston Research Department.
Email: Viacheslav.Sheremirov@bos.frb.org
Acknowledgments
The authors thank Philippe Andrade and Jenny Tang for very helpful comments and John O’Shea for excellent research assistance.
Resources
Site Topics
Keywords
- inflation persistence ,
- bimodality ,
- sectoral price change distribution ,
- underlying inflation
JEL Codes
- E31 ,
- E52
Citation
Cotton, Christopher D., Vaishali Garga, Giovanni P. Olivei, and Viacheslav Sheremirov. 2023. “The Distribution of Sectoral Price Changes and Recent Inflation Developments.” Federal Reserve Bank of Boston Current Policy Perspectives, August 30, 2023.
Related Content
The Role of Industrial Composition in Driving the Frequency of Price Change
Oil and the Macroeconomy in a Changing World: A Conference Summary
Do Multisectoral New Keynesian Models Match Sectoral Data?
Recent Developments in Monetary Policy, Fiscal Policy, and Financial System Design