What Is Driving Inflation—Besides the Usual Culprits? 


The prices of services associated with low-skill workers have been a key driver of “supercore” inflation, which excludes food, energy prices, and shelter prices. Low-skill-services inflation seems to be tied to faster wage growth in those industries coming out of the COVID-19 pandemic. Wage growth in low-skill services has begun to decline, suggesting that there may be lower inflation in these industries going forward. At the same time, wage growth in high-skill services has recently accelerated, suggesting that there may be higher inflation in these industries in the near future.
Sign up for new research and data on the New England economy.
The recent spike in inflation as well as its persistence in the face of consecutive monetary policy rate hikes have caught economists off guard. Despite a cumulative rate hike of about 5 percentage points since the start of 2022, inflation stood at 6.1 percent on a year-over-year basis in February 2023 after it had peaked at 9.1 percent (8.9 percent seasonally adjusted) on a year-over-year basis in June 2022. Moreover, the apparent broad-based nature of the rise in prices has been a surprise. Often inflation spikes are driven by the volatile food and energy prices. These categories have definitely played a role in the recent rise, but inflation remains high even after they are excluded.1 Economists have also noted that the price of shelter, which makes up 34 percent of the Consumer Price Index (CPI), has risen substantially, perhaps due to sector-specific reasons.2 Yet, when food, energy, and shelter are all excluded, as they are from the recently coined "supercore" price index, inflation remains high.
This brief breaks down the CPI to examine which sectors have driven inflation. The goal is to determine which components of consumer spending are driving supercore inflation, and whether inflation is as broad based as many now believe. We find that supercore inflation has been driven primarily by prices of services associated with low-skill workers, such as motor vehicle maintenance and repair, and core goods not associated with transportation, such as personal goods and furniture. Prices of other components of supercore inflation—services associated with high-skill workers, transportation goods and services, and other services—have not risen as much.
We then examine why services associated with low-skill workers have seen much greater price inflation compared with services associated with high-skill workers since the beginning of the COVID-19 pandemic. The best explanation for the high price inflation in low-skill services is that wages in this sector rose faster following the end of the pandemic-related lockdowns. This wage inflation may have led to price inflation, which was delayed due to the slow speed with which prices adjust. Wage inflation for low-skill services has recently declined, suggesting that price inflation in low-skill services may fall going forward. However, at the same time, wage inflation for high-skill services has risen and remains high, which may imply that high-skill services could see higher price inflation in the future.
Prices of low-skill services and non-transportation core goods have been driving supercore inflation
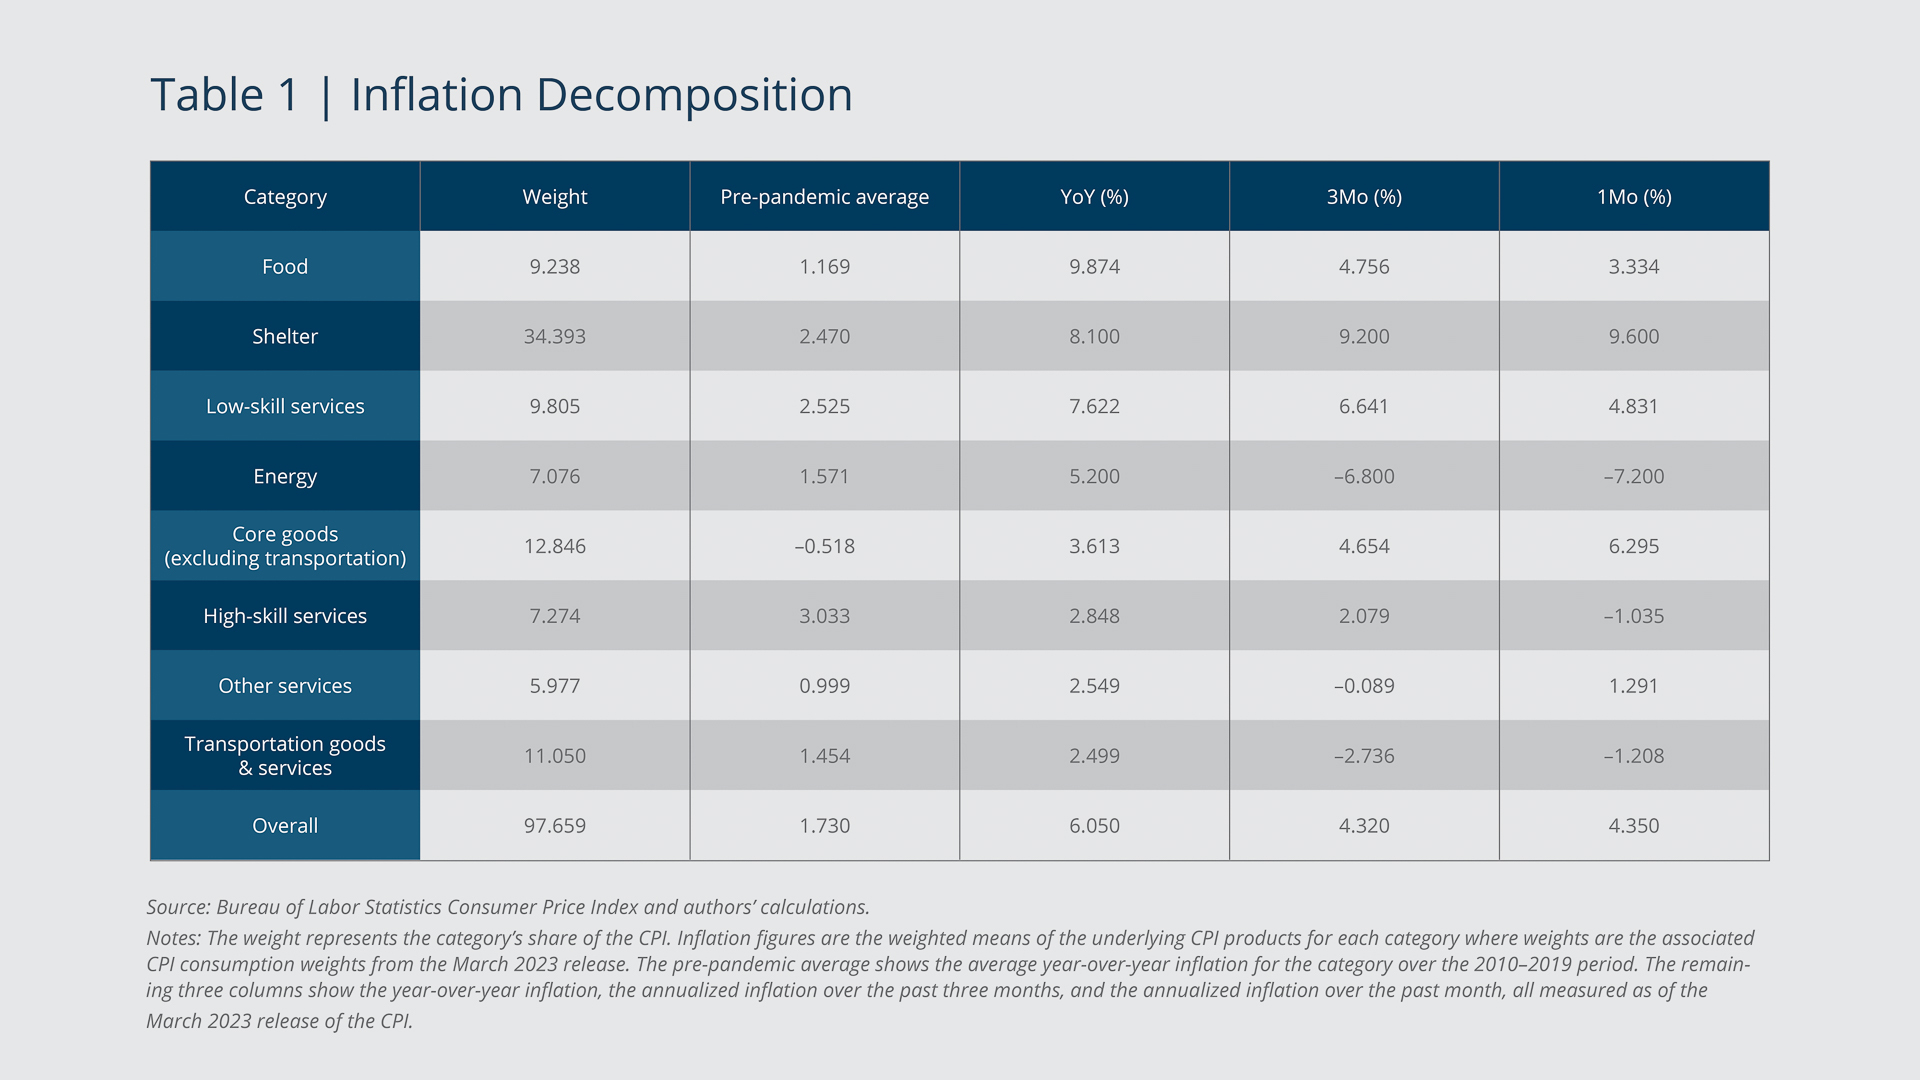
Table 1 summarizes the inflation decomposition across eight categories of consumer goods.3 The weight represents the category's share of the CPI. The pre-pandemic average shows the average year-over-year inflation for the category over the 2010–2019 period. The remaining three columns show the year-over-year inflation, the annualized inflation over the past three months, and the annualized inflation over the past month, all measured as of the March 2023 release of the CPI by the Bureau of Labor Statistics.

Federal Reserve Bank
Food, energy, and shelter have all played significant roles in driving inflation over the past year (February 2022 to February 2023). Food-at-home prices rose 9.9 percent year-over-year compared with a pre-pandemic average of 1.2 percent. The large increase has commonly been attributed to worries about global food supply due to the war in Ukraine. Energy prices rose 5.2 percent compared with a pre-pandemic average of 1.6 percent due to both energy supply issues related to the war in Ukraine and energy demand pressures as the recovery from the COVID-19 pandemic progressed. Food and energy prices are considered to be relatively volatile, which is why policymakers and financial markets typically pay attention to core inflation, which excludes those prices. A more surprising driver of recent inflation has been shelter prices, which rose 8.1 percent year-over-year compared with a pre-pandemic average of 2.5 percent. Shelter prices tend to reflect rent prices but with a lag, and rent prices rose substantially in 2021 as pandemic-related lockdowns lifted. Therefore, the large rise in shelter prices may be sector-specific and reflect rent changes that occurred in the past. For more details, see Cotton and O'Shea (2023).
Some components of the supercore price index (core categories excluding shelter) have seen high inflation, while others have not. Prices of services associated with low-skill workers had year-over-year inflation of 7.6 percent compared with a pre-pandemic average of 2.5 percent. These types of services include motor vehicle repair, tailoring, photography, and postal services. On the other hand, services associated with high-skill workers had year-over-year inflation of only 3.0 percent compared with a pre-pandemic average of 2.8 percent. This category includes legal services, health care, and college tuition. The large difference in inflation between low-skill and high-skill services is surprising and the focus of the rest of this brief. Among the remaining components, prices of core goods excluding transportation grew 3.6 percent, but the average pre-pandemic growth was –0.5 percent. The reason for the low pre-pandemic average is that core goods include consumer electronics and household furnishings, the prices of which had fallen in recent years. One factor leading to high core-goods inflation could be the supply-chain issues that made it difficult for firms to meet the demand for goods after the onset of the COVID-19 pandemic. Other services experienced year-over-year inflation of 2.5 percent compared with a pre-pandemic average of 1.0 percent. This category includes payments for telecommunication and internet services. Transportation goods and services saw relatively low year-over-year inflation of 2.5 percent compared with a pre-pandemic average of 1.5 percent. However, there has been significant variation in the inflation rates of different items within this category. Used-car prices fell significantly over the past year, while airline ticket prices rose substantially. Overall, these numbers suggest that while inflation is broad based in the sense of being higher than usual in many sectors of the economy, it is notably higher than the Federal Reserve's 2 percent target in only two supercore categories.
Federal Reserve Bank
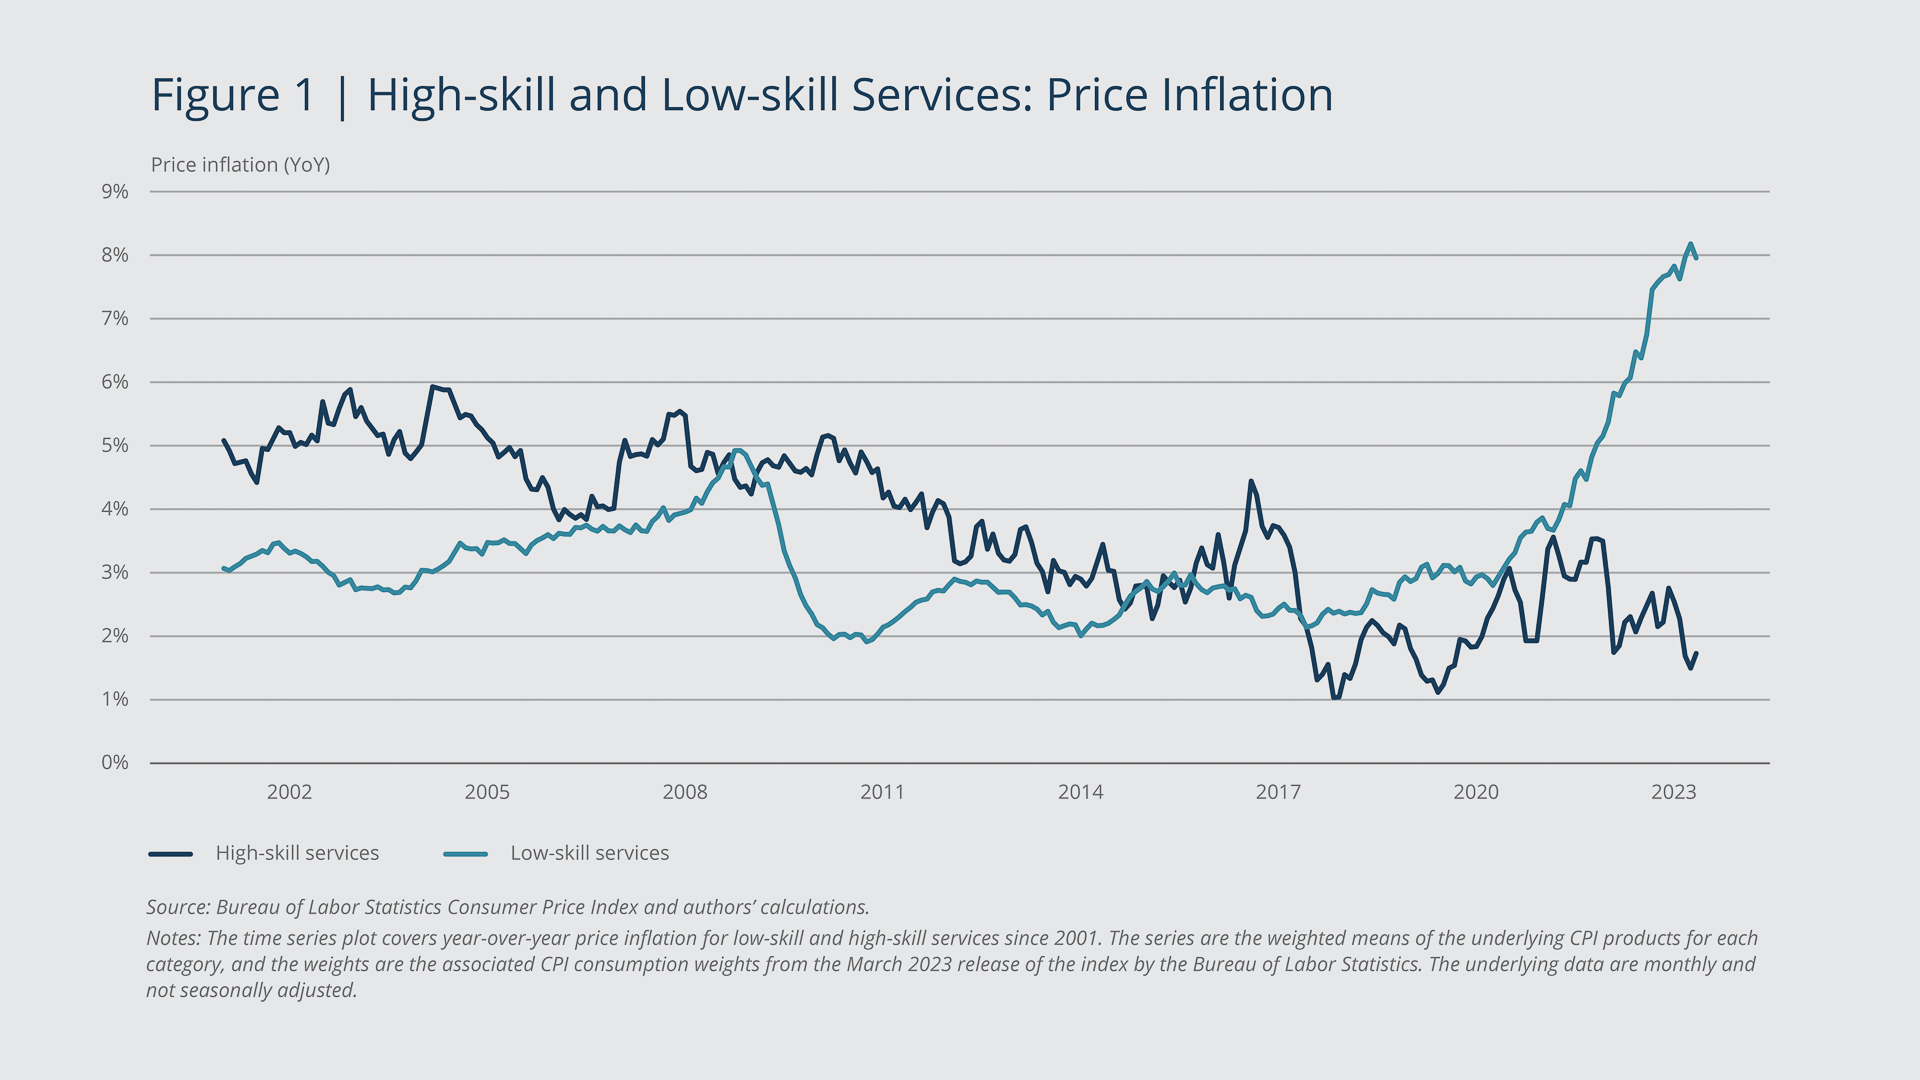
Figure 1 shows the evolution of year-over-year price inflation in low-skill and high-skill services since 2000. For much of this period, high-skill-services inflation was higher than low-skill-services inflation. However, starting in 2017, the pattern reversed: Low-skill-services prices started to rise at a faster pace, perhaps due to increases in the minimum wage in certain regions, which is likely to affect low-skill services more than high-skill services. As the economy reopened during the COVID-19 pandemic, low-skill-services inflation spiked, while there has been no corresponding movement in high-skill-services inflation.
High wage inflation may have caused a delayed rise in price inflation for low-skill services
According to a simple model of price setting in which firms have market power, firms will set a price that is a markup over the nominal wage adjusted for the productivity level.4 Therefore, there are a few potential reasons why low-skill services may have had higher price inflation than high-skill services: higher markup growth, lower productivity growth, higher nominal wage growth, or all three.
Federal Reserve Bank
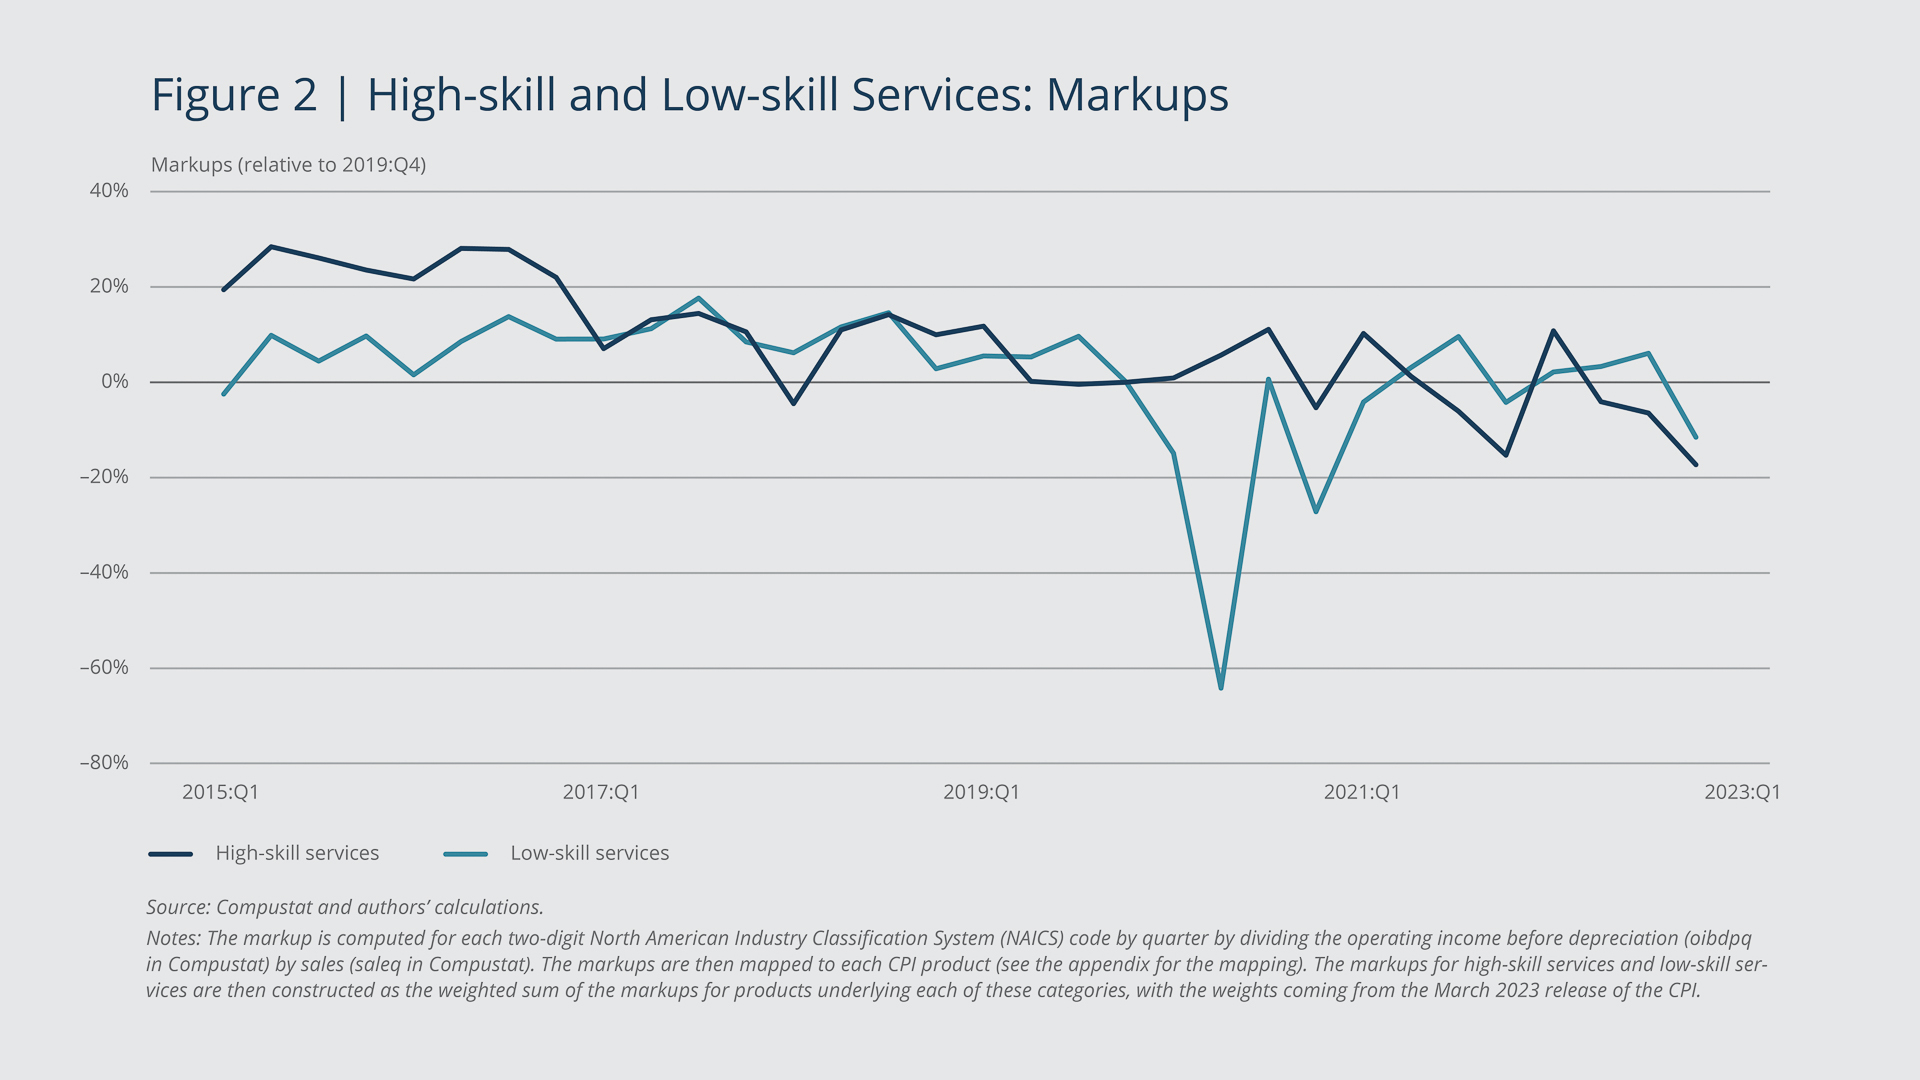
Higher markups (margins) imply that firms have greater market power and can choose a higher price without losing market share, given productivity-adjusted wages. Figure 2 shows the markups for high-skill and low-skill service firms relative to the fourth quarter of 2019. The markups in both categories are broadly similar to their respective pre-pandemic values. Low-skill services experienced a large drop in markups during the pandemic, presumably because the lockdowns had a greater effect on the profitability of these types of firms. However, the markups of low-skill services quickly recovered and returned to a level similar to that of high-skill services. Therefore, differential markup growth does not appear to be driving the recent differences in low-skill-services and high-skill-services price inflation.
Federal Reserve Bank
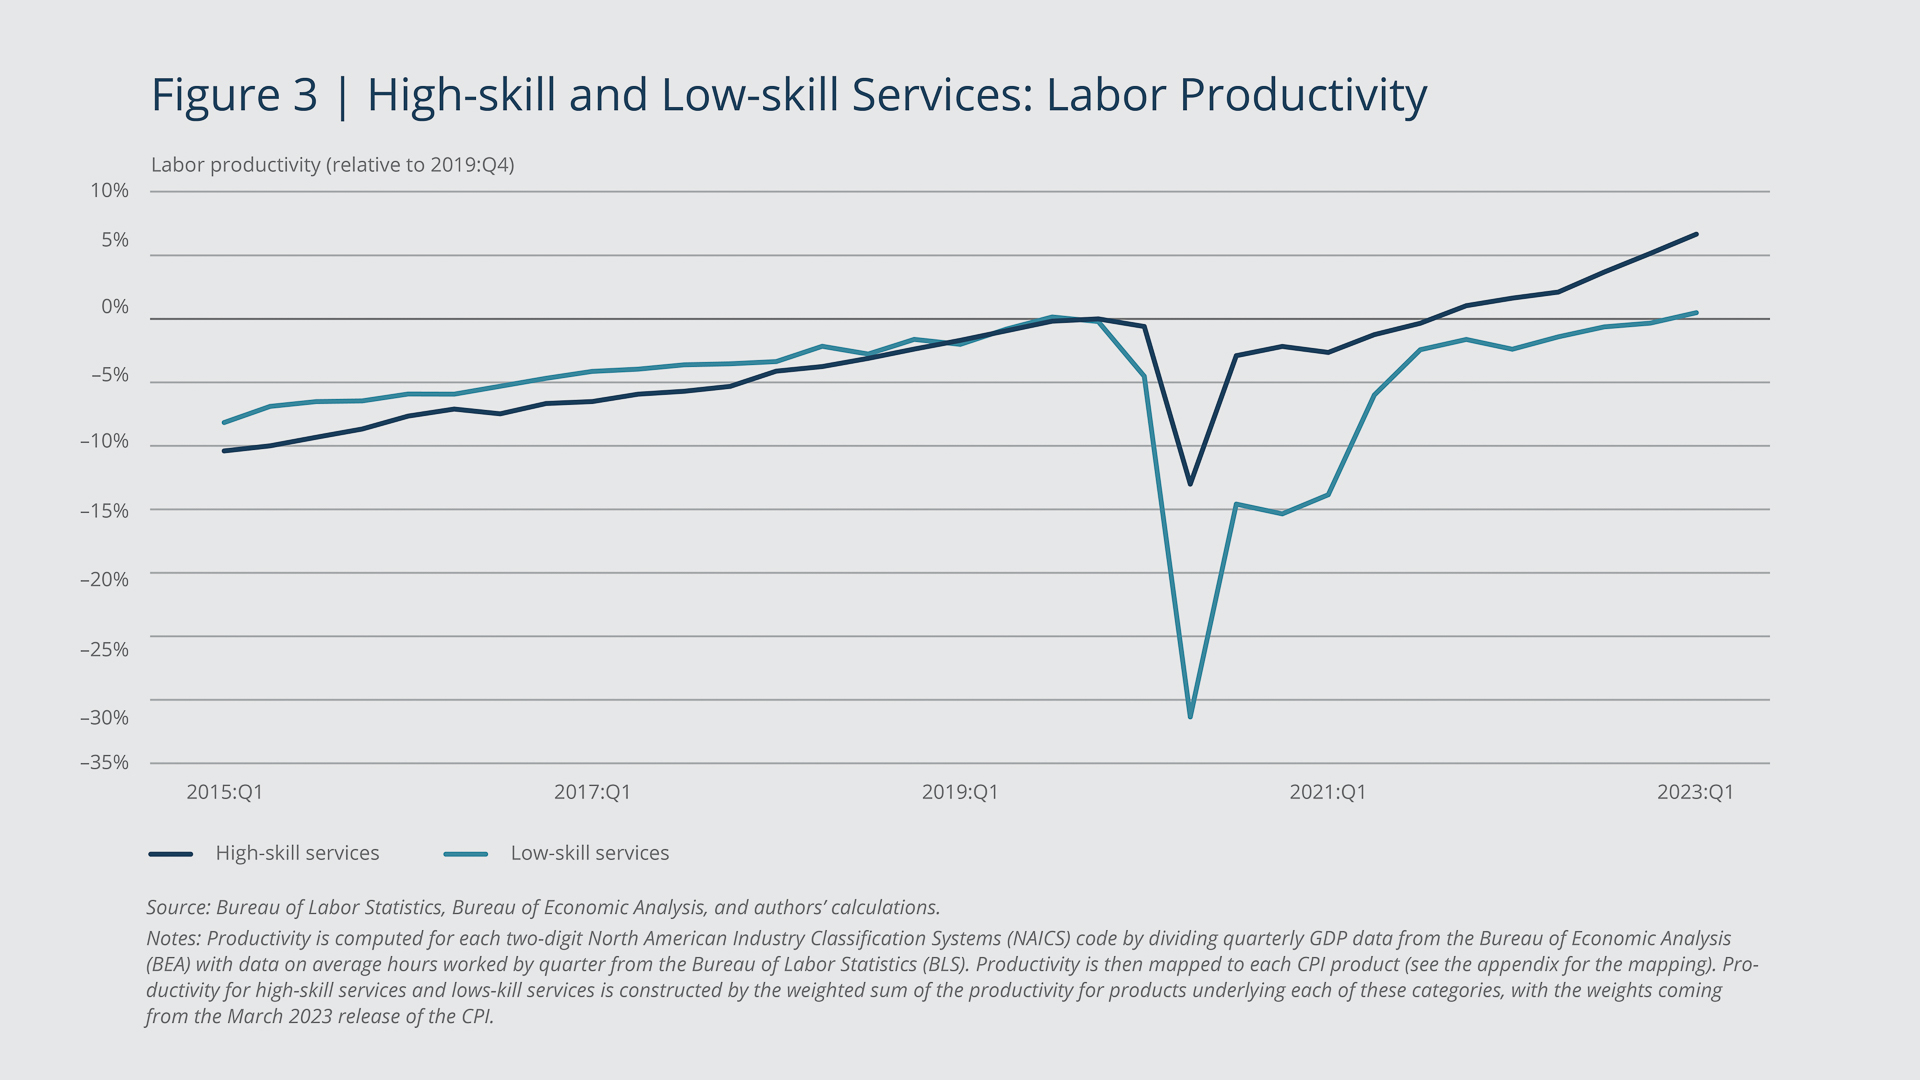
Higher productivity implies that firms can produce the same output with fewer workers, which in turn implies that they could lower their prices, given margins and nominal wages. Figure 3 shows the labor productivity for high-skill and low-skill service firms relative to the fourth quarter of 2019. Both types of services saw drops in labor productivity during the COVID-19 pandemic. This decline is partly mechanical because productivity is constructed by comparing output, which dropped during the pandemic, with the amount of labor, which also dropped but by less. Since the lockdowns lifted, high-skill services have shown greater productivity growth, which implies that those firms need fewer workers and could raise their prices less than low-skill services. That being said, this pattern could be a return to the pre-pandemic trend in which high-skill services were already seeing faster productivity growth relative to low-skill services. If that is the case, it would not explain the persistent reversal in the inflation pattern after the onset of the pandemic. Therefore, changes in labor productivity are unlikely to have driven the recent differences between low-skill-services and high-skill-services price inflation.
Federal Reserve Bank
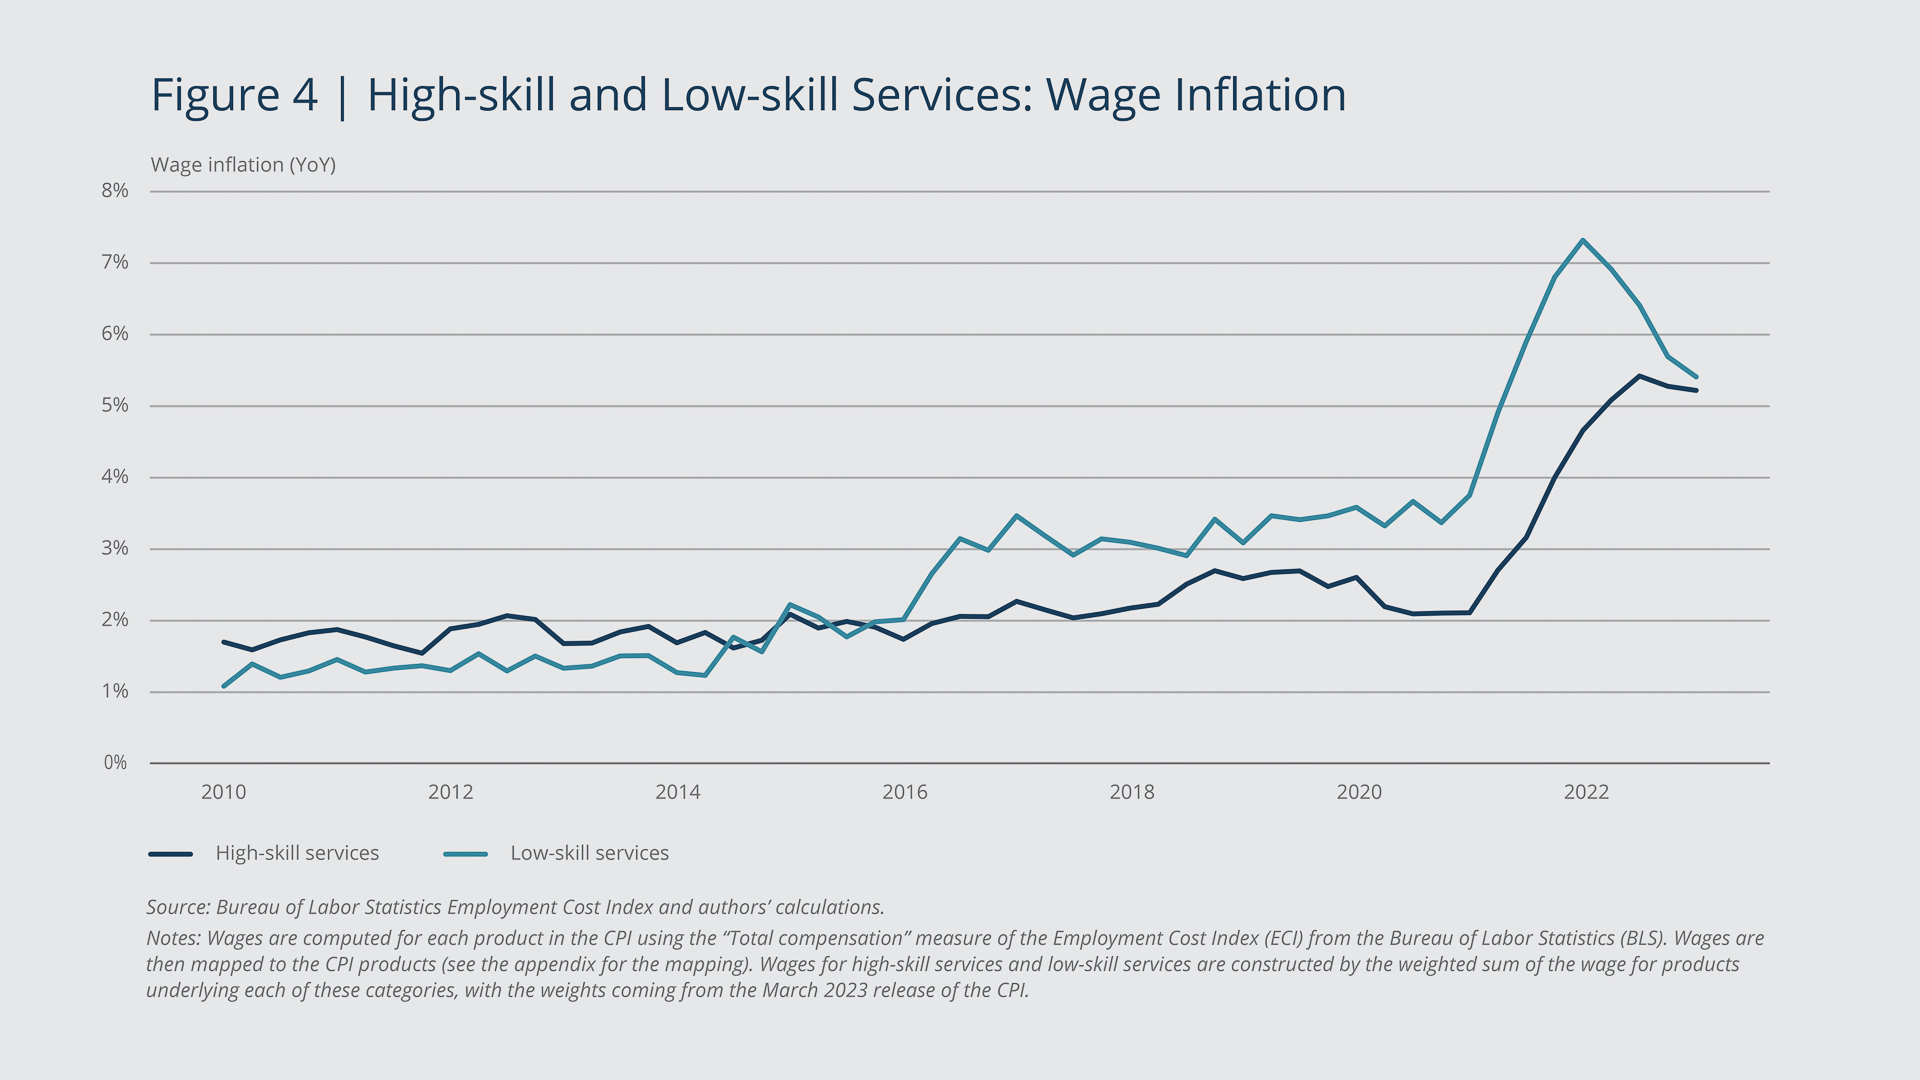
Higher nominal wages lead firms to raise prices, given productivity and desired markups. Figure 4 shows wage growth on a year-over-year basis for high-skill and low-skill service firms. Wage growth for low-skill services rose substantially in 2021 to more than 7 percent but has fallen back recently. Wage growth for high-skill services recently has begun to rise and now is close to the level for low-skill services after having remained near the Federal Reserve's inflation target of 2 percent. These results, combined with Figure 1, suggest that wage inflation takes time to feed through to price inflation. Many studies show that firms often update their prices slowly. Indeed, Nakamura and Steinsson (2008) suggest that services have a particularly low frequency of price change, with prices remaining the same for about 15 months on average. Therefore, it makes sense that it would take time for wage increases to feed through into price increases. This assumption also fits with the fact that wages for low-skill services switched from having lower wage inflation compared with high-skill services in the 2015–2017 period, but it was only in 2017 that low-skill services saw higher price inflation relative to high-skill services.
If wage inflation has a delayed impact on price inflation, and wage inflation for low-skill services has recently fallen, then price inflation for low-skill services is likely to fall in the near future. However, wage inflation for high-skill services has recently risen substantially, driven partly by large wage increases in the health-care sector. This pattern suggests that there may be high price inflation in high-skill services in the near future.
Endnotes
- Food and energy prices are excluded from core inflation but included in headline inflation. For the remainder of this brief, we use inflation to refer to headline inflation and add the prefixes "core" and "supercore" as needed.
- Price of shelter is measured as the rent that tenants pay or the rent that homeowners would pay to live in their houses if they didn't own them.
- We grouped different components of the CPI together with the aim of obtaining a handful of cohesive categories. We did not assign a small portion of the CPI products (2.5 percent by their total weight in the CPI) to any category because it was unclear to which category they belong. For example, we did not assign financial services to a category because it could belong in both high-skill services and low- skill services. We assigned food away from home, which includes restaurants and cafes, to low-skill services because that type of labor accounts for a large component of restaurant prices. As is shown in the appendix, low-skill services would still see high inflation if the food away from home category were omitted. With food away from home instead assigned to the food category, low-skill services inflation is 6.9 percent measured on a year-over-year basis. See the appendix for the full decomposition.
- We are implicitly assuming that labor is the only factor of production. We make this assumption because labor is generally a majority input in the production of services, which are the focus of this paper.
References
Cotton, Christopher, and John O'Shea. 2023. "Forecasting CPI Shelter under Falling Market-Rent Growth." Federal Reserve Bank of Boston Research Paper Series Current Policy Perspectives (February 16, 2023).
Nakamura, Emi, and Jón Steinsson. 2008. "Five Facts about Prices: A Reevaluation of Menu Cost Models." The Quarterly Journal of Economics 123(4): 1415–1464.
The views expressed herein are those of the authors and do not indicate concurrence by the Federal Reserve Bank of Boston, the principals of the Board of Governors, or the Federal Reserve System.

 About the Authors
Christopher D. Cotton,
Federal Reserve Bank of Boston
Christopher D. Cotton is an economist in the Federal Reserve Bank of Boston Research Department.
Email: Christopher.Cotton@bos.frb.org
Vaishali Garga,
Federal Reserve Bank of Boston
Vaishali Garga is an economist in the Federal Reserve Bank of Boston Research Department.
Email: Vaishali.Garga@bos.frb.org
Acknowledgments
The authors thank Giovanni Olivei, Jenny Tang, Viacheslav Sheremirov, Falk Bräuning, María Luengo-Prado, and Dhiren Patki for comments and John O’Shea for excellent research assistance.
Resources
Site Topics
Keywords
- inflation ,
- CPI ,
- supercore
JEL Codes
- E31 ,
- E66 ,
- E50
Citation
Cotton, Christopher D., and Vaishali Garga. 2023. “What Is Driving Inflation—Besides the Usual Culprits?” Federal Reserve Bank of Boston Current Policy Perspectives. July 13, 2023.
Related Content
The Implications of High Leverage for Financial Instability Risk, Real Economic Activity, and Appropriate Policy Responses
Oil and the Macroeconomy in a Changing World: A Conference Summary
Does Fed Policy Reveal a Ternary Mandate?
Should the Fed Regularly Evaluate Its Monetary Policy Framework?