New England Economic Conditions through March 5, 2024 


Key Takeaways
- Unemployment rates edged up in December 2023 from one month earlier in all six New England states. Nonetheless, for Massachusetts, Rhode Island, and Vermont, the labor force participation rate also increased slightly in December, suggesting improvements in labor supply. Elsewhere in the region, higher unemployment rates appeared to signal an increase in layoffs.
- For both New England and the United States, nominal wage and salary growth outpaced consumer price inflation in the second half of 2023, resulting in net gains in real wages and salaries on a year-over-year basis for both 2023:Q3 and 2023:Q4. The recent (year-over-year) pace of real wage growth was relatively modest in both the United States and the region, at less than 1 percent, but represented a significant improvement from the negative real wage growth rates observed from 2021:Q2 to 2023:Q1.
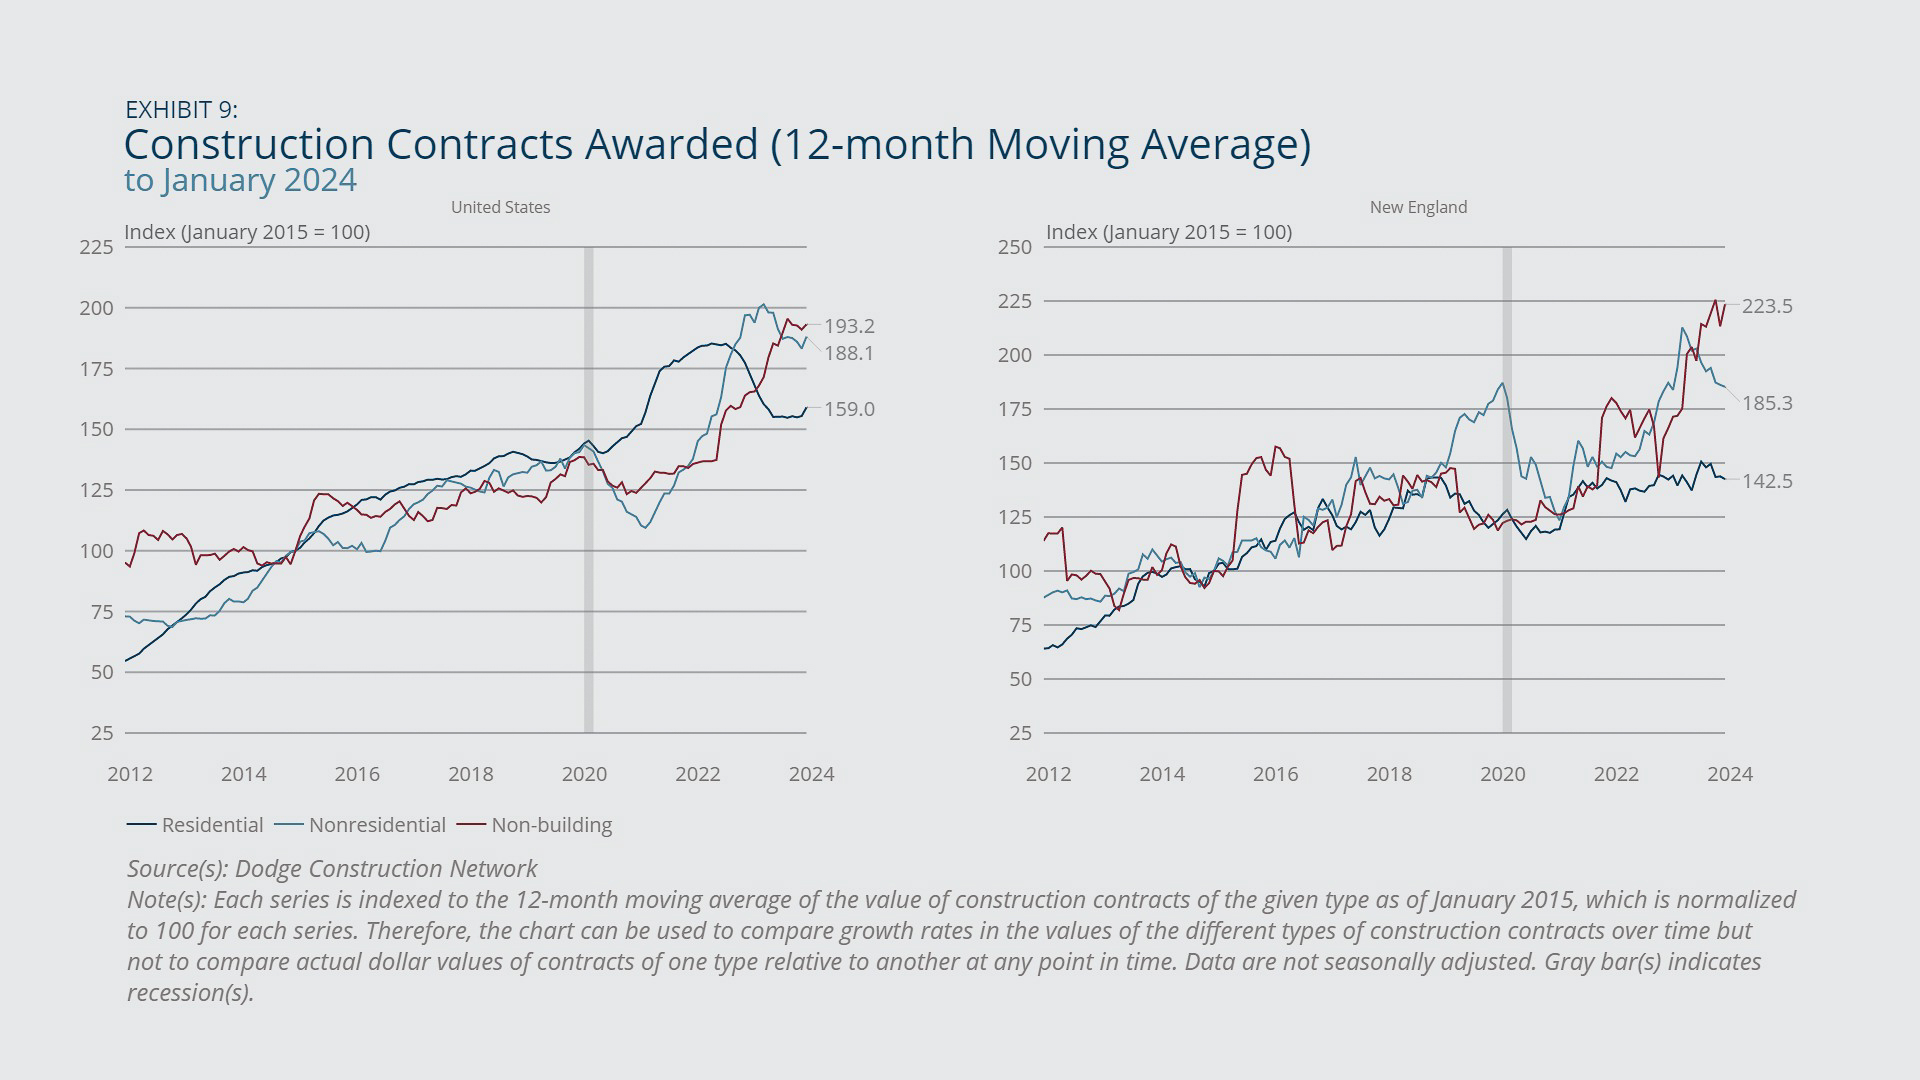
- Non-building construction, reflecting the construction of roads, bridges, and other infrastructure, experienced robust growth year-over-year for January 2024 in both New England and the United States (based on the value of contracts awarded), while construction of residential and nonresidential structures was flat in the region and down in the United States for the same period.
Sign up for new research and data on the New England economy.
Payroll Employment
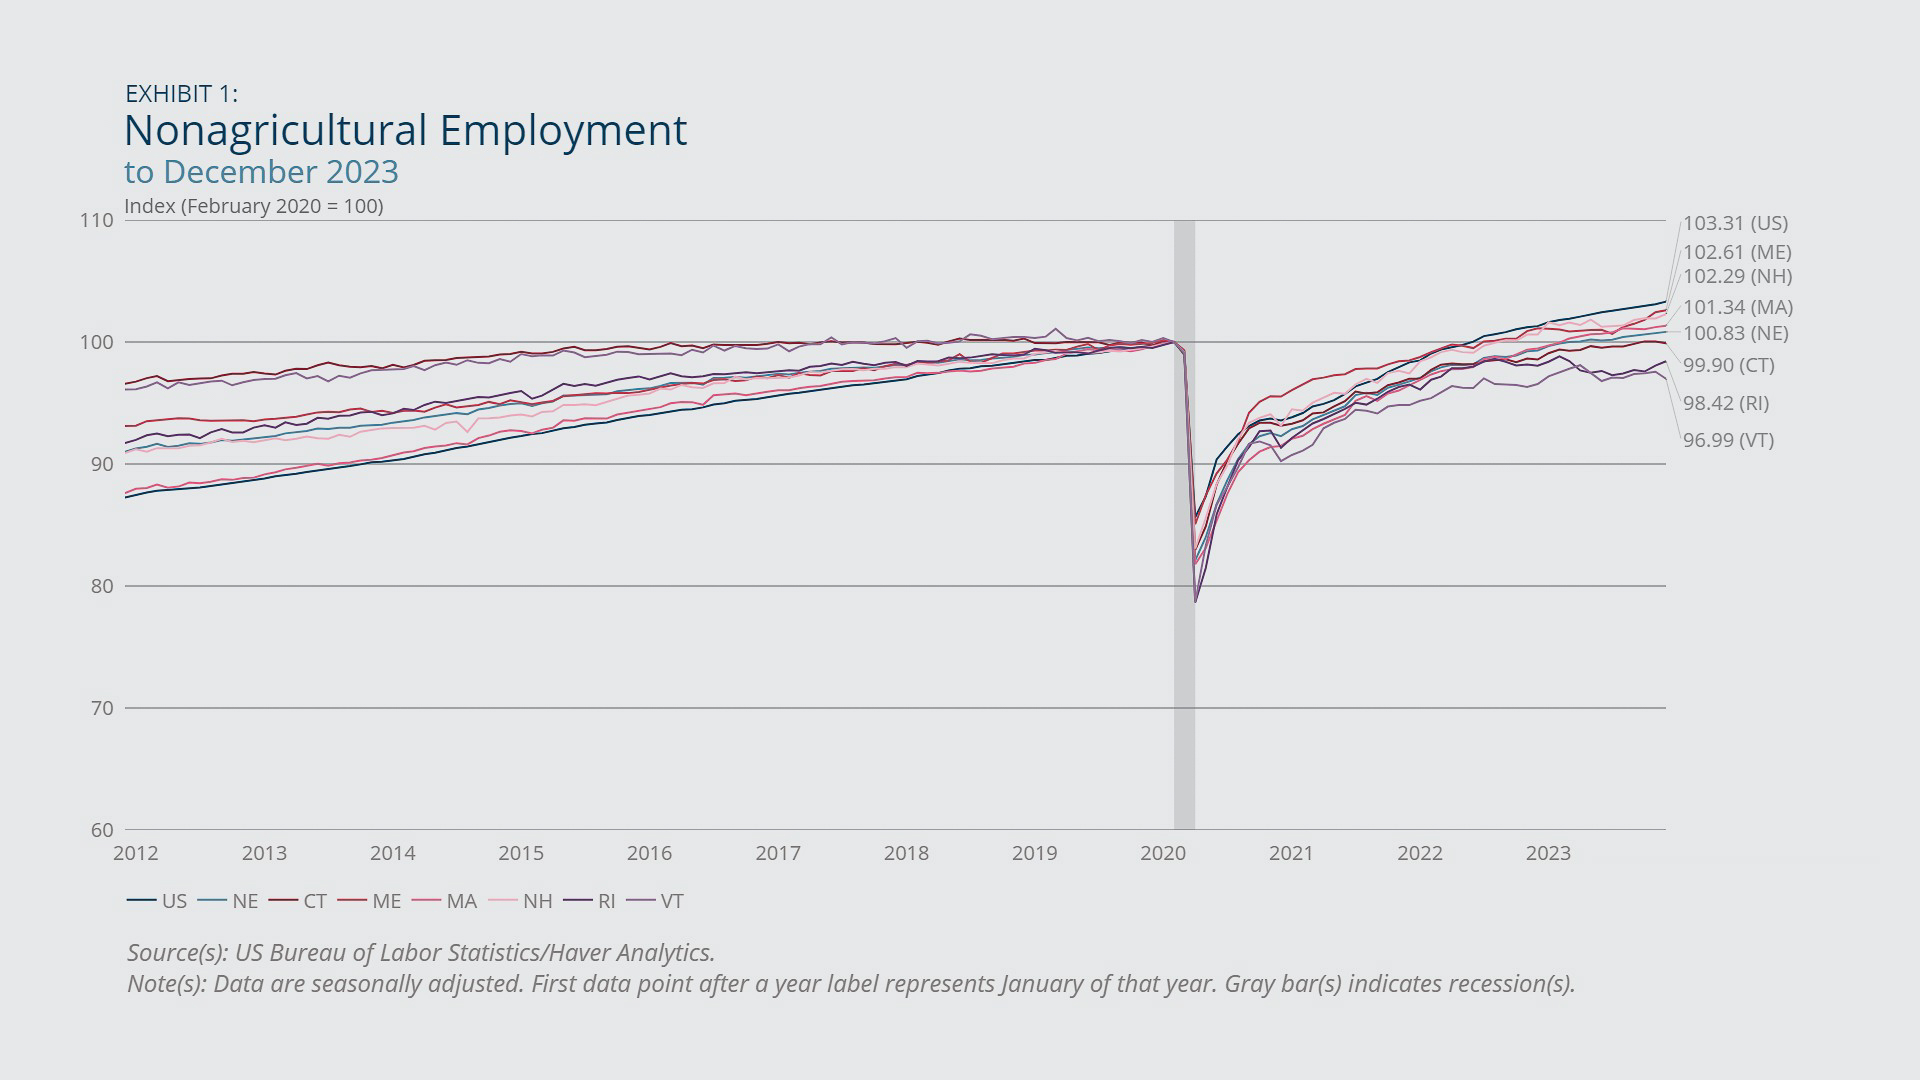
- Total (nonagricultural) payroll employment in New England has more than recovered its pandemic-era losses, although payrolls in both Rhode Island and Vermont continued to miss their pre-pandemic benchmarks by nontrivial margins (Exhibit 1).
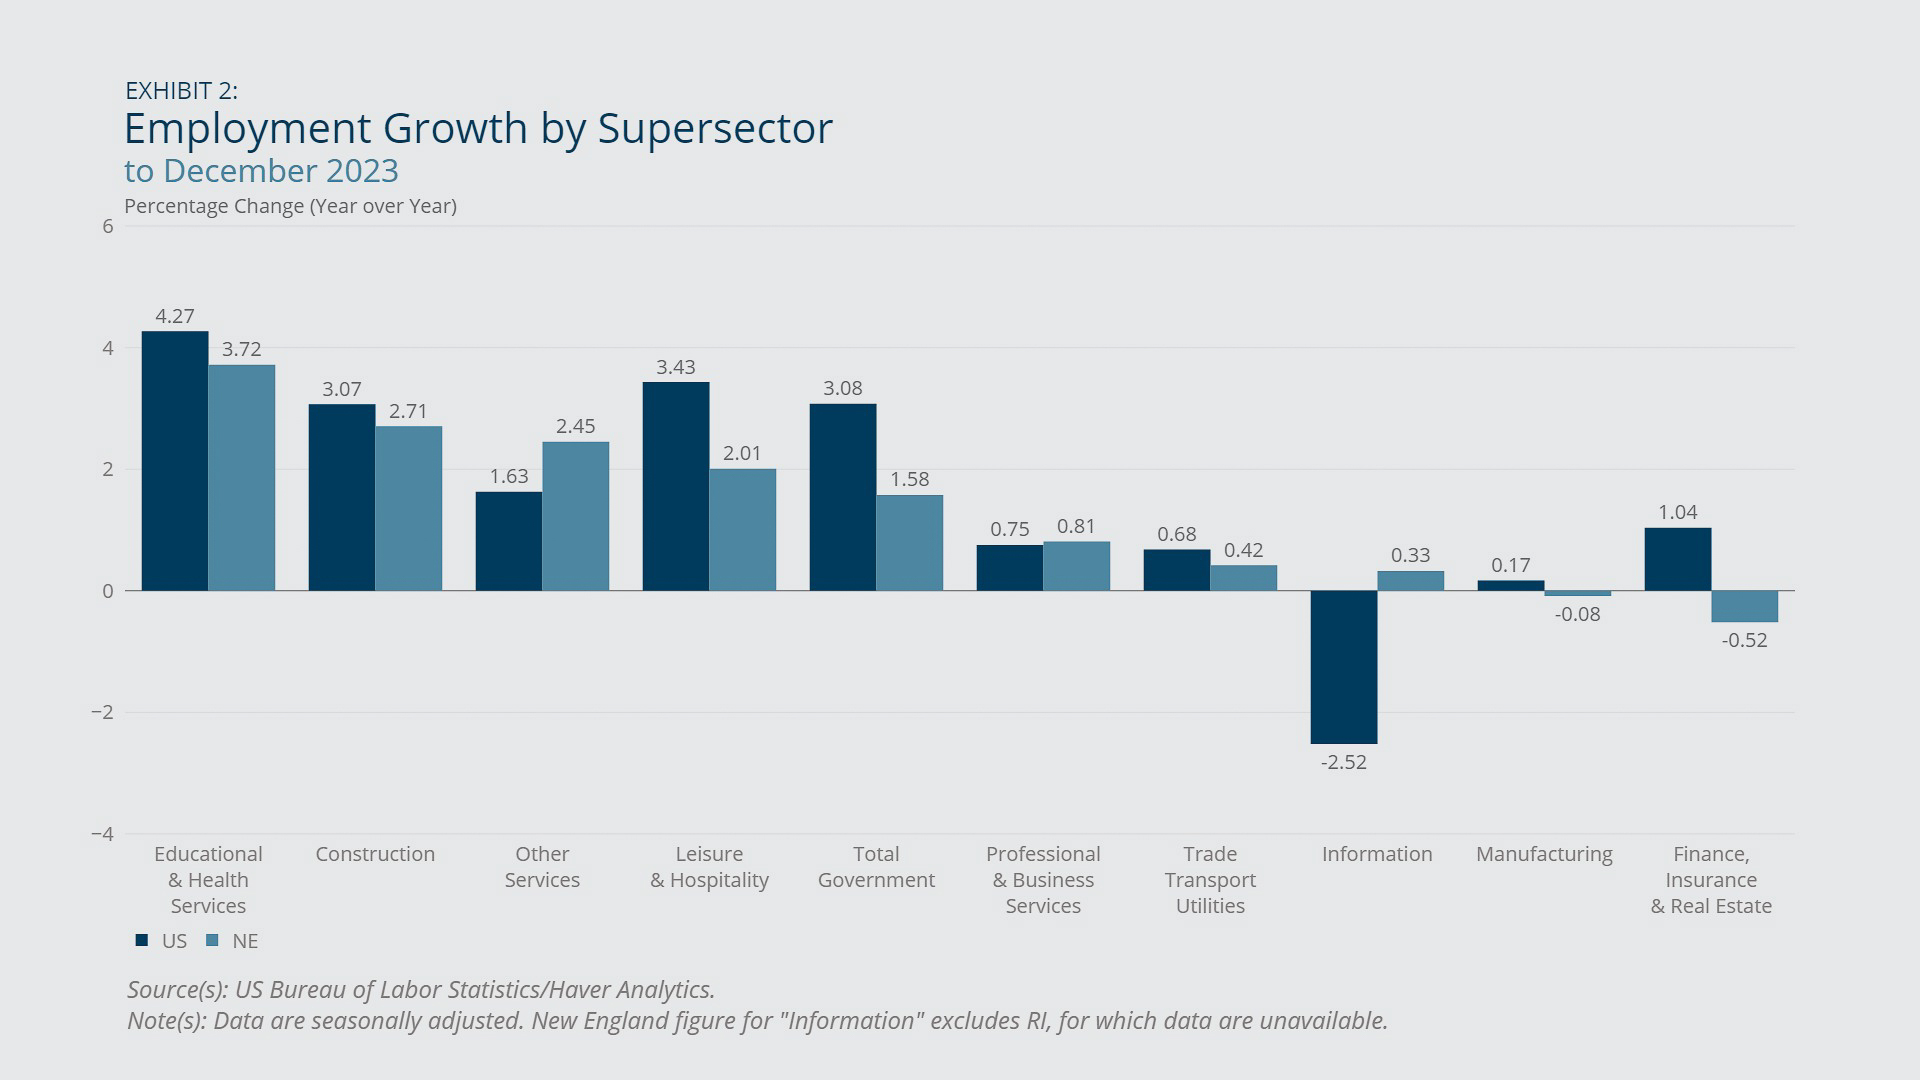
- The region’s finance, insurance, and real estate sector experienced outright job losses year-over-year for December 2023, whereas jobs in that sector nationwide increased by 1 percent for the same period (Exhibit 2).
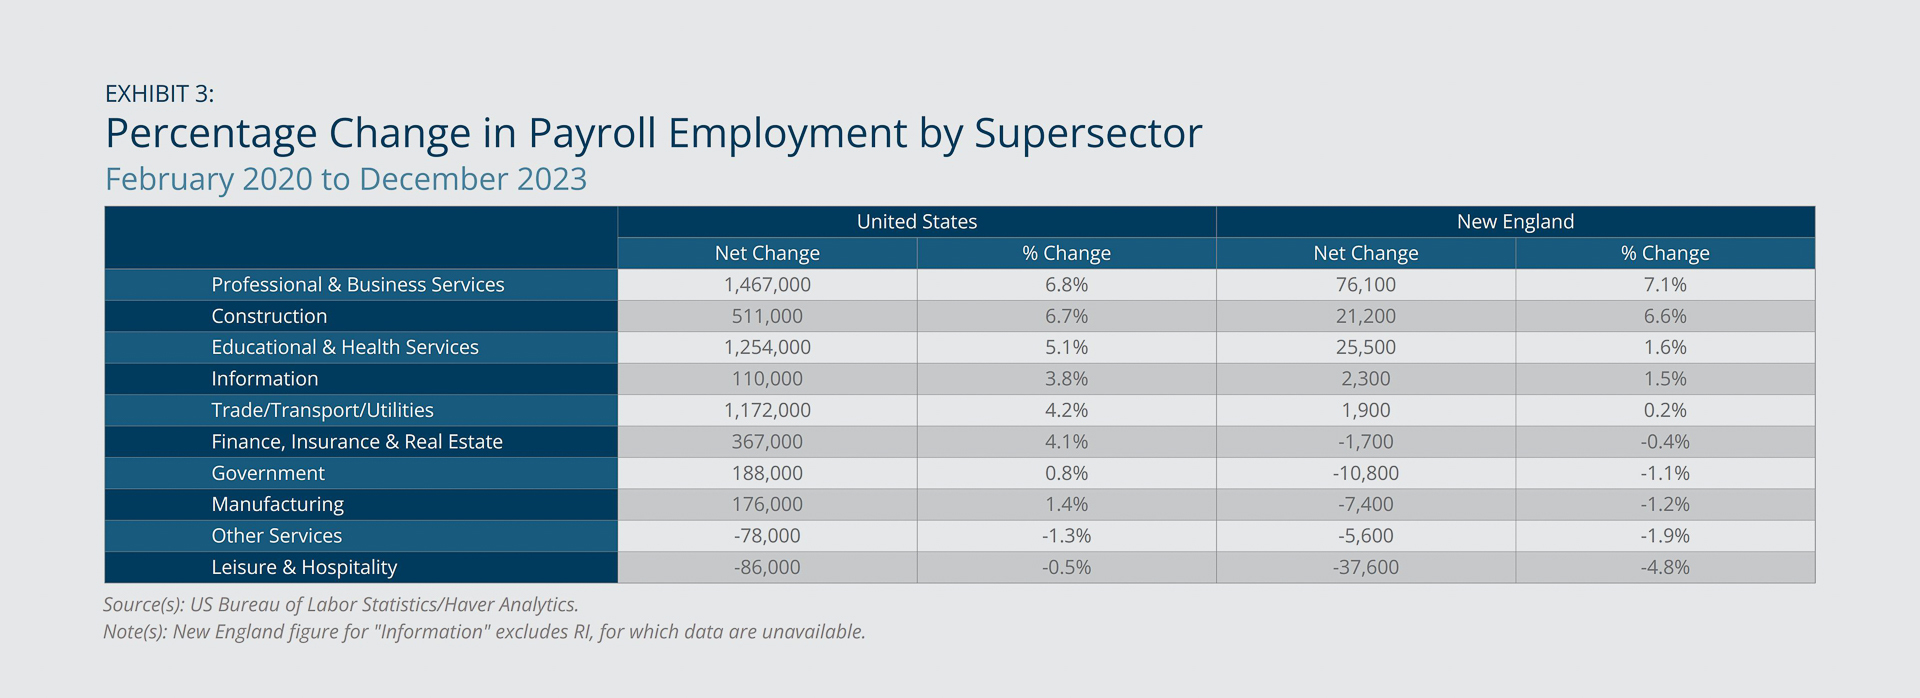
- New England’s leisure and hospitality sector experienced solid (2 percent) employment growth year-over-year for December 2023 (Exhibit 2), but jobs in that sector nonetheless fell short of their February 2020 tally by 4.8 percent (Exhibit 3).
Although most sectors in the New England economy experienced at least slight year-over-year increases in employment for December 2023, the manufacturing sector saw slight job losses, and the finance, insurance, and real estate sector experienced a change of –0.52 percent (Exhibit 2). The latter change owed mostly to job losses in the real estate, rental, and leasing subsector, as job losses in the financial activities subsector were close to zero. The region as a whole, and each New England state individually, lags the United States in terms of net payroll employment growth since February 2020 (Exhibit 1). The comparatively weak recovery applies to all supersectors in the region except professional and business services (Exhibit 3). According to First District Beige Book contacts, the incomplete recovery of leisure and hospitality jobs in the region since the onset of the pandemic (Exhibit 3) owes to shortfalls in labor supply rather than to weak labor demand, although supply shortages in that sector reportedly eased in 2023 relative to 2021 and 2022.1

Federal Reserve Bank of Boston
Federal Reserve Bank of Boston
Federal Reserve Bank of Boston
Household Employment
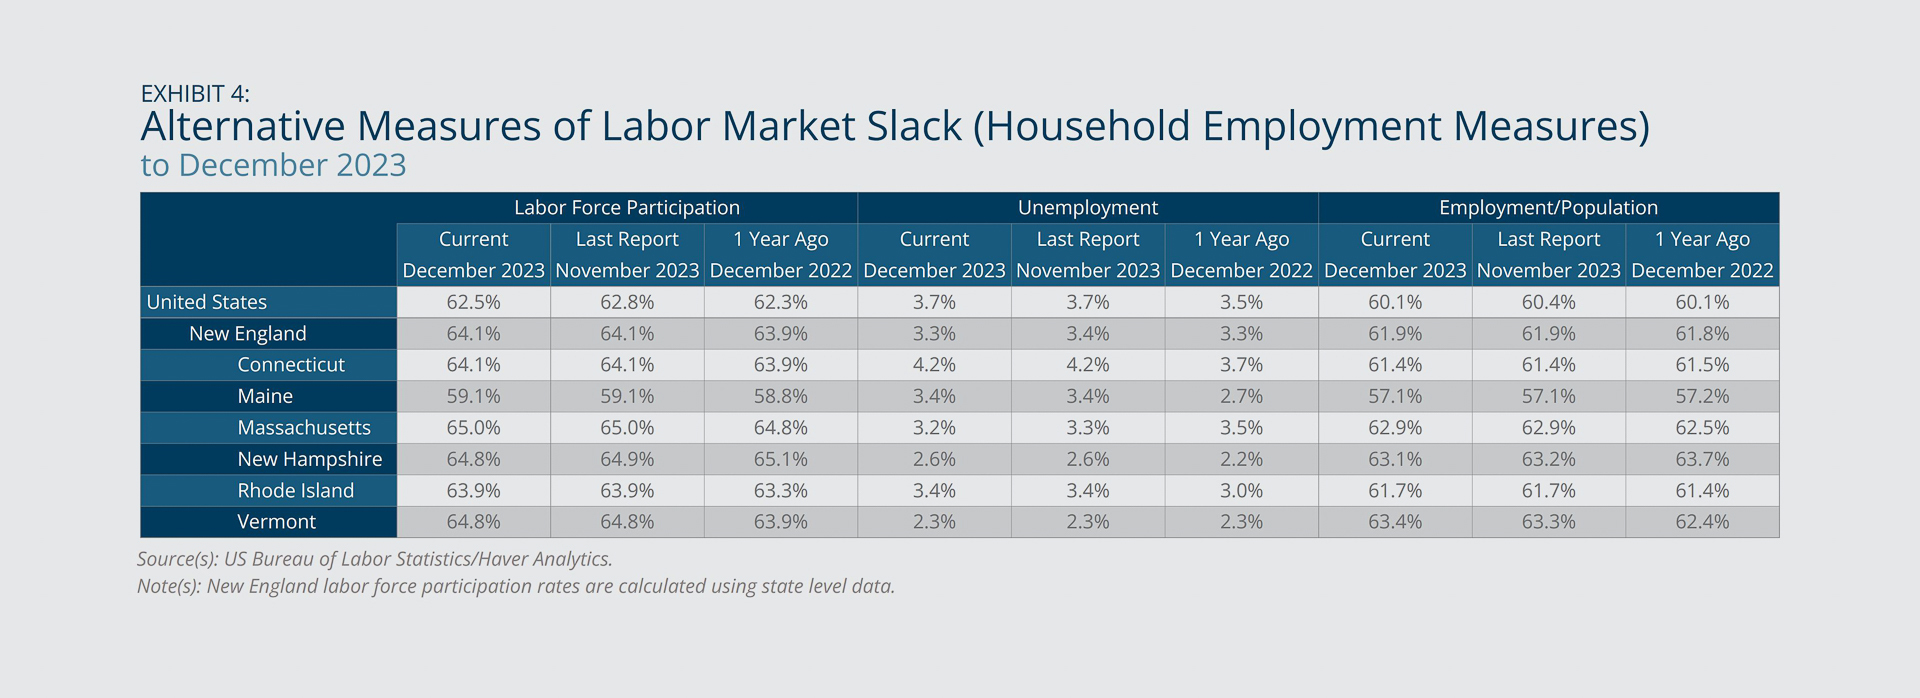
- New England’s unemployment rate ticked up 0.2 percentage point, rising from 2.9 percent in November 2023 to 3.1 percent in December 2023, but it remained below its December 2022 reading of 3.5 percent. Across the region’s states, the month-over-month unemployment rate increase was nearly uniform at 0.2 percentage point (Exhibit 4).
- The labor force participation rate in New England overall was roughly flat over the year to December 2023, obscuring the fact that some states in the region (Vermont, Maine, and Rhode Island) experienced significant increases in their participation rates, and others (New Hampshire and Connecticut) saw noticeable declines (Exhibit 4).
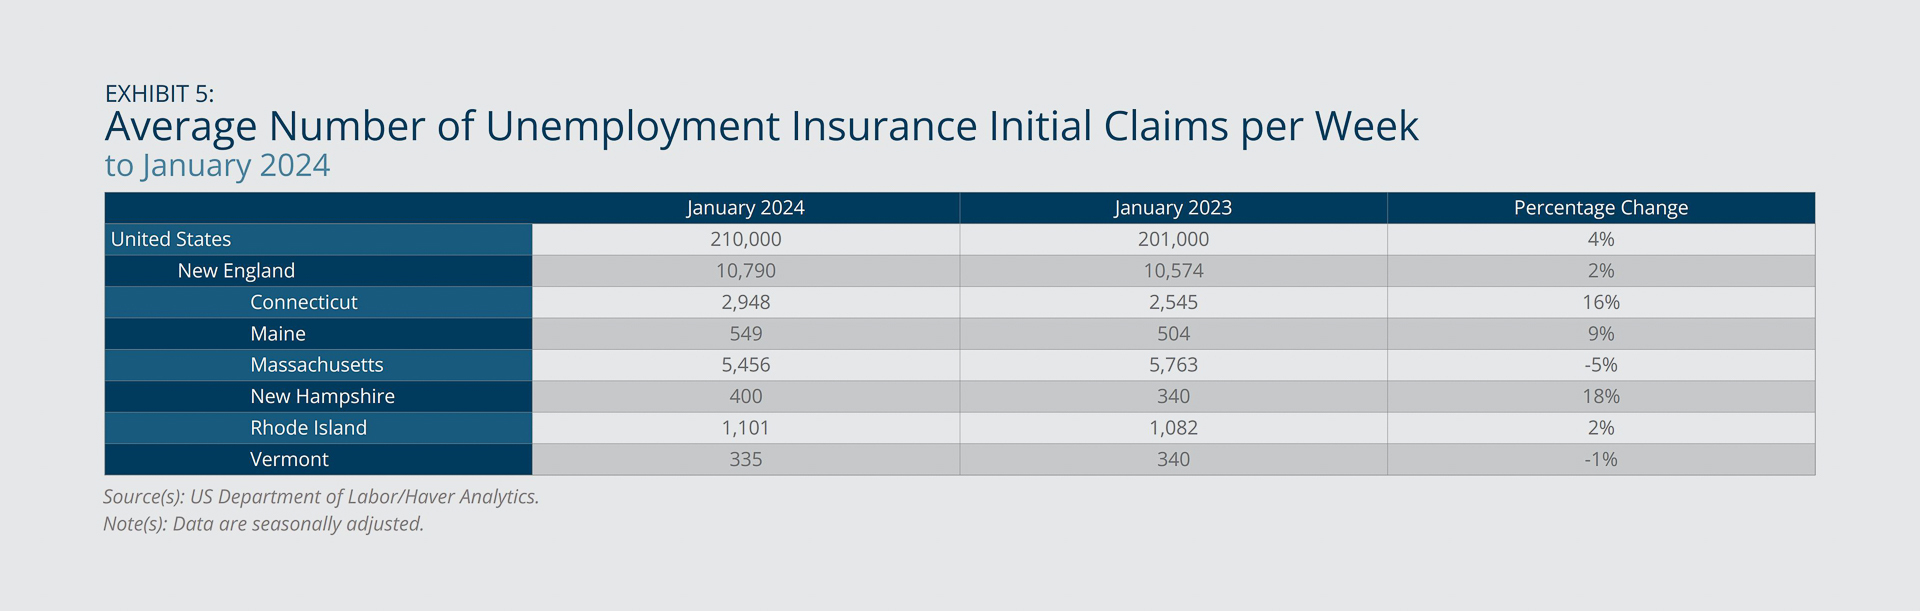
For three New England states—Massachusetts, Rhode Island, and Vermont—the small increase in the unemployment rate in December (from November) coincided with a small increase in the labor force participation rate (Exhibit 4), suggesting an entrance of jobseekers to the labor market rather than an uptick in layoffs or quits. However, each of the remaining states (Connecticut, Maine, and New Hampshire) had an uptick in its unemployment rate combined with a flat labor force participation rate, suggesting an increase in the separation rate. Consistent with that suggestion, those three latter states all posted sizeable increases in average weekly initial claims for unemployment insurance in January 2024 compared with the previous January, whereas the other New England states saw either very modest increases in initial claims (Rhode Island) or net declines in claims (Massachusetts and Vermont) relative to January 2023 (Exhibit 5). Also, in both Connecticut and New Hampshire, the employment-to-population ratio declined by a nontrivial margin year-over-year for December 2023. For the region as a whole, however, the employment-to-population ratio increased by 0.2 percentage point over that period (Exhibit 4).
Federal Reserve Bank of Boston
Federal Reserve Bank of Boston
Employment Cost Indexes
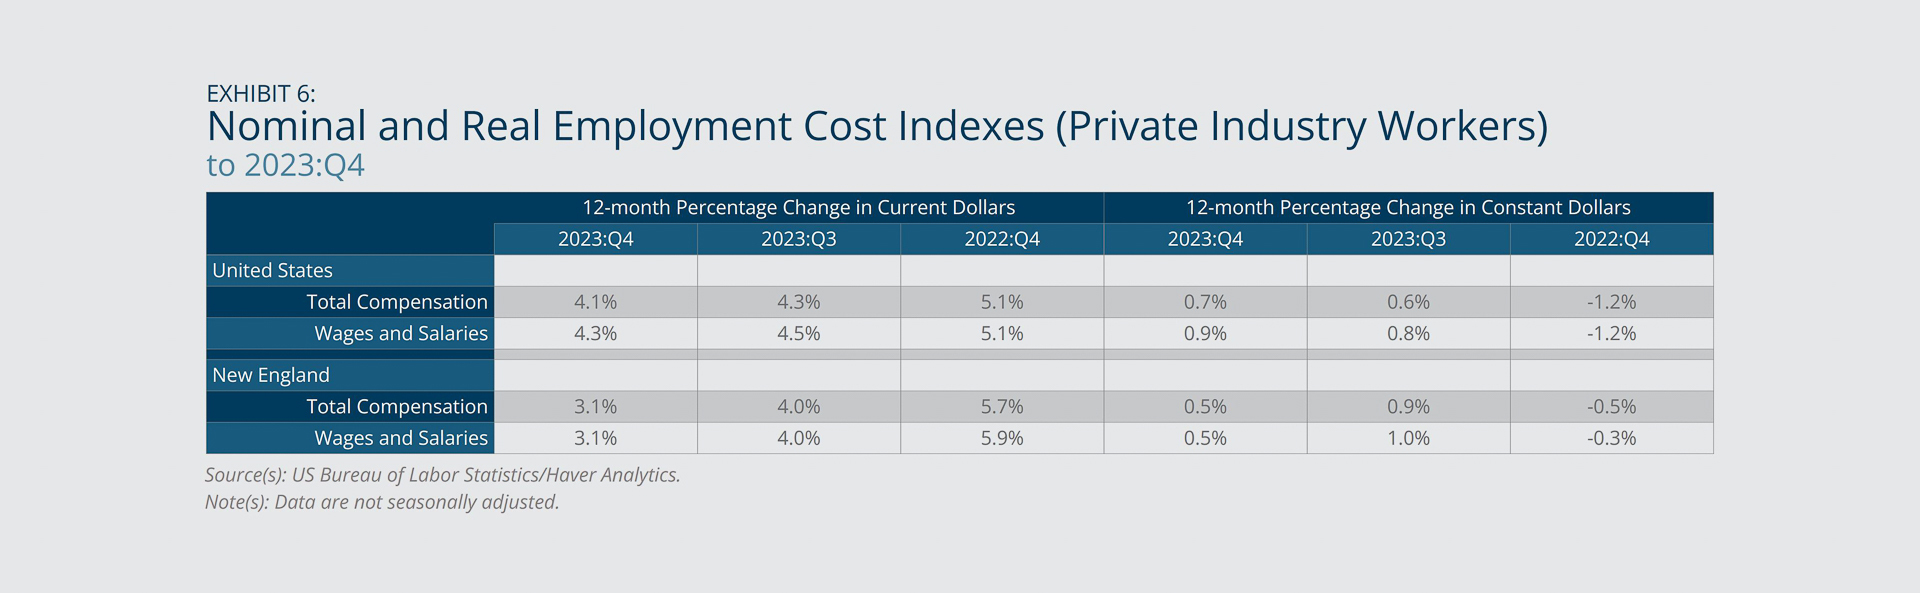
- The 12-month growth rate in nominal wages/salaries trended downward in New England and in the United States overall from 2022:Q4 and 2023:Q4, although the decline was steeper in the region than in the country as a whole.
- Growth rates in (nominal) total compensation were not much different quantitatively from the corresponding growth rates in wages and salaries (Exhibit 6).
- By contrast, growth in real wages and salaries increased from moderate negative rates (observed in 2022:Q4) to modest positive rates in 2023:Q3 and 2023:Q4 for both New England and the United States (Exhibit 6). Growth in real total compensation behaved similarly.2
The contrast between declining growth in nominal employment costs and accelerating growth in real compensation reflects the significant moderation in price inflation from late 2022 to late 2023. Anecdotally, analysts point to a recent surge in productivity as a factor that has allowed wages to grow and prices to moderate simultaneously—trends that might also raise the chances of a soft landing for the economy in 2024.3
Federal Reserve Bank of Boston
Inflation
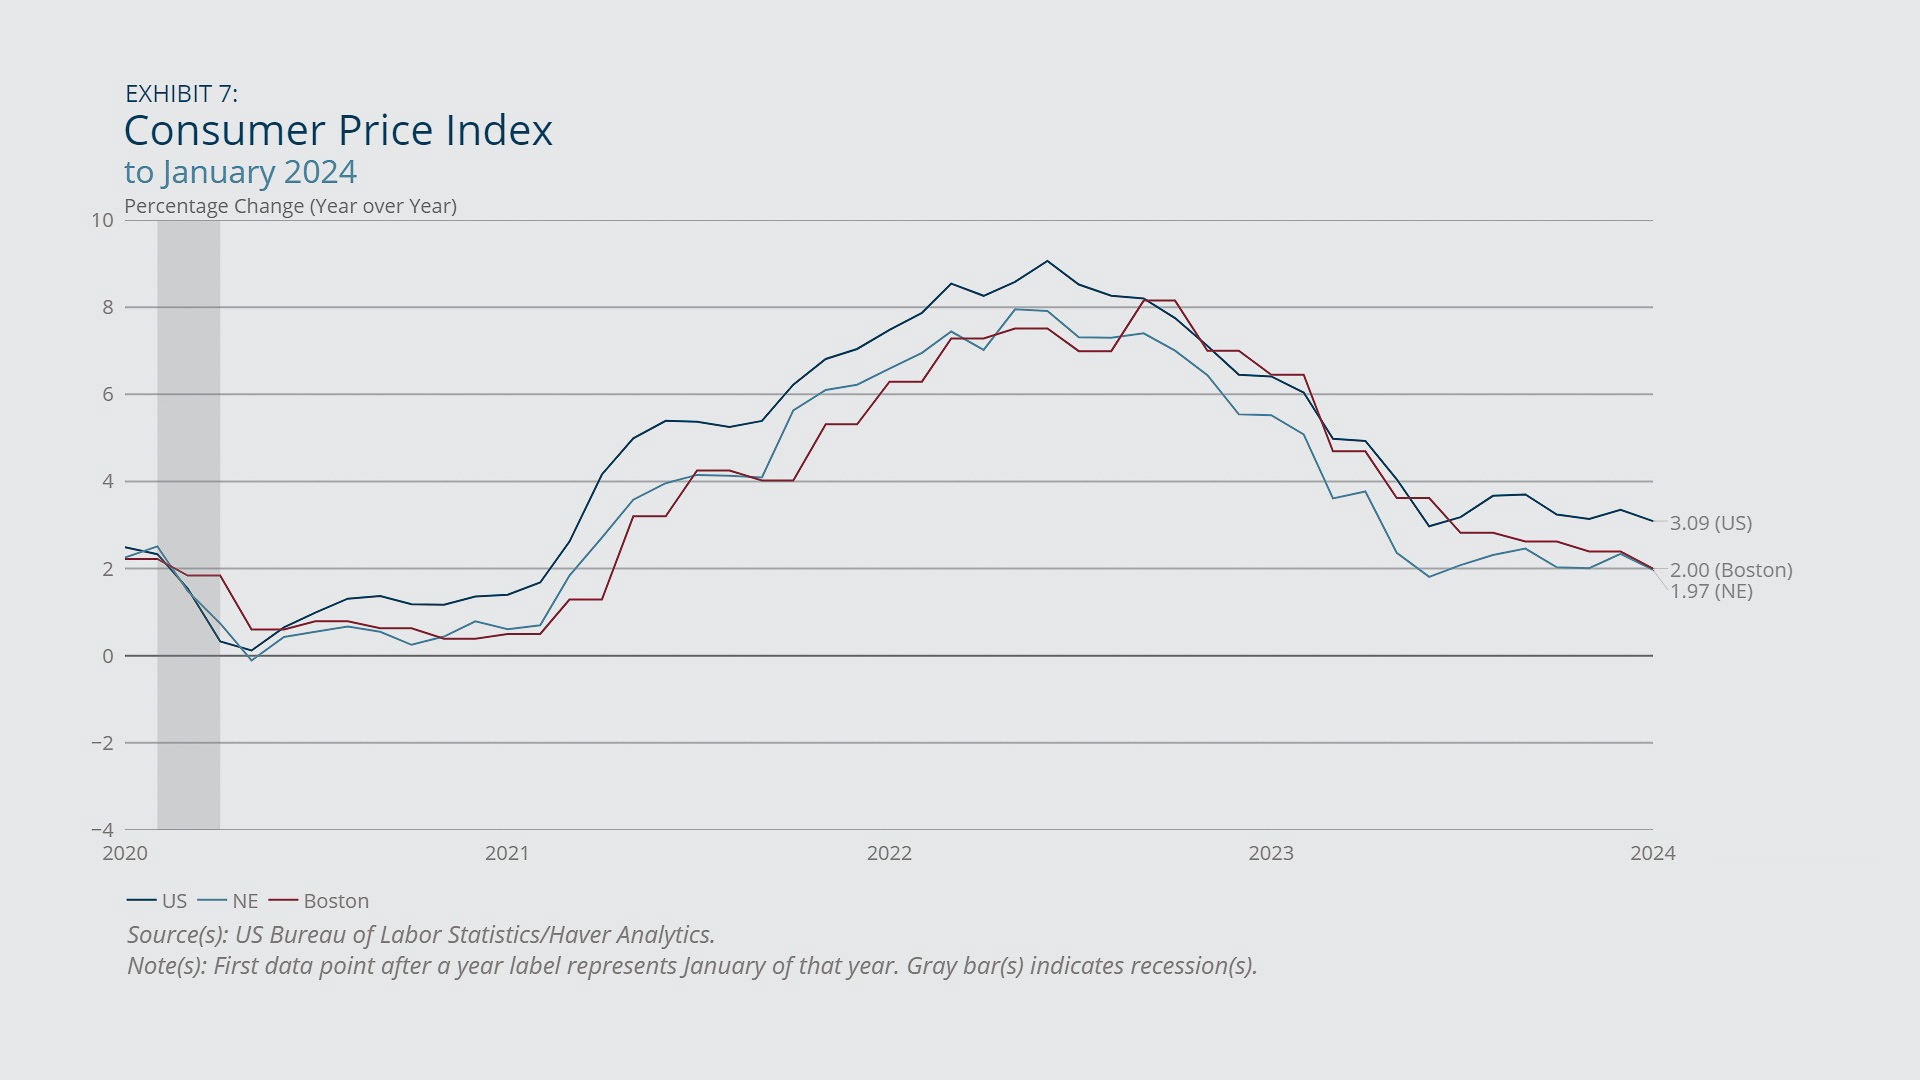
- All-items Consumer Price Index (CPI) inflation in New England (at a year-over-year pace) stayed roughly in the vicinity of 2 percent from May 2023 to January 2024 (the latest reading), marking a considerable moderation from its recent peak of nearly 8 percent observed in May 2022 (Exhibit 7).
- Inflation in the New England region has been consistently lower than in the United States as a whole since mid-2020—by about one full percentage point on average.
- Inflation in the Boston area generally has behaved very similarly to inflation for the region as a whole since mid-2020 but was closer to the US rate from September 2022 to July 2023.
One factor contributing to lower inflation in the region relative to the United States recently was the 10 percent drop in the fuel and utilities CPI component for New England from December 2022 to December 2023 (not shown). That recent moderation partly reversed an extended run-up in New England’s fuel and utilities component that lasted from mid-2021 to late 2022.4
Federal Reserve Bank of Boston
Housing Permits, Construction Contracts, and House Prices
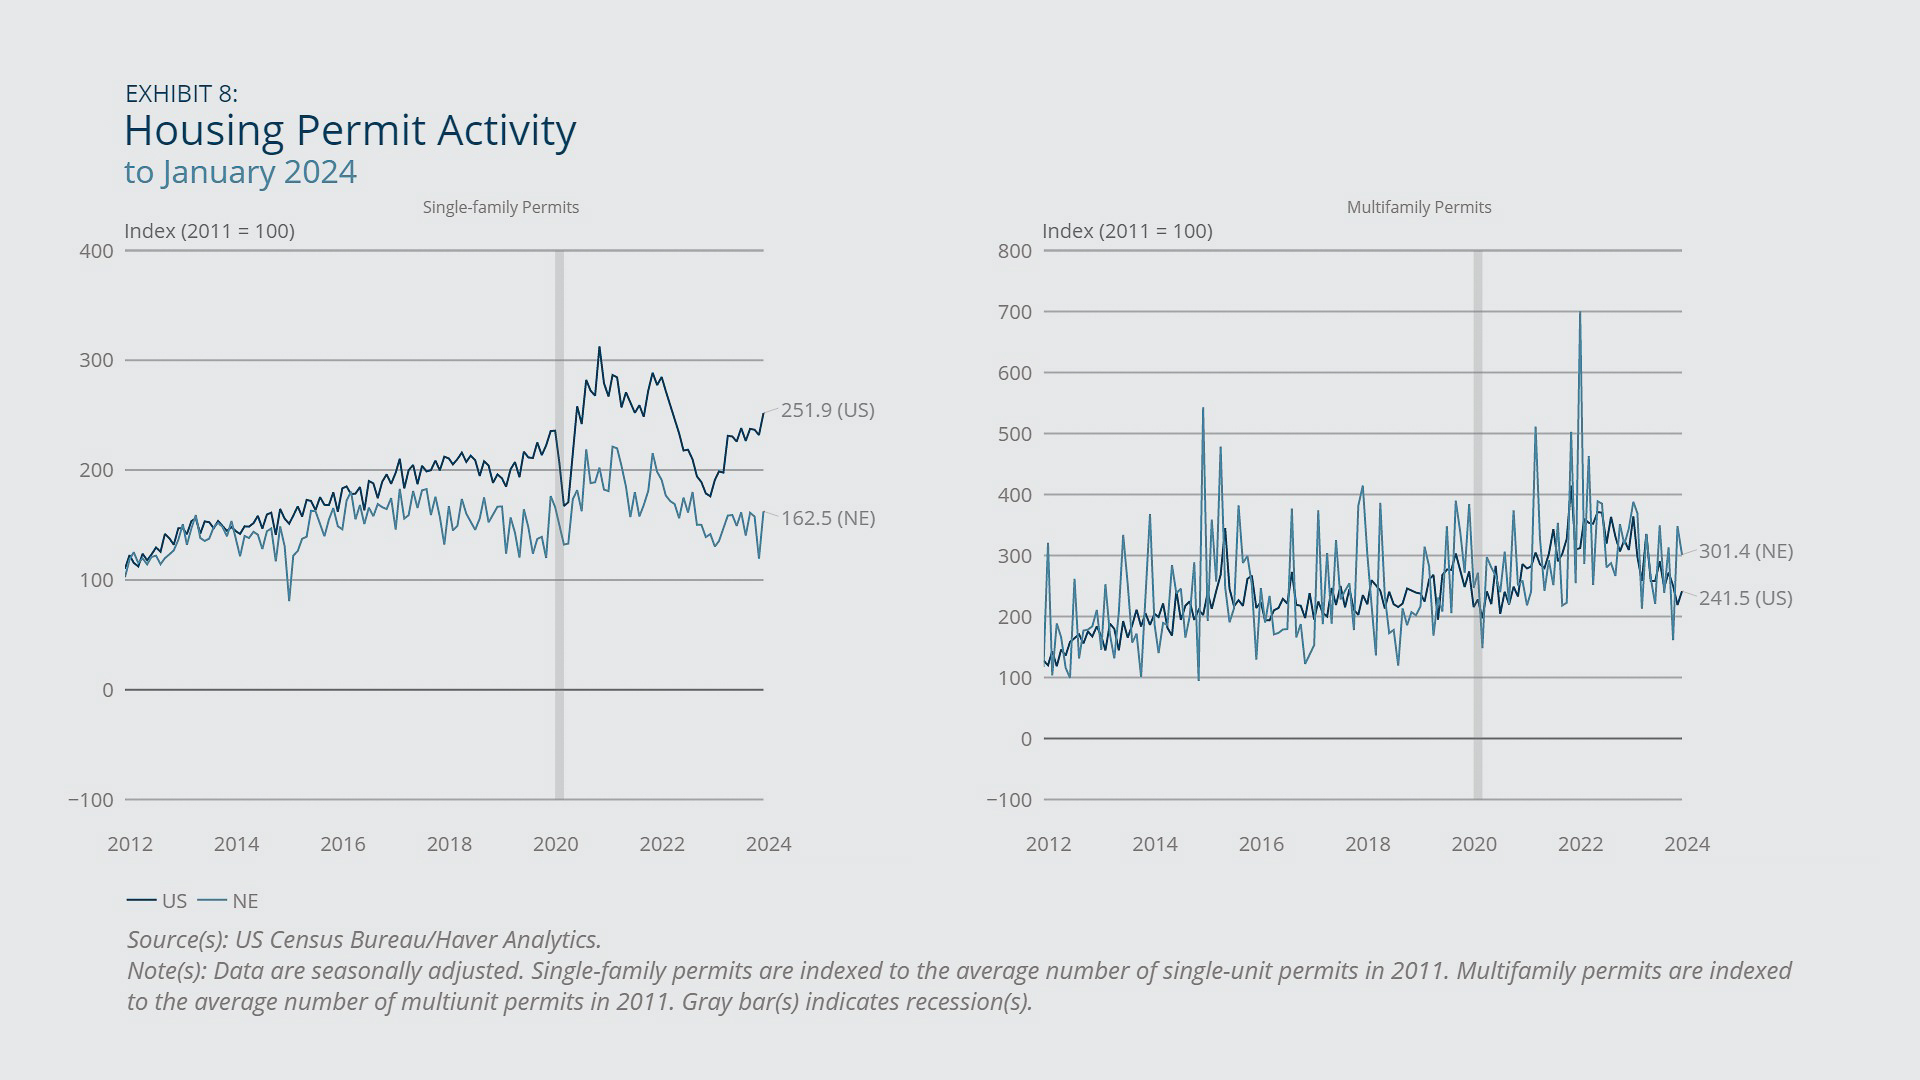
- Single-family housing permits (seasonally adjusted, indexed to 2011) in New England increased steeply in January 2024 from the previous month and were up nearly 15 percent from January 2023 (Exhibit 8, left), but they were nonetheless considerably lower compared with their 2021 and 2022 averages. In the United States, single-family permits increased at a robust 43 percent pace year-over-year for January but were also down from their 2021 and 2022 averages (Exhibit 8, left).
- Multifamily permits receded year-over-the-year for January 2024 for both New England—by 12 percent—and the United States—by 22 percent (Exhibit 8, right). On average in 2023 and January 2024, multifamily permits were down considerably in both the region and the country from their respective post-2020 highs.
- In both the region and the United States, recent growth in construction activity (measured by the value of contracts awarded) has been dominated by the nonresidential and non-building components, rather than by the residential component (Exhibit 9).
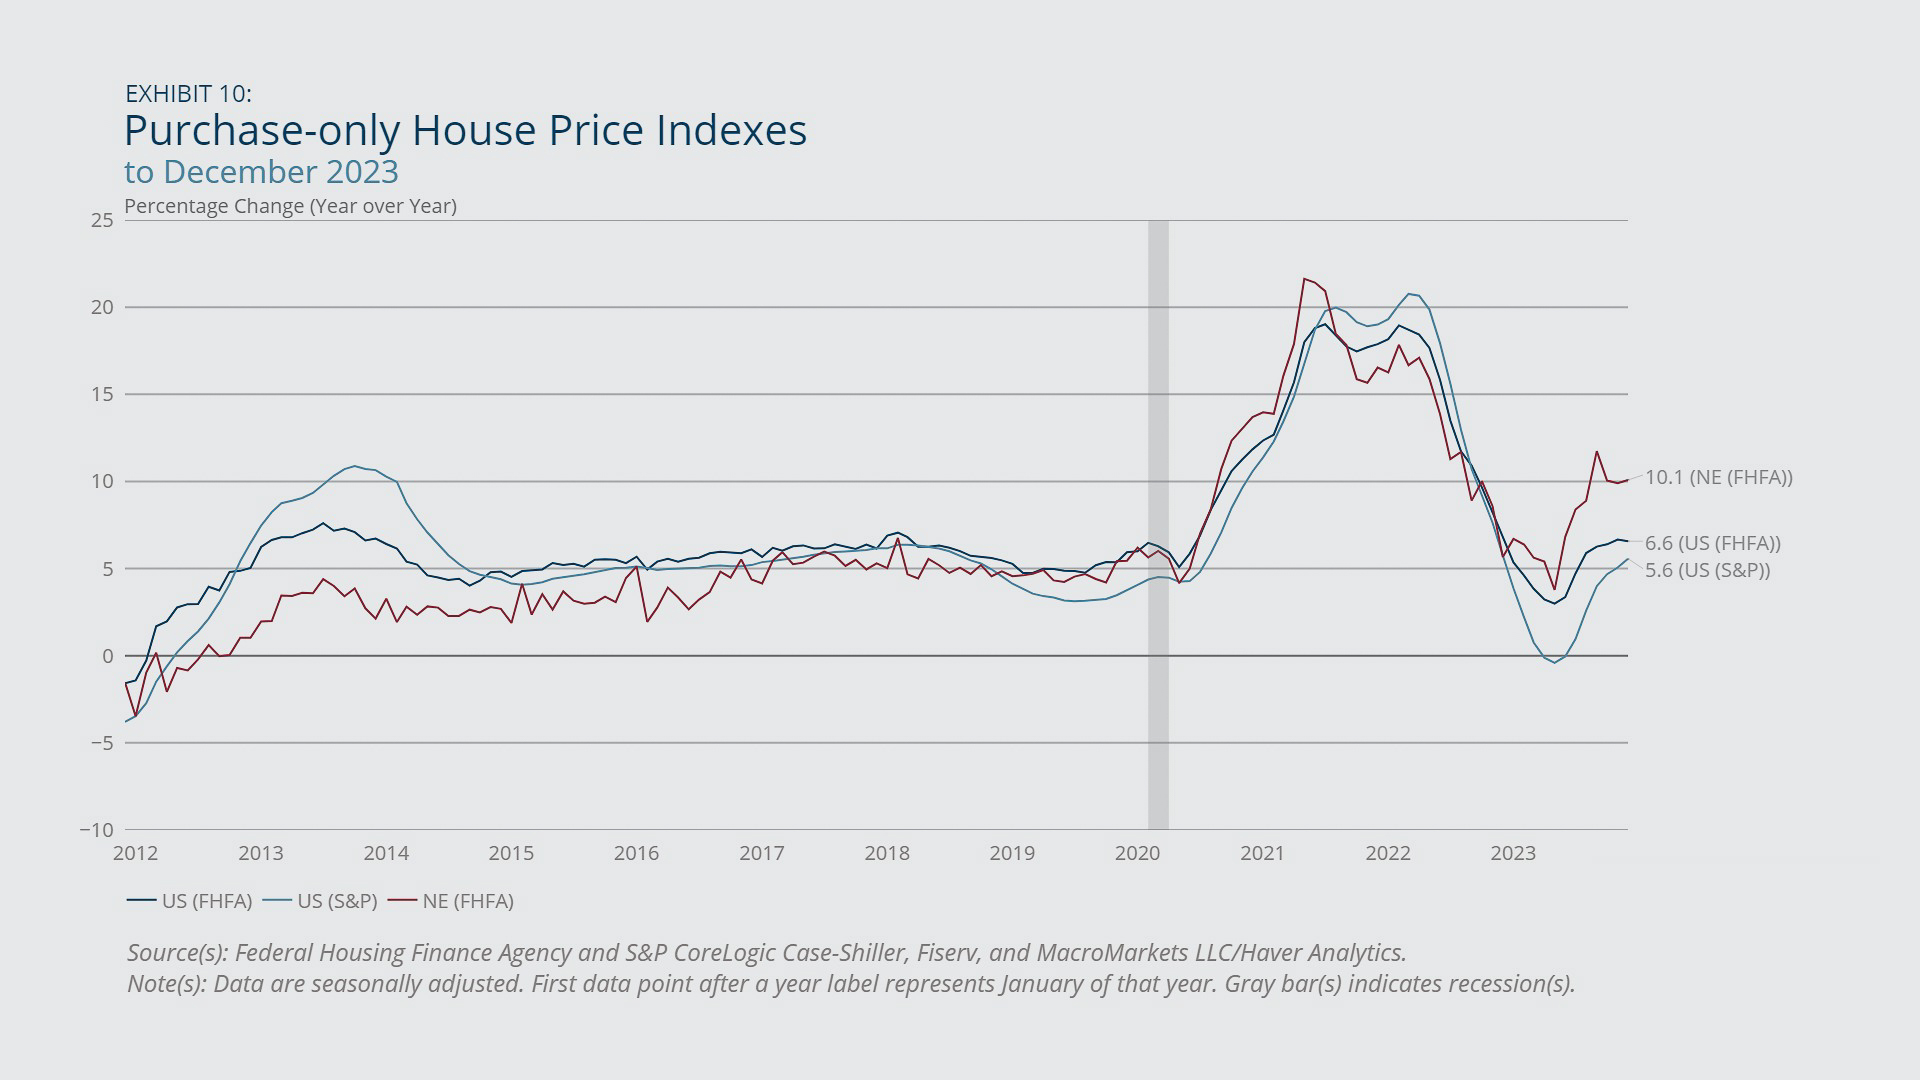
- House-price growth in New England accelerated in the second half of 2023 in terms of year-over-year rates. House-price growth in the United States as a whole also rebounded after May but nonetheless ended 2023 well behind New England’s pace, based on either of two indexes (Exhibit 10).
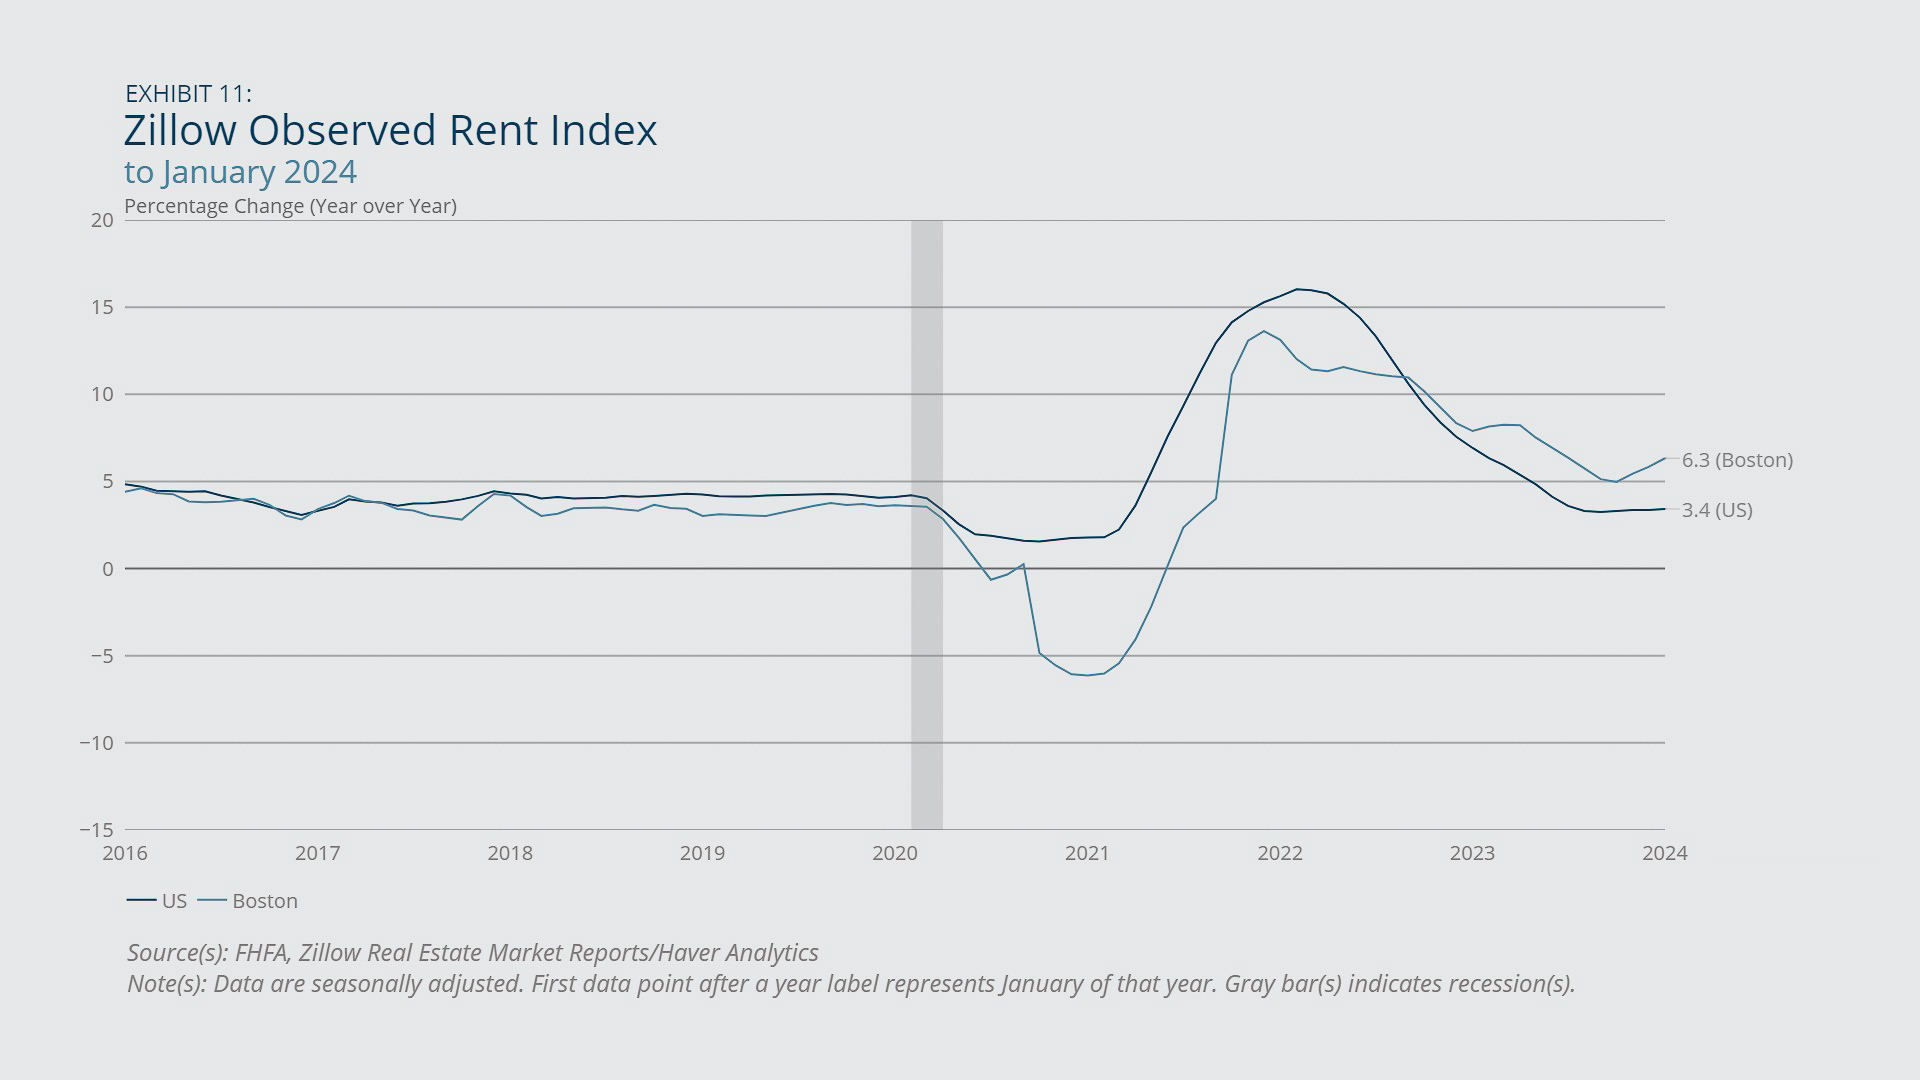
- Rent growth in the Boston area picked up again in recent months after an extended downward trend that started in late 2021, but it still remained well below its post-2020 peak (Exhibit 11). US rent growth declined from 6.9 percent in January 2023 to 3.4 percent in January 2024.
Recent residential permits data—for single-family and multifamily dwellings in both New England and the United States—show a return to roughly pre-pandemic norms after the numbers spiked to historically high levels in 2021 and 2022. Examining the value of construction contracts in New England (rather than the number of permits) reveals that both the residential and nonresidential components were roughly flat year-over-the-year for January 2024, but the non-building component increased 34 percent (Exhibit 9). In the United States, the residential and nonresidential components were down considerably from one year earlier, and the non-building component—although about flat since September 2023—was up almost 17 percent from a year earlier. In the region and throughout the country, the non-building component of construction is being supported by spending from the Infrastructure Investment and Jobs Act of 2021.5
According to First District Beige Book contacts, the recent acceleration in house prices stems from a dearth of inventories combined with fairly healthy buyer demand.6 The relatively tepid residential permitting activity in the region may bode poorly for relief in house-price growth and rent growth despite recent efforts from policymakers in Massachusetts to increase the supply of multifamily housing in that state via the MBTA Communities Act.7
Federal Reserve Bank of Boston
Federal Reserve Bank of Boston
Federal Reserve Bank of Boston
Federal Reserve Bank of Boston
Consumer Confidence
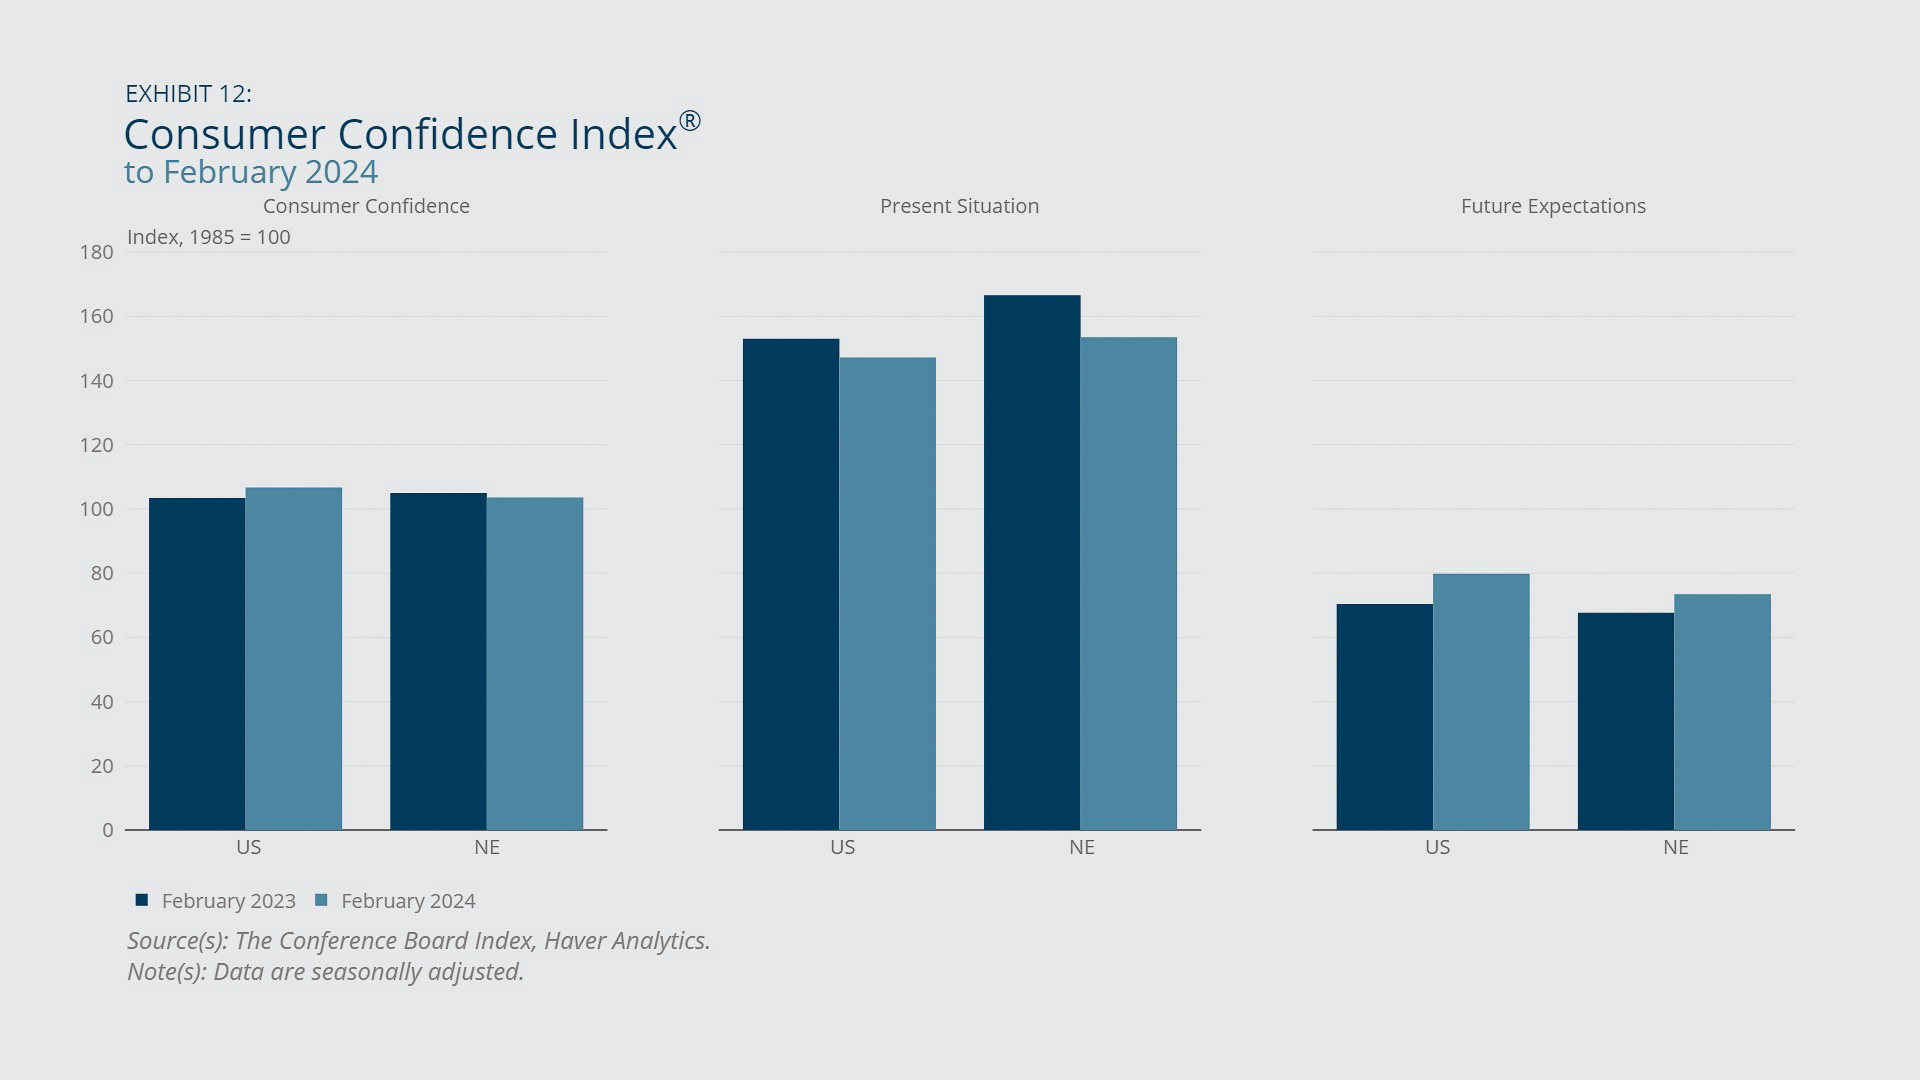
- Consumer confidence in New England in February 2024 was down slightly from one year earlier, while confidence increased by a small margin for the United States for the same period. Both series fell by slight margins from January 2024.
- The latest movements left the regional value, at 103.6, slightly below the US reading of 106.7, even though the two series have tracked each other quite closely since 2021.
- For both the region and the United States, the Present Situation Index was down moderately from one year earlier, while the Expectations Index improved by small (New England) to moderate (US) margins. Nonetheless, the Expectations Index for New England was down significantly from November 2023 and qualified as pessimistic.
The latest overall confidence reading for New England falls well short of the post-2020 peak reading of 129 (from November 2021). Net of fluctuations, the region’s overall confidence measure has trended about flat since April 2022, and the same can be said for the US measure. The latest Expectations Index measure of 73.4 for New England suggests that the region’s consumers are pessimistic about the direction of the economy, as the Conference Board remarked in its latest press conference that “an Expectations Index reading below 80 often signals recession ahead.”8 The latest US Expectations Index was just barely below 80, at 79.8.
Federal Reserve Bank of Boston

 About the Authors
Mary A. Burke,
Federal Reserve Bank of Boston
Email: Mary.Burke@bos.frb.org
Acknowledgments
Gregory Longfield, Federal Reserve Bank of Boston
Tanner Thering, Federal Reserve Bank of Boston
Endnotes
- According to the First District Beige Book report from November 2023, "Restaurant industry contacts said that labor supply increased modestly further, with the exception that managers remained scarce." Accessed March 4, 2024, at https://www.bostonfed.org/news-and-events/news/2023/11/beige-book-boston-fed-first-district-november-29-2023-business-activity-flat-labor-demand-eases.aspx.
- The US Bureau of Labor Statistics (BLS) deflates the nominal Employment Cost Index (ECI) for the United States using the national Consumer Price Index for All Urban Consumers (CPI-U) and deflates the nominal ECI for New England using the Northeast CPI-U. Real ECI growth rates are then calculated using the deflated index values. Note that the CPI-U for New England is not used, as it originated only in December 2017. For more information, see https://www.bls.gov/eci/factsheets/eci-constant-dollar-factsheet.htm accessed March 4, 2024.
- See Associated Press, "Productivity Surge Helps Explain US Economy's Surprising Resilience," Voice of America, February 25, 2024, https://www.voanews.com/a/productivity-surge-helps-explain-us-economy-s-surprising-resilience-/7496538.html.
- Based on the available (not seasonally adjusted) data, the run-up in New England's fuel and utilities component from mid-2021 through late 2022 was much more pronounced than the upswing in the same component for the United States during the same period.
- See Julie Strupp, “2 Years in, Infrastructure Law Has Funded 40,000 Projects,” Construction Dive, November 16, 2023, https://www.constructiondive.com/news/infrastructure-law-progress-year-two/699961/.
- According to the First District Beige Book report from January 2024, “Median sales prices increased moderately on a year-over-year basis in all reporting states, a development attributed to persistent scarcity of supply and significant pent-up demand…[I]nventories remained historically low.” Accessed March 4, 2024, at https://www.bostonfed.org/news-and-events/news/2024/01/beige-book-boston-fed-first-district-january-17-2024-business-activity-down-outlook-optimistic.aspx.
- See ”Multi-family Zoning Requirements for MBTA Communities,” Mass.gov website, https://www.mass.gov/info-details/multi-family-zoning-requirement-for-mbta-communities, accessed March 4, 2024.
- See ”Multi-family Zoning Requirements for MBTA Communities,” Mass.gov website, https://www.mass.gov/info-details/multi-family-zoning-requirement-for-mbta-communities, accessed March 4, 2024.
Resources
Site Topics
Keywords
- Regional economy ,
- Economic Conditions ,
- New England