Q2 2016: Snapshot of the New England Economy through June 30, 2016 
Default Title
Default Title


Most indicators suggest continued growth in New England
New England economic activity in the second quarter of 2016 continued to improve year-over-year, but at a slower rate than seen in previous quarters. Despite a small month-to-month reduction in New England jobs in May 2016, the unemployment rate in the region remained at 4.4 percent, which is a 0.6 percentage point drop since May 2015. Between May 2015 and May 2016 the construction sector experienced the strongest job growth in New England. Other economic indicators, such as housing prices, continued to post increases.
Employment
New England job growth continues, but at a slower pace
The United States and New England have both experienced moderate payroll employment growth year-over-year. Between May of 2015 and May of 2016, all six New England states experienced job growth ranging from 1.5 percent growth in Massachusetts to about 0.25 percent growth in Rhode Island. However, all six New England states lagged behind the national pace of job gains of 1.7 percent.
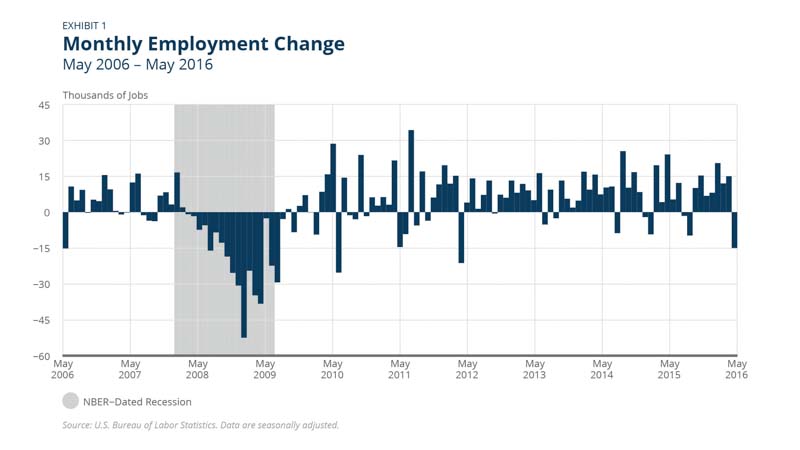
In May 2016, the month-to-month job growth slowed nationally, and shrank modestly in New England. About 15,000 fewer people were employed in May 2016 than in April 2016 in New England, which is counter to recent trends (Exhibit 1).

Job growth in New England shrank in May 2016
About 15,000 fewer people were employed in May 2016 than in April 2016 in New England, which is counter to recent trends Peter Davis/Federal Reserve Bank of Boston
Employment by Industry
Construction leads regional job growth
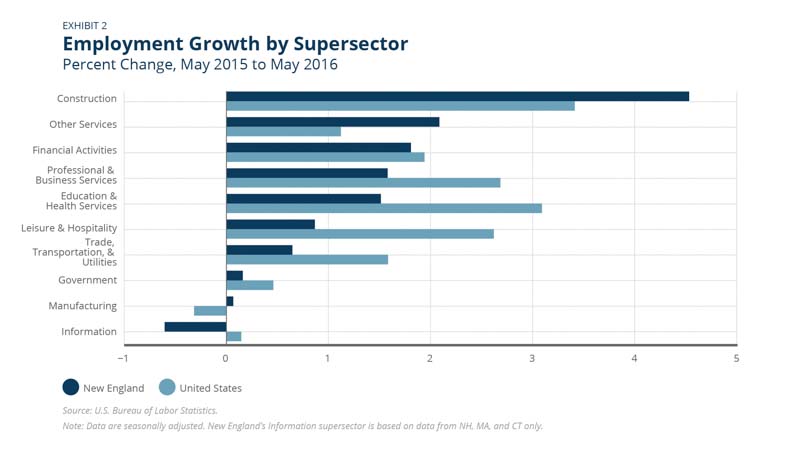
New England and the United States experienced considerable variation in job growth across supersectors (Exhibit 2). Nine of the ten supersectors recorded year-over-year job gains in the region in May 2016 with the exception of the Information supersector. The fastest growing sector in New England over this time period was Construction, increasing 4.6 percent and exceeding the 3.4 percent growth this sector experienced nationally. Employment in the Manufacturing sector declined nationally, but it increased modestly year-over-year in New England.
Construction leads regional job growth
New England and the United States experienced considerable variation in job growth across supersectors. Nine of the ten supersectors recorded year-over-year job gains in the region in May 2016 with the exception of the Information supersector. Peter Davis/Federal Reserve Bank of Boston
Unemployment
The regional unemployment rate continues to decline
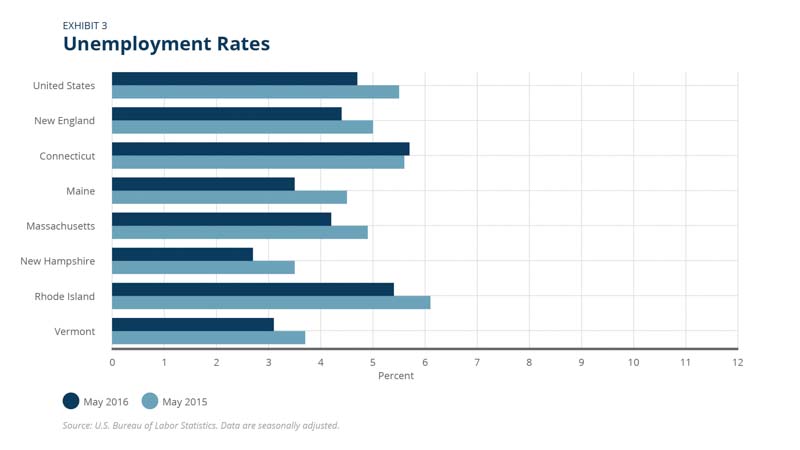
Five of the six New England states continued to see unemployment rates decline between May 2015 and May 2016. The exception was Connecticut, which saw a 0.1 percentage point increase to 5.7 percent (Exhibit 3). Over this period the region’s unemployment rate dropped 0.6 percentage points and as of May 2016 was at 4.4 percent. Over the last year, Connecticut has replaced Rhode Island as the state with the highest unemployment rate in the region, and these two states remained the only ones in New England with a rate above the national rate. New Hampshire retained its position as the state in the region with the lowest unemployment rate (2.7 percent) despite a 0.1 percentage point increase from April 2016 to May 2016.
The regional unemployment rate continues to decline
Five of the six New England states continued to see unemployment rates decline between May 2015 and May 2016. The exception was Connecticut, which saw a 0.1 percentage point increase to 5.7 percent. Peter Davis/Federal Reserve Bank of Boston
Wages and Income
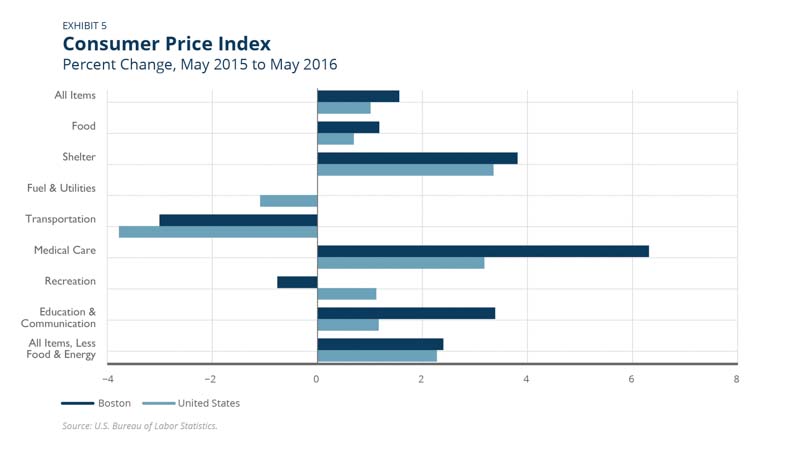
Consumer price increases remain modest
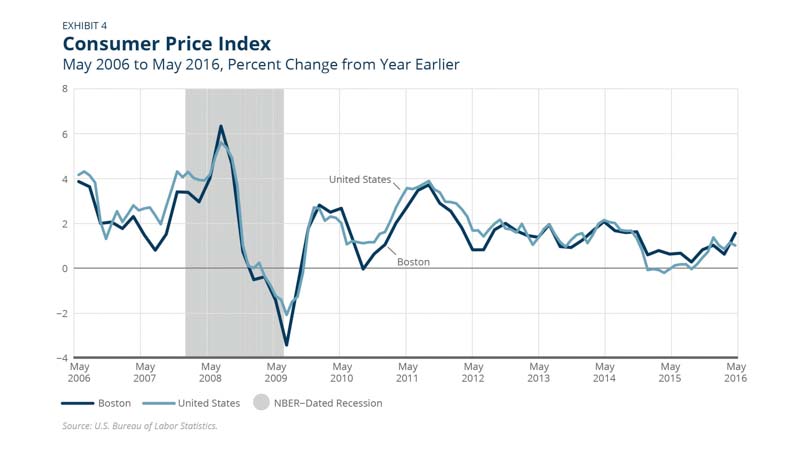
Year-over-year consumer prices remained low in both the nation and Boston through May 2016. Boston’s price increases (1.7 percent) outpaced national increases (1 percent) (Exhibit 4). In the Boston area, price inflation outpaced the national growth in every category except recreation costs (Exhibit 5), which saw a decline. Transportation costs in Boston were down over 3 percent year-over-year largely due to low energy prices.
Consumer price increases remain modest
Year-over-year consumer prices remained low in both the nation and Boston through May 2016. Boston’s price increases (1.7 percent) outpaced national increases (1 percent) Peter Davis/Federal Reserve Bank of Boston
Consumer price increases remain modest
In the Boston area, price inflation outpaced the national growth in every category except recreation costs, which saw a decline. Peter Davis/Federal Reserve Bank of Boston
Home Prices
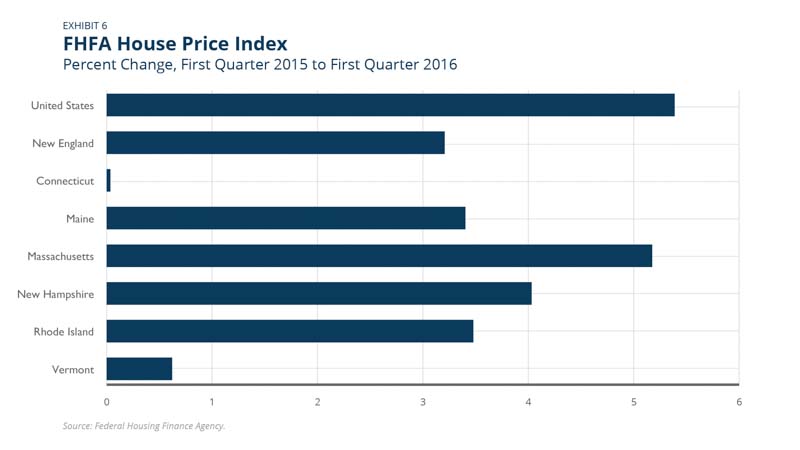
Massachusetts records fastest house price growth in the region
Home prices continued to grow both nationally and regionally, with national growth rates continuing to exceed regional rates. Between Q1 2015 and Q1 2016, home prices increased 5.5 percent nationally and 3.4 percent regionally. Five of the six New England states reported positive house price growth year-over-year, but these home price gains all trailed the national rate. Massachusetts led regional home price gains, up 5.4 percent through Q1 2016 (Exhibit 6). House price growth in Connecticut was flat over the period considered.
Massachusetts records fastest house price growth in the region
Massachusetts led regional home price gains, up 5.4 percent through Q1 2016. Peter Davis/Federal Reserve Bank of Boston

 About the Authors
Riley Sullivan,
Federal Reserve Bank of Boston
Riley Sullivan is a senior policy analyst with the New England Public Policy Center in the Federal Reserve Bank of Boston Research Department.
Email: riley.sullivan@bos.frb.org