Cutting through the Noise: A Fresh Look at Trimmed Mean PCE Inflation 


Federal Reserve Bank of Boston

The views expressed herein are solely those of the authors and should not be reported as representing the views of the Federal Reserve Bank of Boston, the principals of the Board of Governors, or the Federal Reserve System.
Core personal consumption expenditures (PCE) inflation, a measure capturing the underlying trend in the Federal Reserve’s preferred price index, was 3.1 percent year-over-year in September 2026. Core inflation, as opposed to headline inflation, excludes food and energy prices, which tend to be volatile. By omitting such noisy data, core inflation can better reflect underlying price pressures.
Another approach to reducing noise involves the trimmed mean, which filters extreme price changes—the largest and the smallest—from inflation data. The most widely used PCE trimmed mean inflation estimate comes from the Federal Reserve Bank of Dallas (Dolmas 2005; Dolmas and Koenig 2009). It was 2.3 percent year-over-year for September 2026, the most recent month for which the measure was available when this brief was written.
Sign up for Research Department Updates.
Generally, trimmed mean PCE inflation is computed using the month-over-month inflation rates across all the goods and services categories that comprise the PCE price index. First, those categories are ordered from lowest to highest according to their inflation rates—that is, the size of their price changes that month—and then this distribution is trimmed, at both the top and the bottom. In practice, this means that categories with volatile prices are often, but not always, excluded.
The Dallas Fed approach trims the bottom 24 percent and the top 31 percent of the price-change distribution. It then calculates the weighted mean of the remaining price changes.1 The Dallas Fed’s trim points (the bottom 24th and top 31st percentiles) are based on inflation data covering the period of 1977 to 2009, which is the year the bank last updated this methodology. Trim points are selected so that the PCE inflation estimates align with trend inflation, which measures the long-term underlying rate of inflation around which shorter-term rates, including year-over-year, fluctuate.
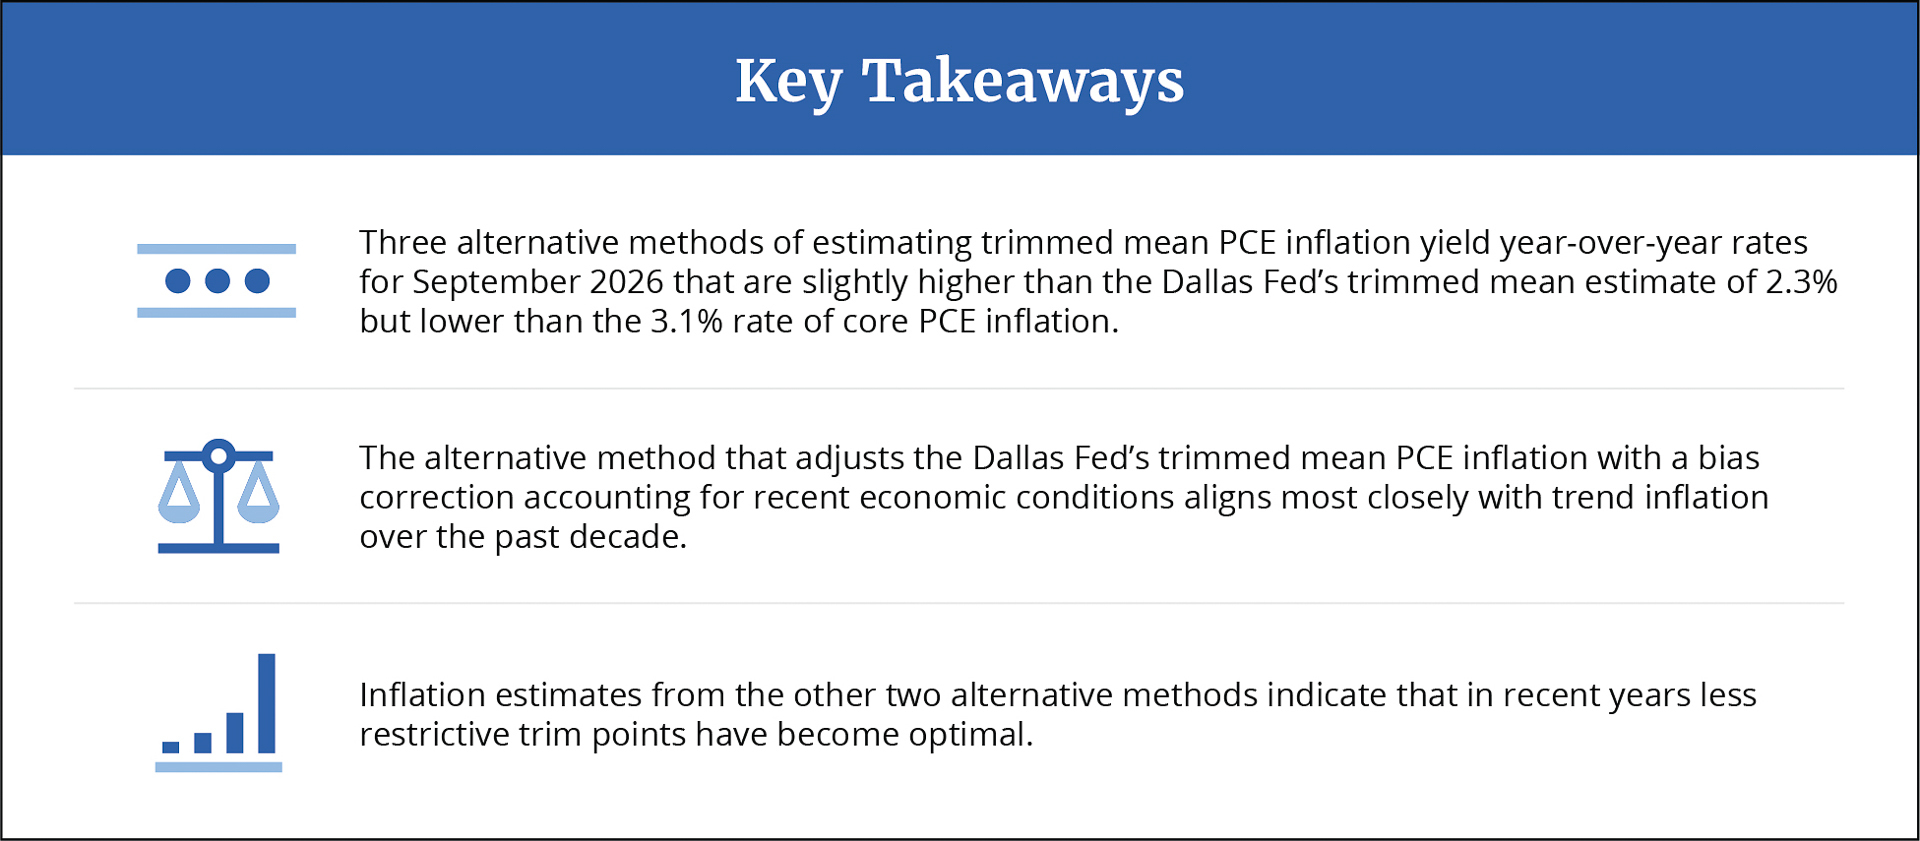
In this brief, we present three alternative measures of trimmed mean PCE inflation: (1) a bias-adjusted measure that applies a bias correction to the Dallas Fed trimmed mean PCE inflation rate based on current economic conditions; (2) an extended measure that sets the trim points for the September 2026 reading using inflation data from our full, nearly 50-year sample period; and (3) a 10-year measure that sets the trim points for the latest reading using data from the last 10 years. Our alternative estimates of year-over-year trimmed mean PCE inflation for September 2026 range from 2.3 percent to 2.5 percent and are slightly higher than the Dallas measure but lower than core PCE inflation.2
Core PCE Inflation Recently Has Diverged from Alternative and Dallas Fed Measures
For our alternative estimates, we construct a data set of monthly price data from February 1977 to September 2026 and a distribution of 201 mutually exclusive PCE categories that are available across the sample period. We construct each of our alternative measures by modeling its performance against trend inflation. We define trend inflation as the 36-month centered moving average of headline PCE inflation (which includes food and energy prices); that is, for any point in time, we estimate trend inflation as the average of all monthly headline inflation rates from 18 months before through 18 months after that point in time.3 Since trend inflation requires 18 months of data before and after, we model the performance of each measure using inflation data from August 1978 to March 2025, but we are able to apply each model to the latest data and obtain estimates up to September 2026.
We compute our bias-adjusted estimate by using business-cycle indicators and percentiles of the price-change distribution to model the gap between the Dallas Fed’s trimmed mean PCE inflation measure and trend inflation, then we subtract the estimated gap from the Dallas Fed’s measure.4 This adjustment corrects for the divergence of the Dallas Fed’s measure from trend inflation without relying on forward-looking data, allowing us to apply the bias correction to the latest PCE release. This builds on the insight in Rich, Verbrugge, and Zaman (2022), who show that when the price-change distribution is positively skewed—that is, the data include a larger than usual share of sizable price increases—the Dallas Fed method yields an estimate of trimmed mean PCE inflation that falls below trend inflation.
For our extended measure, we construct a model to determine the optimal trim points for the September 2026 inflation estimate using data from August 1978 to March 2025. We compute what inflation would be when measured with every possible set of trim points and select the set that minimizes the divergence from trend inflation. The Dallas Fed method is similar, but it always uses inflation data from 1977 to 2009.5
To compute the 10-year measure for September 2026, we follow an approach similar to our extended-measure method, except that the model determining the optimal trim points uses data from January 2016 to March 2025.
Federal Reserve Bank of Boston
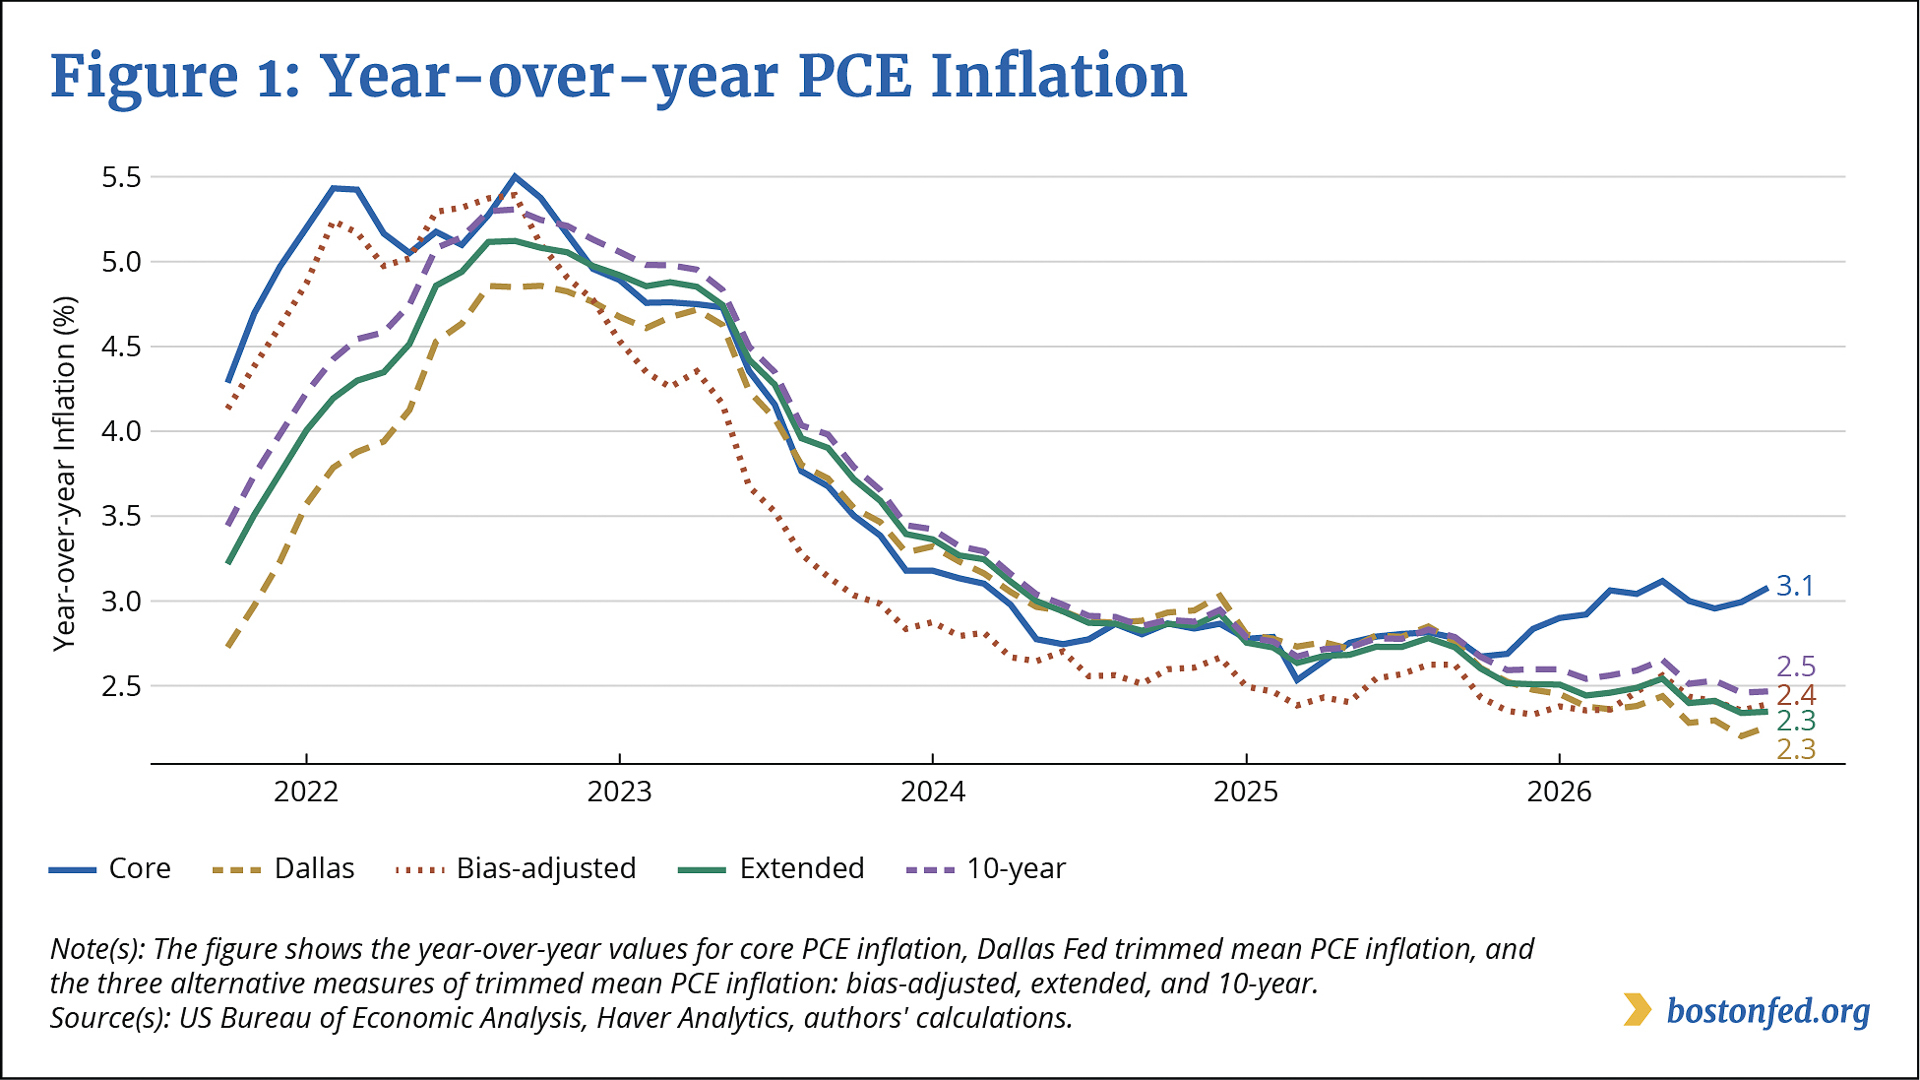
Figure 1 displays the year-over-year core PCE inflation rate, the Dallas Fed trimmed mean PCE inflation rate, and the rates yielded by our three alternative methods for estimating trimmed mean PCE inflation. As the figure shows, core PCE inflation has clearly diverged from the Dallas Fed trimmed mean PCE inflation measure in 2026; the former has increased, and the latter has declined. In the first half of the year, our extended and 10-year estimates of PCE inflation remained relatively constant, and our bias-adjusted estimate increased. However, in recent months, each of our trimmed mean measures, like the Dallas Fed measure, declined. The most recent (September 2026) year-over-year readings were 2.3 percent for the extended measure, 2.4 percent for the bias-adjusted measure, and 2.5 percent for the 10-year measure.
One critique of the Dallas Fed trimmed mean PCE inflation measure is that it remained relatively low during the post-pandemic inflation surge. By comparison, our estimates for that period come closer to matching the large rise in core PCE inflation. Our extended and 10-year measures for the subsequent period of moderation (late 2022 through 2025) closely track both the Dallas measure and core PCE inflation, while our bias-adjusted measure runs below both.
After Adjustment, Trimmed Mean Inflation Aligns Closer with Trend Inflation
We compare how well the different inflation measures align with underlying trend inflation. In particular, we conduct an out-of-sample exercise in which we obtain the optimal trim points (those that yield estimates closest to trend inflation) for a given year using data covering a period that ends with the preceding year. For example, when we make the comparisons for 2018, we use data through 2017 to model the gap for the bias-adjusted measure and to determine the optimal trim points for the extended and 10-year measures. Because our trend inflation measure requires 18 months of future data, we make these comparisons for 2016 through March 2025.
Federal Reserve Bank of Boston
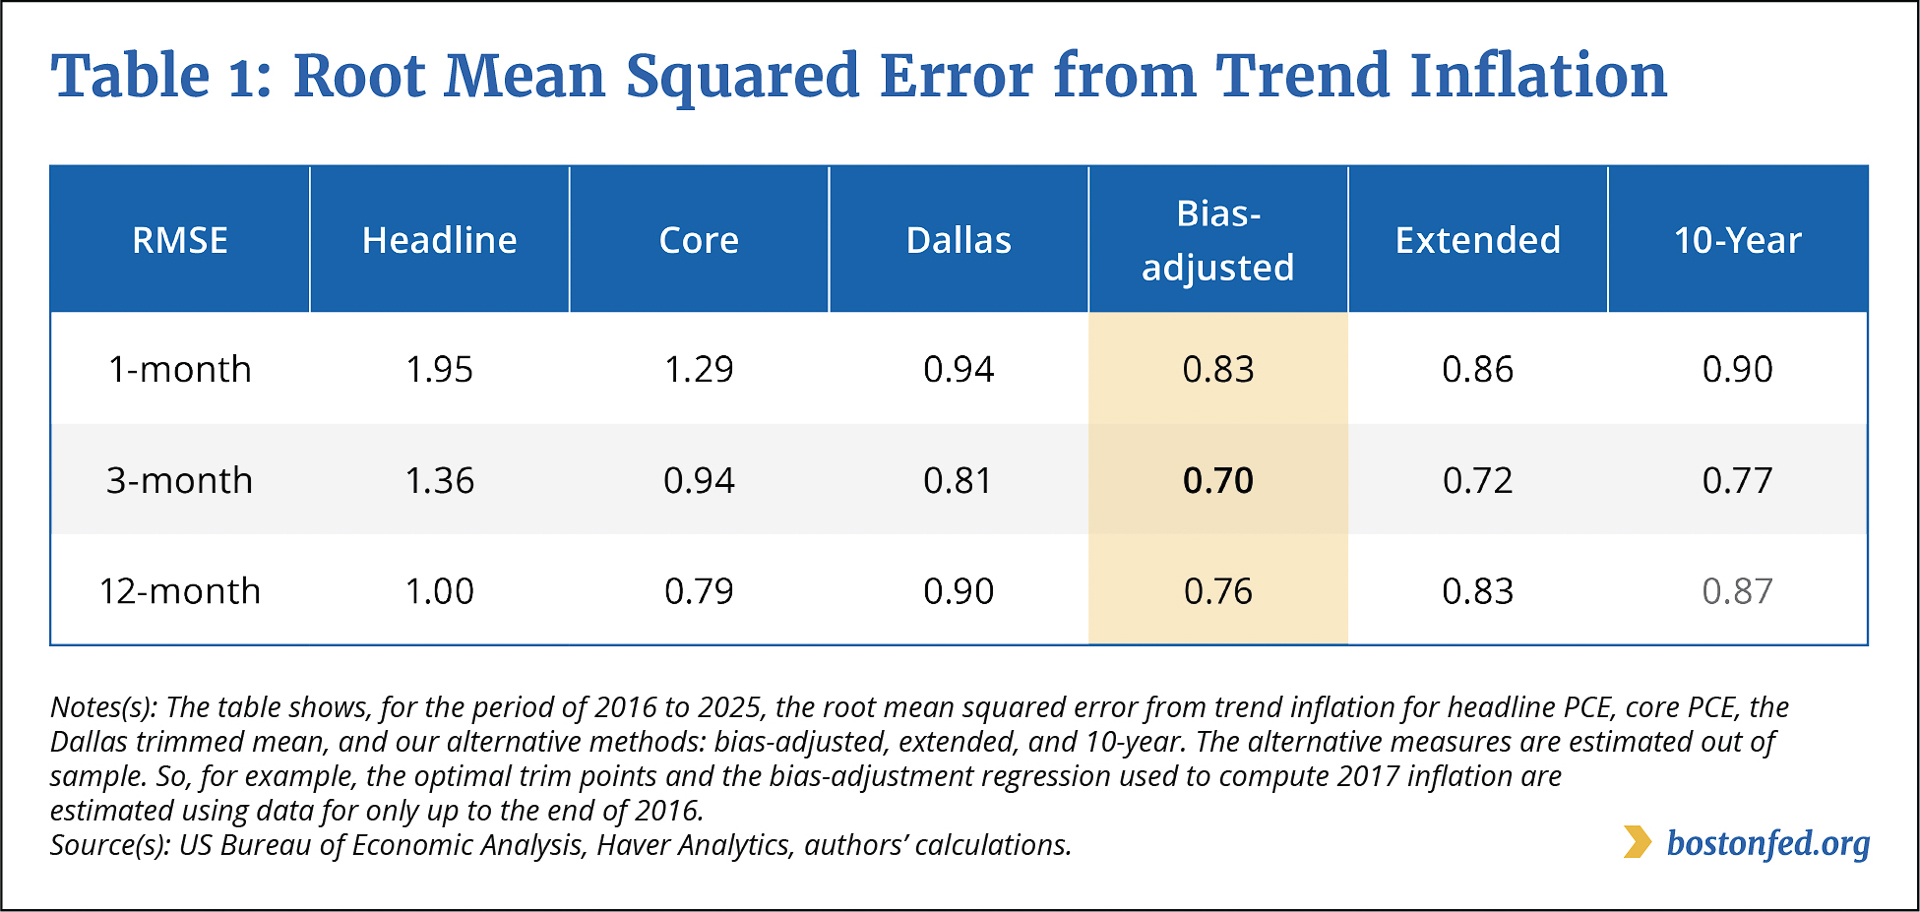
Table 1 shows the root mean squared error (RMSE), which quantifies the average deviation of each inflation measure from trend inflation. We consider one-month, three-month, and 12-month inflation for each estimation method. Compared with headline and core PCE inflation, each of the four trimmed mean measures (columns 3 through 6 in the table) is more closely aligned with trend inflation at the one-month and three-month horizons, as indicated by their lower RMSE values. This result is to be expected, because at those horizons, extreme price changes, which the trimming process removes, can have an outsized effect on average inflation.
For each horizon, the bias-adjusted estimate (highlighted in yellow in the table) aligns closest with trend inflation, and of all the methods, the three-month bias-adjusted method yields the estimates most closely aligned with trend inflation, as indicated by the RMSE value of 0.70, the smallest value.
Federal Reserve Bank of Boston
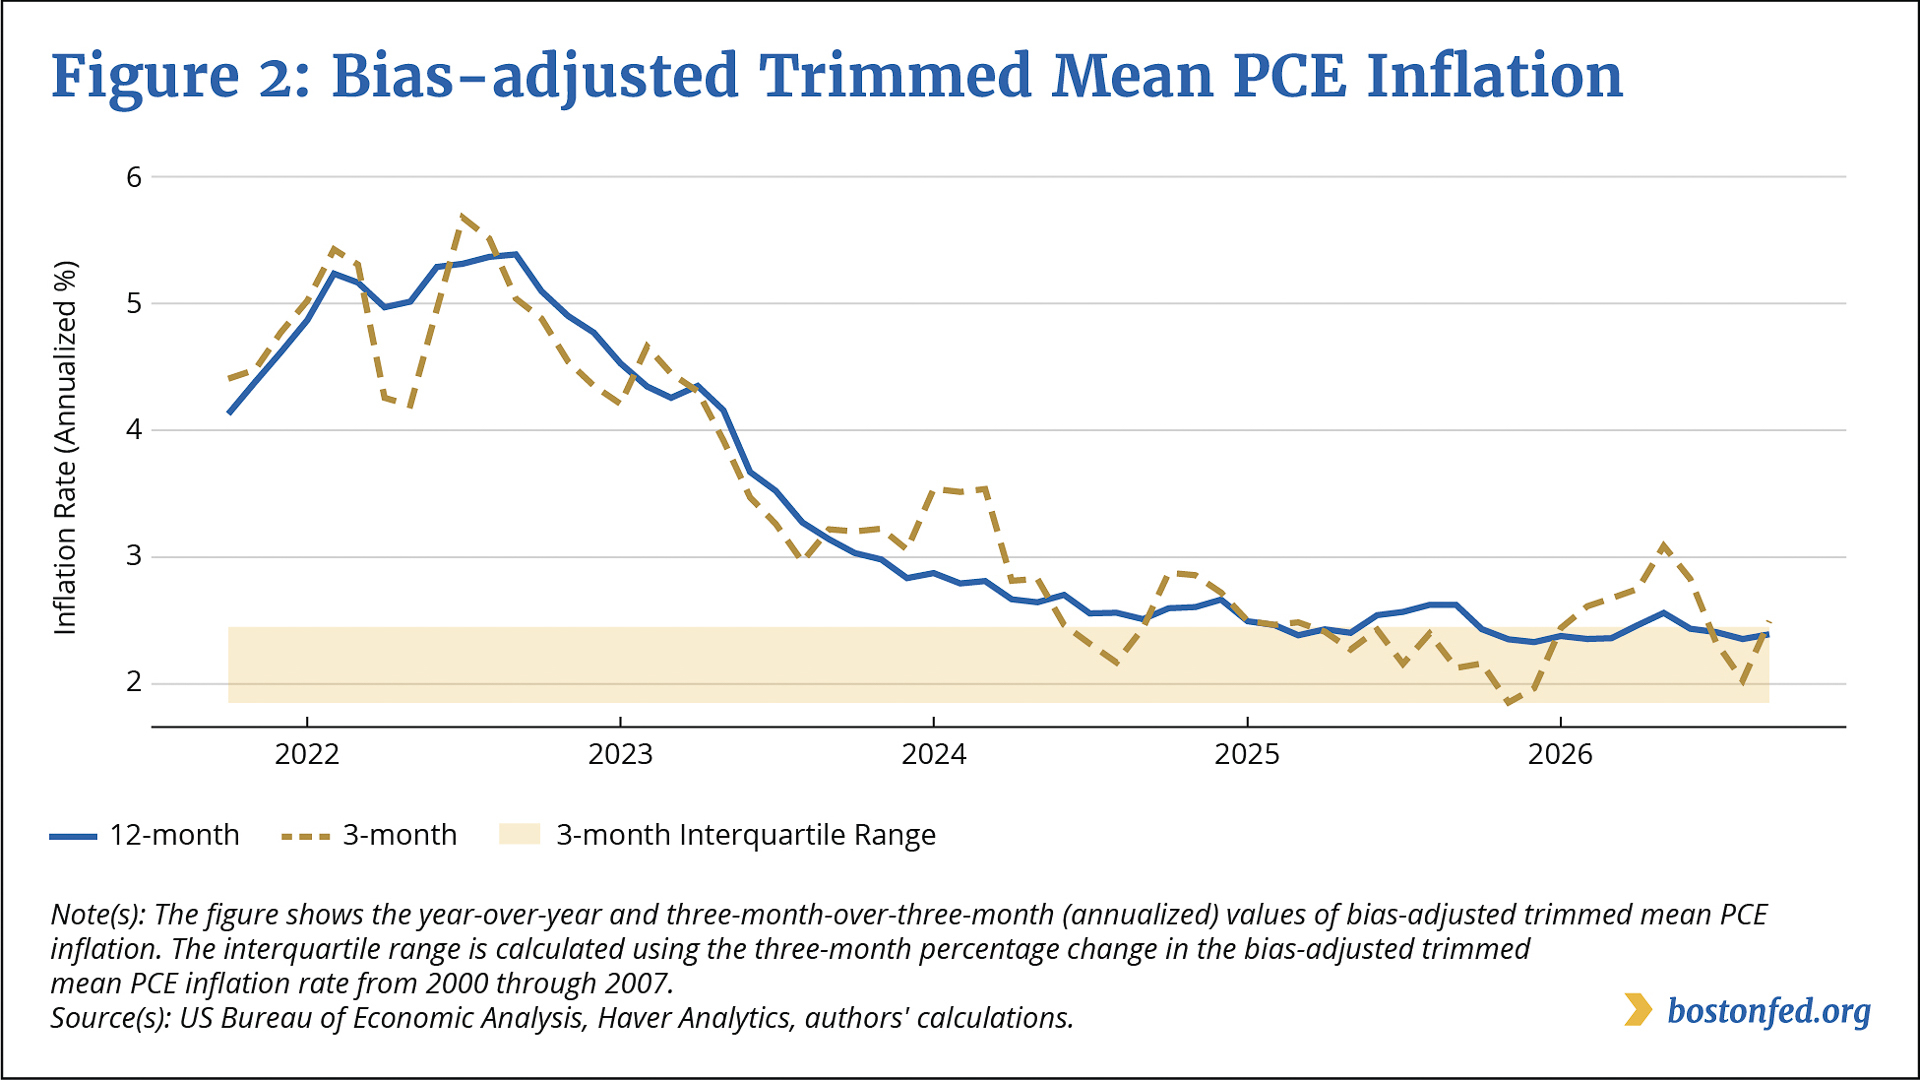
Figure 2 shows the evolution of the three-month bias-adjusted measure—the overall optimal measure—from October 2021 to September 2026. It also shows the evolution of the 12-month bias-adjusted measure and the typical (interquartile) range of the three-month bias-adjusted measure over the 2000–2007 period, when inflation was relatively stable. In early 2026, the three-month bias-adjusted measure rose above its standard range—the first time that had occurred since late 2024—and over the first half of the year, it remained above that range. The measure fell back into its standard range in July and August 2026 before exceeding it once again in the most recent release.
Optimal Trim Points May Have Become Less Restrictive
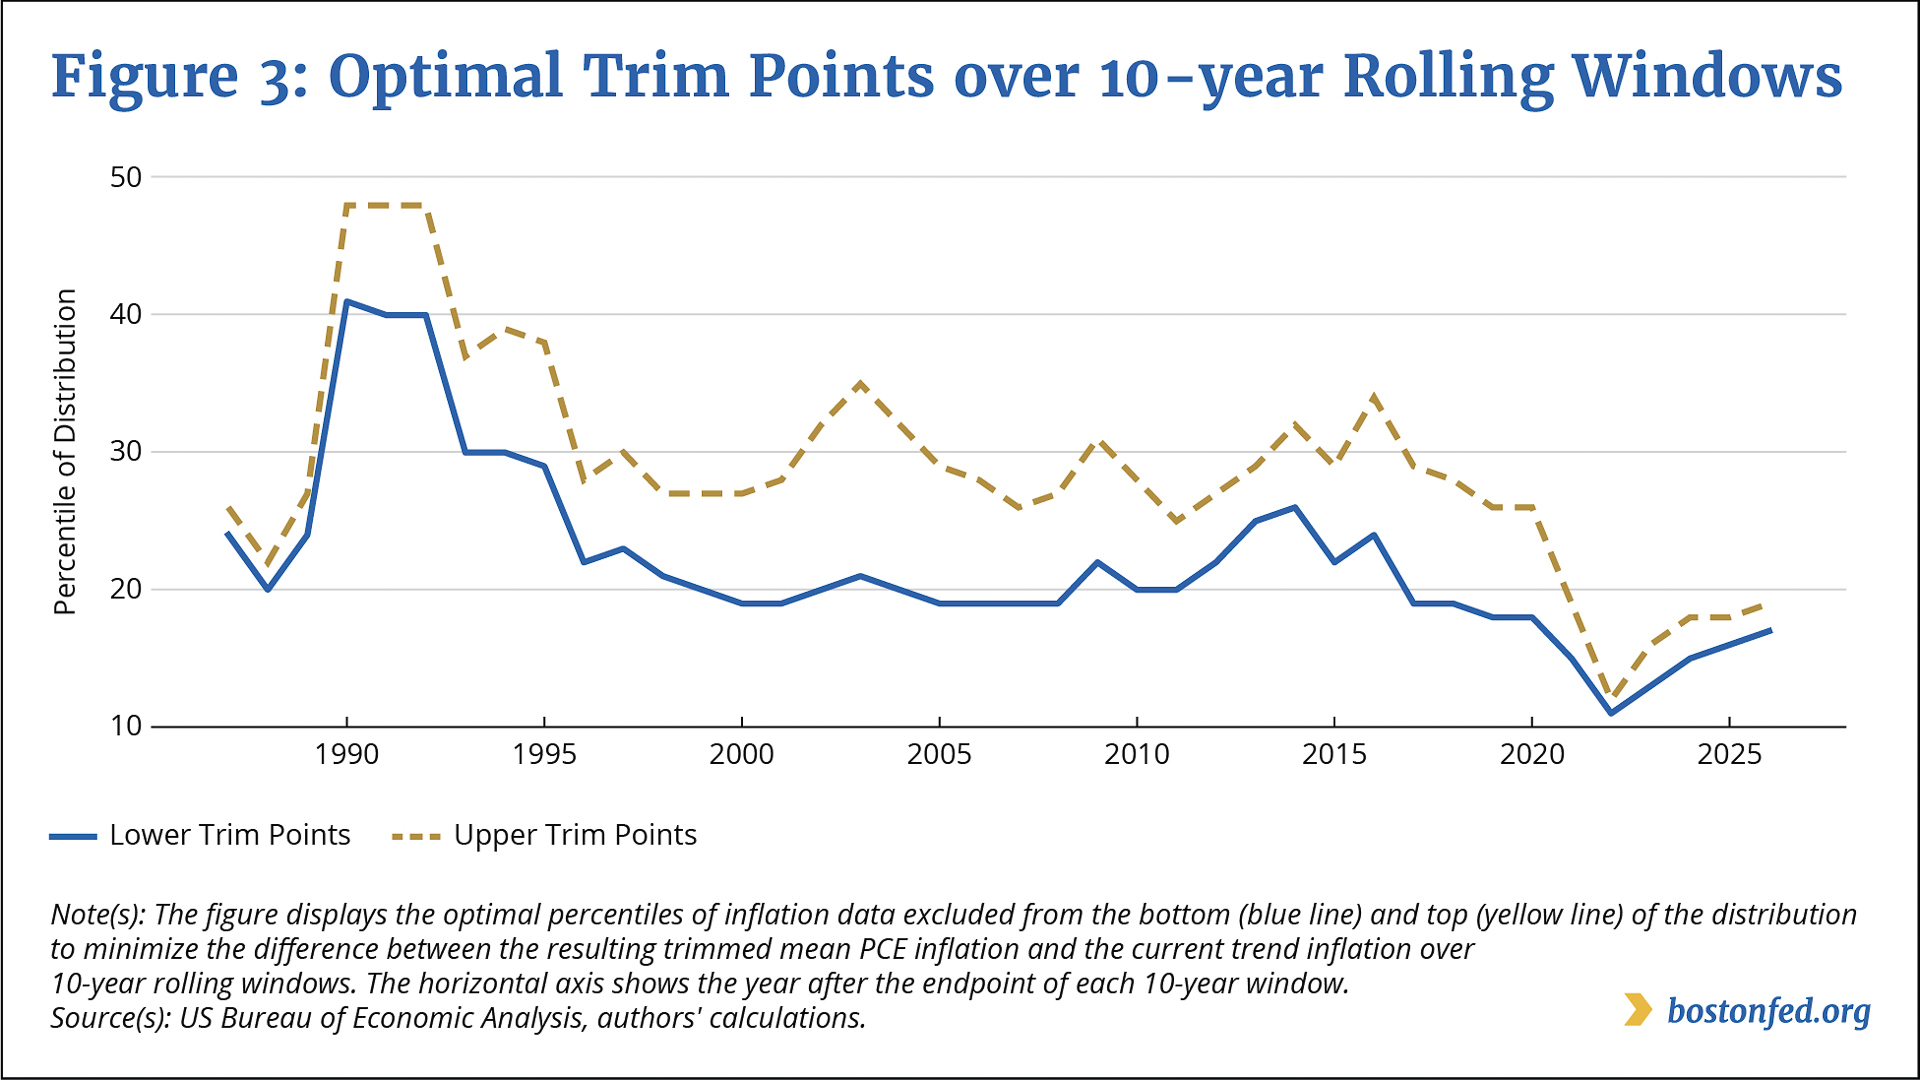
As noted earlier, the Dallas Fed selected its trim points to minimize the differences between its estimated trimmed mean inflation and its measure of trend inflation over the period of 1977 to 2009. At the time, the Dallas Fed found it optimal to trim the bottom 24 percent and the top 31 percent from the price-change distribution, and it has used these same trim points since then. With our extended measure, we find it optimal to retain a larger share of the distribution for the latest inflation estimate, omitting only the bottom 19 percent and top 23 percent. This suggests that the optimal trim points may have become less restrictive over time.
Federal Reserve Bank of Boston
We use our 10-year measure to further investigate how trim points have evolved. Beginning with 1987, Figure 3 shows what the optimal trim points were for any year based on inflation data from the 10 years preceding that year. For example, we selected the 2010 trim points using data from 2000 to 2009. As the figure shows, after the beginning of the sample period and especially during the last decade—most notably during the early 2020s period of high inflation—smaller, less restrictive and more symmetric trim points have yielded estimates that are closer to trend inflation.
These findings involving our extended and 10-year measures suggest that estimates that use a larger share of current inflation data by including more price changes from both the bottom and especially the top of the distribution may provide a clearer picture of the upside risks to inflation.
Endnotes
- A price change is weighted according to the respective category’s expenditure weight—that is, the share of total spending allocated to that category in the PCE price index.
- When measured at one decimal place, the extended measure and the Dallas Fed measure are both 2.3 percent. When measured at two decimal places, they are 2.35 and 2.26 percent, respectively.
- The Dallas Fed calculates trend inflation using an average of (1) the 36-month centered moving average (the same trend inflation measure we use in our analysis), (2) average inflation 12 to 24 months in the future, and (3) the inflation rate after applying a band-pass filter with a cutoff of 39 months, that is, after discarding movements in PCE inflation with a duration of less than 39 months.
- We estimate the gap using 12-month moving averages of economic indicators and inflation-distribution percentiles as well as a moving average of inflation over the preceding 24 months. The economic indicators are the unemployment rate, industrial production growth, and income growth excluding transfers. We include the 12.5, 25, 50, 75, and 87.5 percentiles of the month-over-month price-change distribution. For example, the 50th percentile is the 50th percentile of all the month-over-month price changes in that month. (We weight the inflation rates of PCE categories according to their weights within the PCE index.) Rich, Verbrugge, and Zaman (2022) find that a measure of the skew of the month-over-month price-change distribution—that is, a measure of how much of the distribution is concentrated in extreme positive versus extreme negative values—predicts the gap. However, the skew ceases to predict the gap when we include inflation percentiles, which makes sense, because the skew is measured using inflation percentiles.
- The Dallas Fed recently released a brief that considers an alternative method for estimating the trimmed mean PCE (Atkinson, Dolmas, and Zarutskie 2026). This method uses trim points that are optimal based on data from 1967 (instead of 1977) to 2009. The method trims the bottom 19 percent and the top 20 percent from the price-change distribution. We estimate how well this method’s year-over-year trimmed mean PCE inflation measure aligns with trend inflation and find that it has an RMSE of 0.79, which is lower than that of the original Dallas trimmed mean PCE inflation measure but higher than that of our bias-adjusted measure.
References
Atkinson, Tyler, Jim Dolmas, and Rebecca Zarutskie. 2026. “Alternative Trimmed Mean PCE Inflation Measure Better Tracked Price Surge.” Dallas Fed Economics, Federal Reserve Bank of Dallas.
Dolmas, Jim. 2005. “Trimmed Mean PCE Inflation.” Federal Reserve Bank of Dallas Research Department Working Paper 0506.
Dolmas, Jim, and Evan F. Koenig. 2009. “The 2009 Revision to the Trimmed Mean PCE Inflation Series.” Federal Reserve Bank of Dallas Technical Note.
Rich, Robert W., Randal J. Verbrugge, and Saeed Zaman. 2022. “Adjusting Median and Trimmed-Mean Inflation Rates for Bias Based on Skewness.” Federal Reserve Bank of Cleveland Economic Commentary 2022-05.

 About the Authors
Christopher D. Cotton,
Federal Reserve Bank of Boston
Christopher D. Cotton is a senior economist in the Federal Reserve Bank of Boston Research Department.
Email: Christopher.Cotton@bos.frb.org
Benjamin Grzyb,
Federal Reserve Bank of Boston
Benjamin Grzyb is a senior research associate in the Federal Reserve Bank of Boston Research Department.
Resources
Site Topics
Keywords
- trimmed mean inflation ,
- core PCE inflation ,
- trend inflation ,
- personal consumption expenditures price index
JEL Codes
- E31 ,
- E52 ,
- E37
Citation
Cotton, Christopher D., and Benjamin Grzyb. 2026. “Cutting through the Noise: A Fresh Look at Trimmed Mean PCE Inflation.” Federal Reserve Bank of Boston Current Policy Perspectives 26-10.