New England’s Rural Economy: An Overview 


Federal Reserve Bank of Boston

The views expressed herein are solely those of the authors and should not be reported as representing the views of the Federal Reserve Bank of Boston, the principals of the Board of Governors, or the Federal Reserve System.
In New England, as in most of the country, rural communities account for a sizable majority of the land but a relatively small portion of the population and employment. Nevertheless, rural communities make important contributions to the region’s economy, particularly in the agricultural sector.
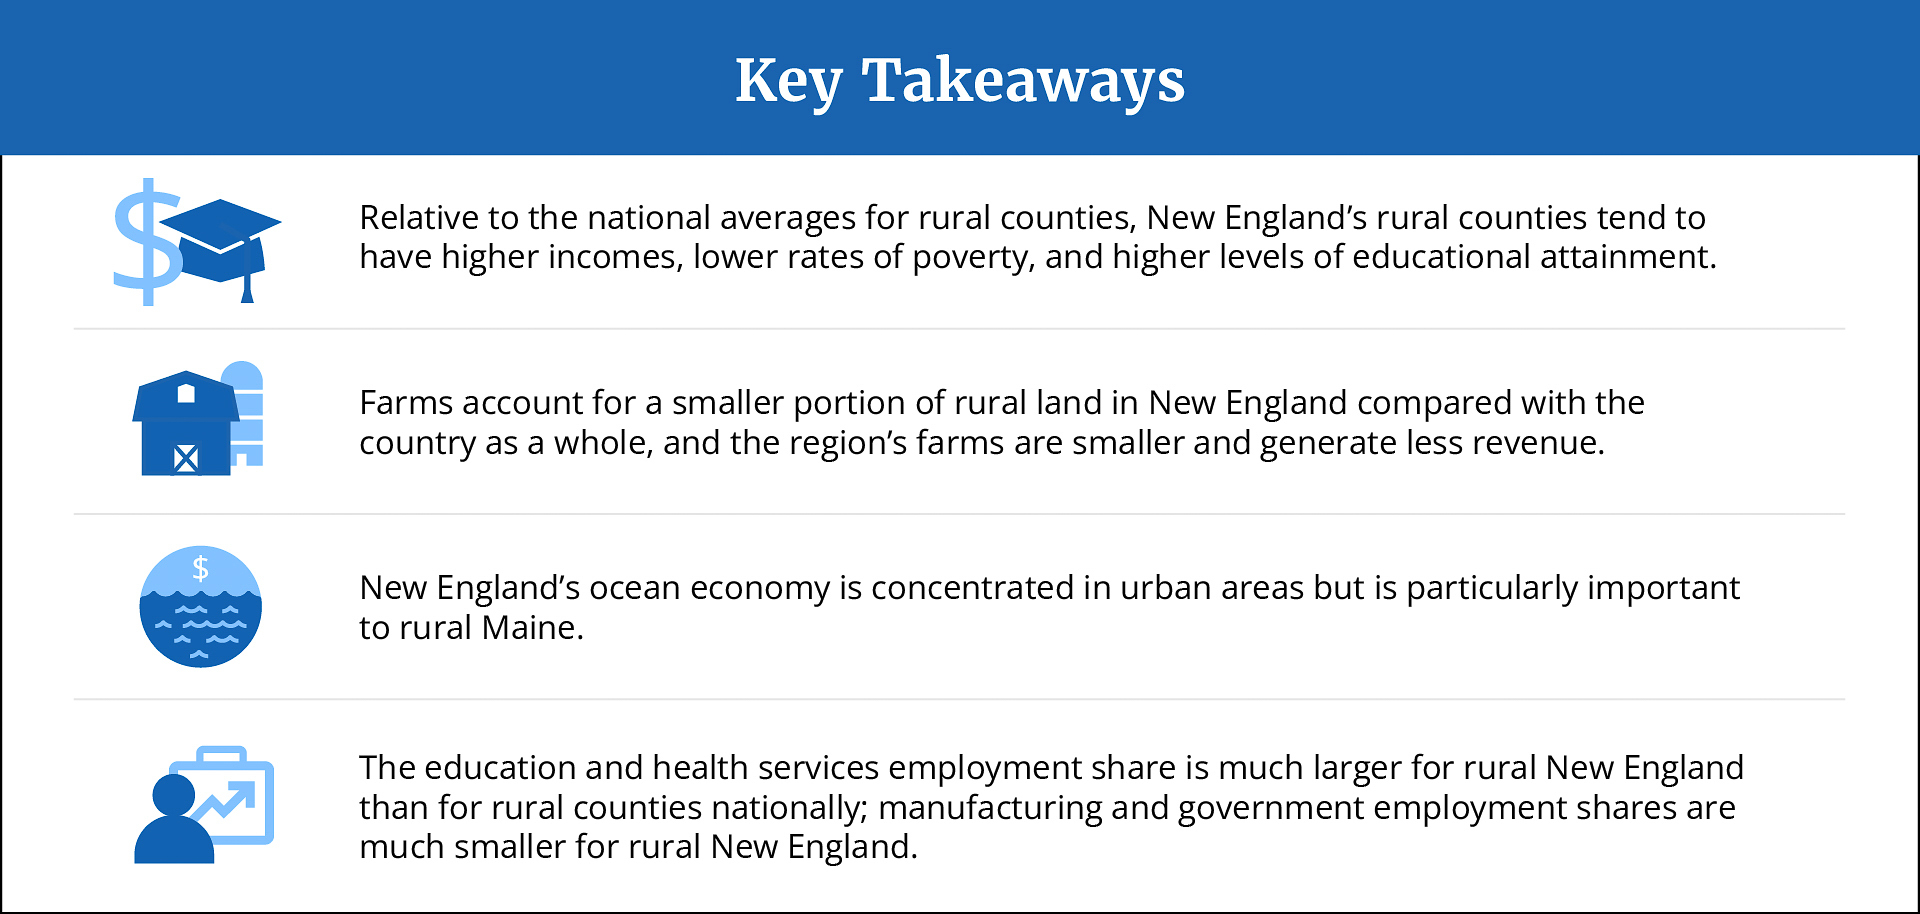
Unemployment is somewhat lower in New England’s rural counties than in the region’s urban counties, but rural-county employment has grown at about the same pace as urban-county employment in recent years. Relative to the national averages for rural counties, New England’s rural counties tend to have higher incomes, lower rates of poverty, and higher levels of educational attainment. Farms account for a smaller portion of rural land in New England compared with the country as a whole, and the region’s farms are smaller and generate less revenue. New England’s ocean economy, which includes fishing, shipbuilding and boatbuilding, and recreational activities, is primarily concentrated in urban areas but is particularly important to rural parts of Maine.
Sign up for new research and data on the New England economy.
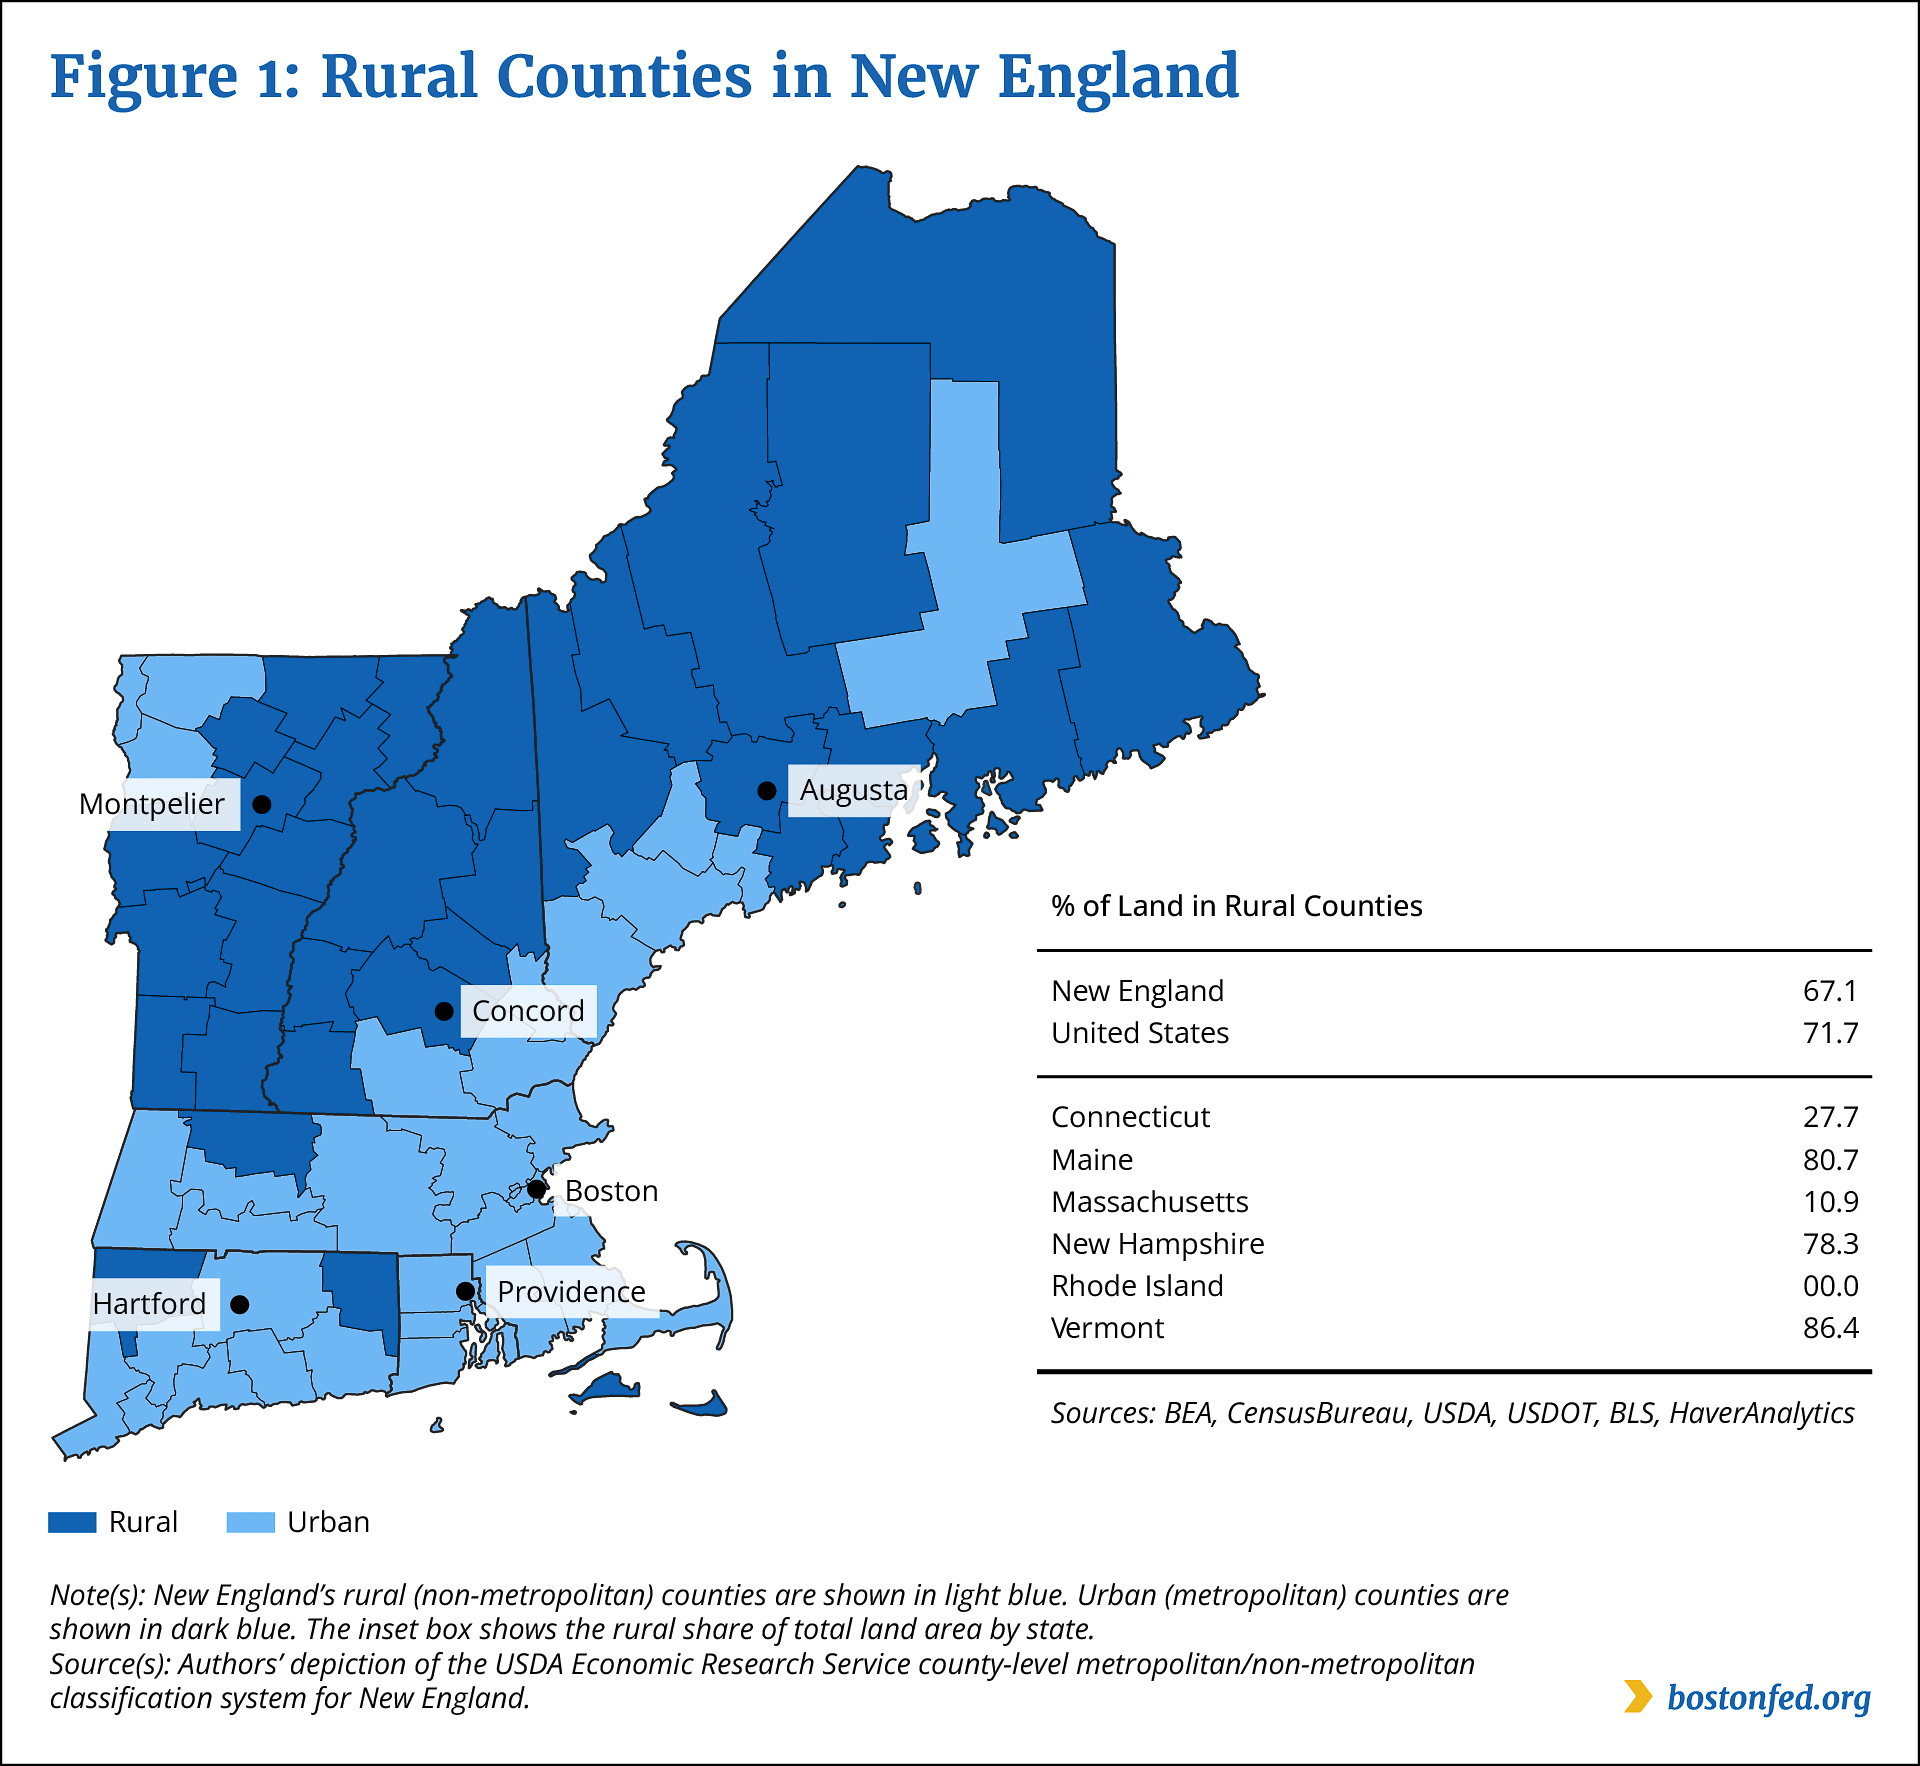
This brief provides a high-level overview of the contributions of rural communities to New England’s economy by combining information from the US Department of Agriculture (USDA), the US Census Bureau, the US Bureau of Labor Statistics (BLS), the US Bureau of Economic Analysis (BEA), and the US Department of Commerce’s National Oceanic and Atmospheric Administration (NOAA). The definition of rural used for these data comes from the USDA Economic Research Service, which classifies entire counties as either metropolitan or non-metropolitan based on their population size and density and their economic connection to a metropolitan center. “Urban” describes all metropolitan counties, and “rural” describes all non-metropolitan counties and includes lower-population “non-core” counties as well as “micropolitan” counties, which are home to small cities.1 Figure 1 shows which New England counties are classified as urban, and which are classified as rural.
New England’s Rural-county Population Share Declined Slightly
Geographically, New England is modestly less rural than the rest of the county. Two-thirds (67 percent) of the region’s square miles are in counties identified as rural compared with nearly three-quarters (72 percent) nationwide (Figure 1). Some New England states are substantially more rural than others. In Vermont, rural counties account for 86 percent of the total area, whereas no Rhode Island county is classified as rural.
Federal Reserve Bank of Boston
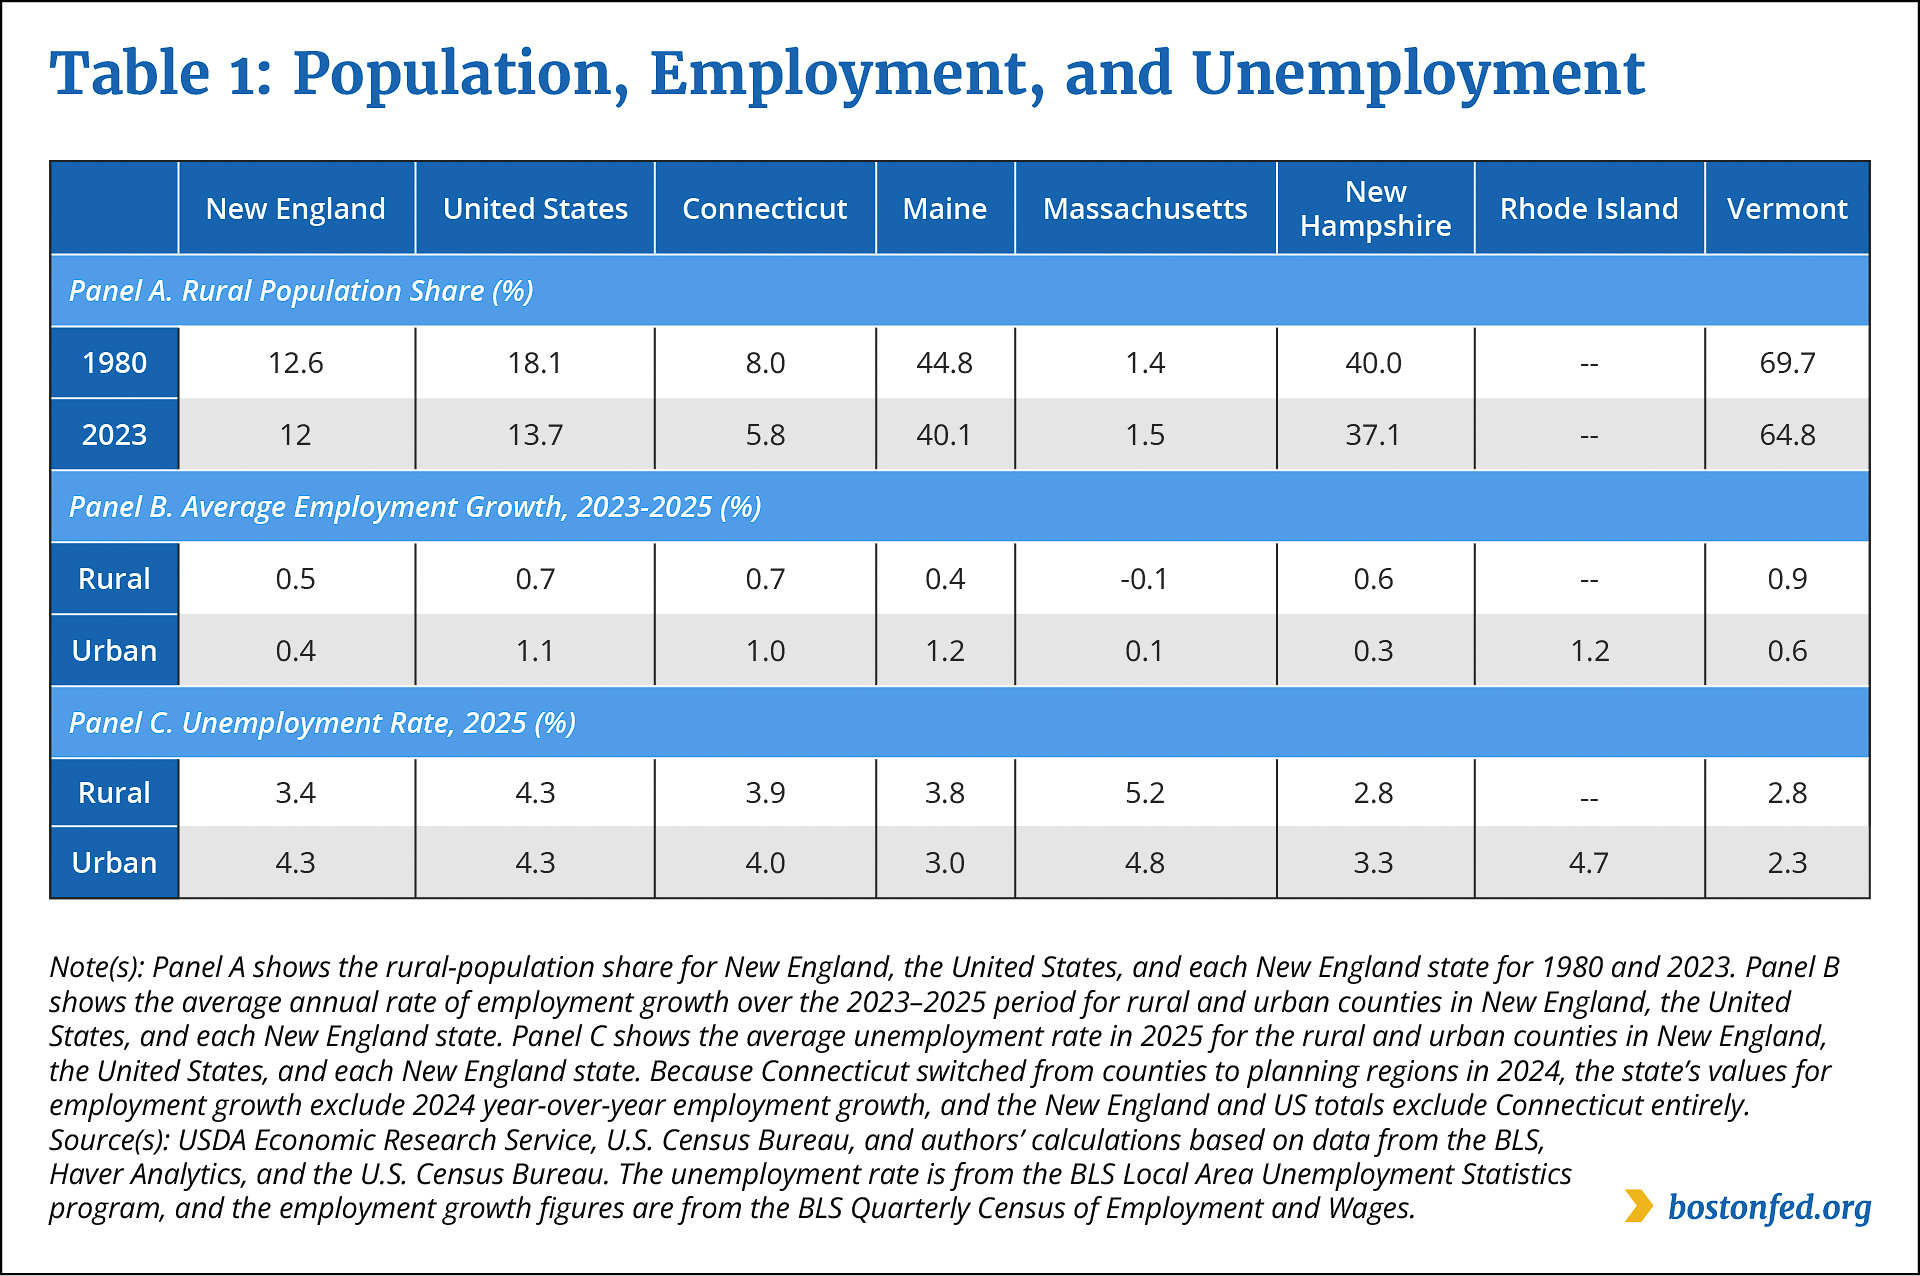
According to the most recent available data (from 2023), the share of New England’s population living in rural areas, 12.0 percent, was similar to the share of the US population living in such areas, 13.7 percent (Table 1, Panel A). Within New England, state-level rural-population shares vary substantially, ranging from 64.8 percent in Vermont to 1.5 percent in Massachusetts and 0 percent in Rhode Island.
Federal Reserve Bank of Boston
The US rural-population share declined sharply after 1980, when it was 18.1 percent, falling by nearly one-fourth to the aforementioned 13.7 percent. The decline was more modest in every New England state except Connecticut, where it fell by 28 percent, dropping from 8.0 percent in 1980 to 5.8 percent in 2023.
A decline in a state’s rural-population share over decades may reflect relatively slow growth in the number of people living in rural areas, or it may reflect the reclassification of a county (or counties) from rural to urban. Over time, a rural county can be absorbed into a neighboring urban area due to population growth or an increase in economic connectedness with that area. Some of the decline in the US rural-population share reflects formerly rural counties being reclassified as urban. However, in New England, where the overall population has grown relatively slowly, few rural counties have been reclassified in recent decades.2 Connecticut is a unique case. It shifted away from identifying sub-state areas as counties and instead now has planning regions, which are reflected in BLS data as of 2024. Because the planning regions do not map neatly onto the boundaries that defined the counties, the shift contributed to the decline in Connecticut’s rural-population share.
Nationally, unemployment rates in 2025 were similar in urban and rural counties, sitting at just over 4 percent for each group of counties (Table 1, Panel C). In New England, rural counties saw lower unemployment (3.4 percent) than their urban counterparts (4.3 percent). The rates differed largely because a substantial portion of the region’s rural counties are in Vermont and New Hampshire, where unemployment rates were very low across the board.
In recent years, employment has grown faster in urban counties than in rural counties nationally, but in New England, rural employment has grown about as fast urban employment (Table 1, Panel B). Connecticut and Maine both saw faster employment growth in their urban counties compared with their rural counties from 2023 to 2025, but that was not the case for New Hampshire and Vermont, where rural counties added jobs at a quicker pace than urban counties.
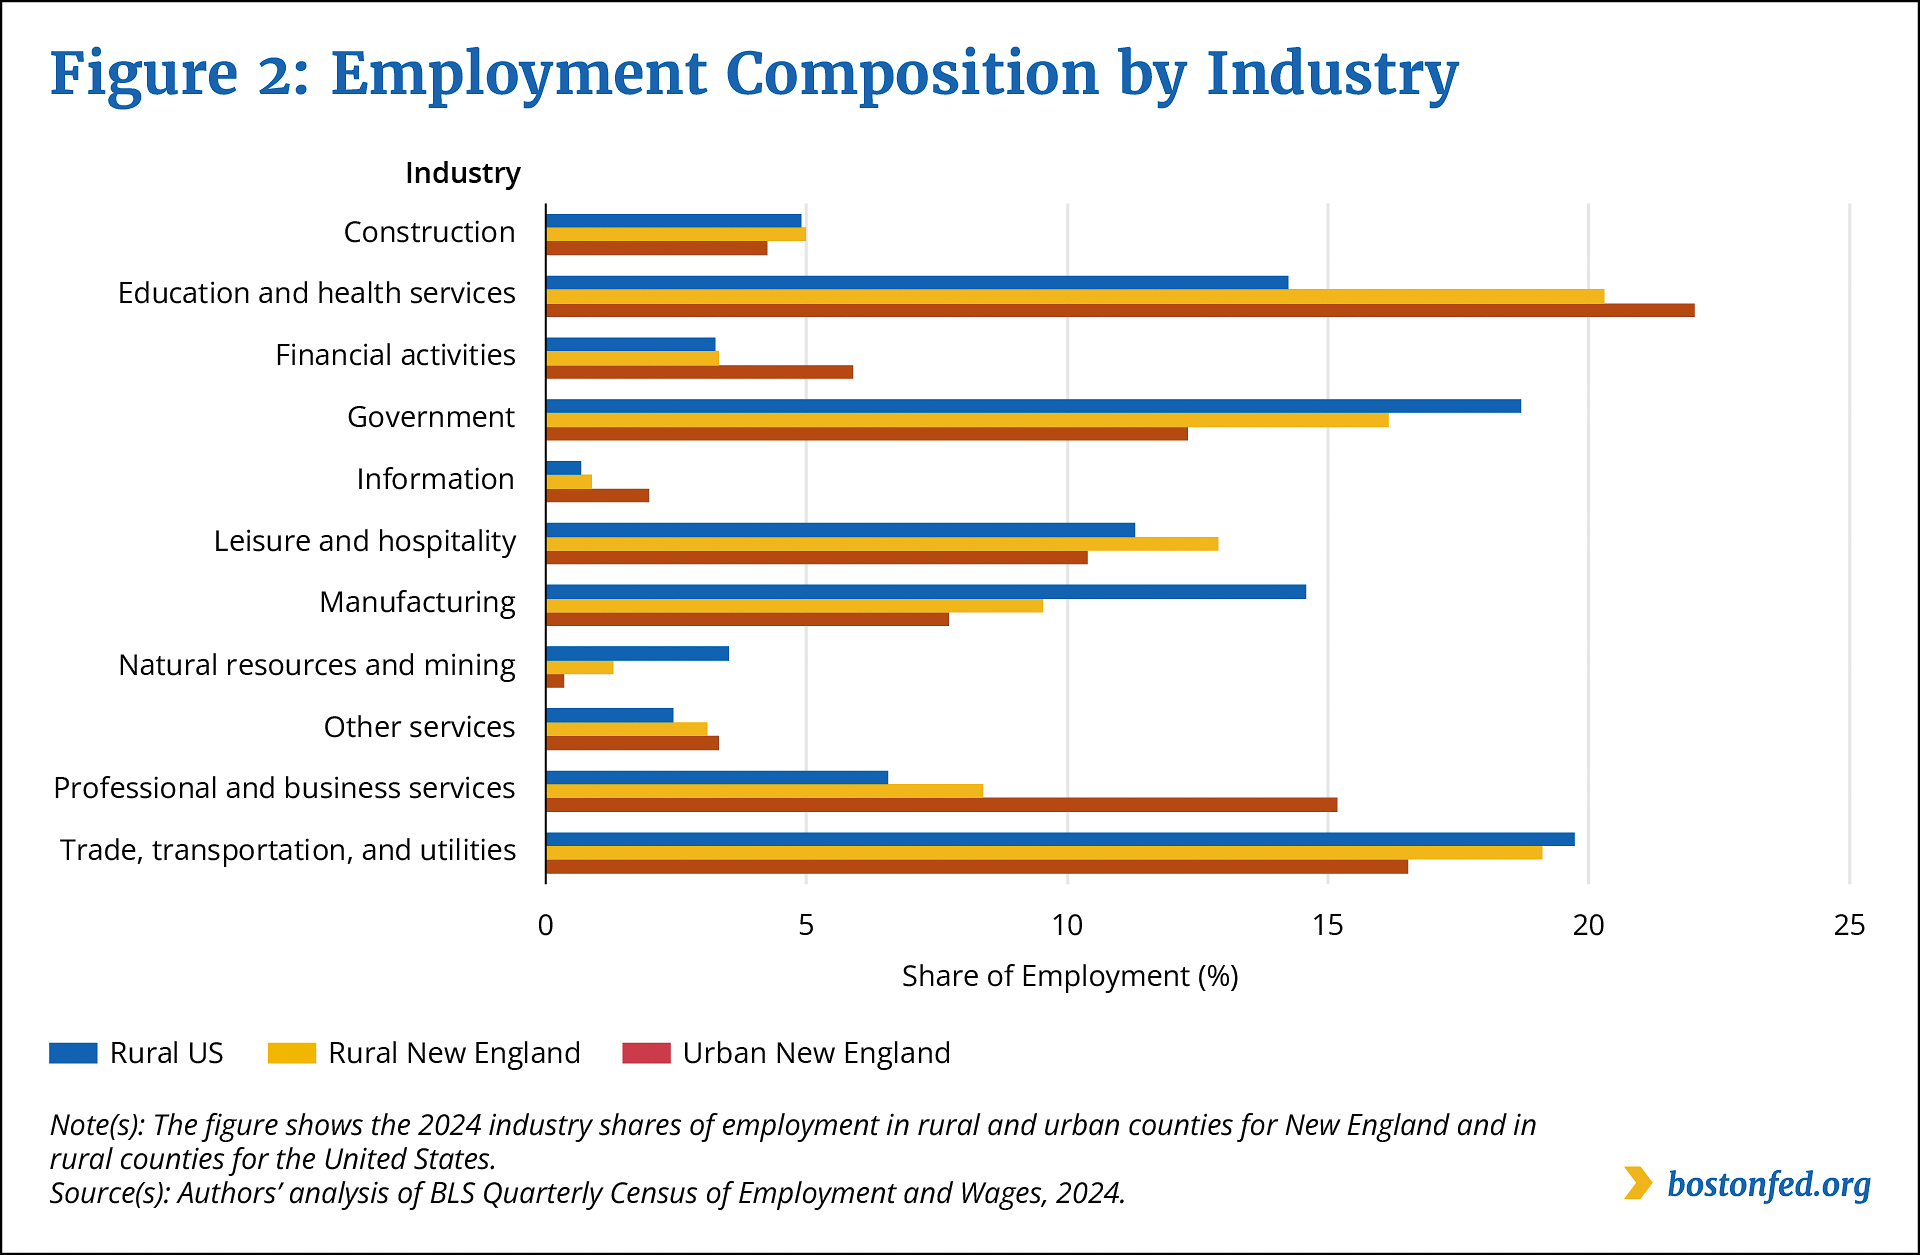
The sectoral employment composition of New England’s rural and urban areas is broadly similar to the national averages, with some notable differences. The education and health services sector, for example, employs larger shares of New England’s rural and urban workforces. This sector accounts for 22 percent of urban employment and 20 percent of rural employment in the region but just 14 percent of rural employment nationally (Figure 2). Also, compared with national averages, smaller shares of New England’s rural workforce are employed in the manufacturing sector (9.5 percent in New England versus 14.6 percent nationally) and in the government sector (16 percent versus 19 percent).
Federal Reserve Bank of Boston
New England Rural-county Income Is High Compared with US Urban Counties
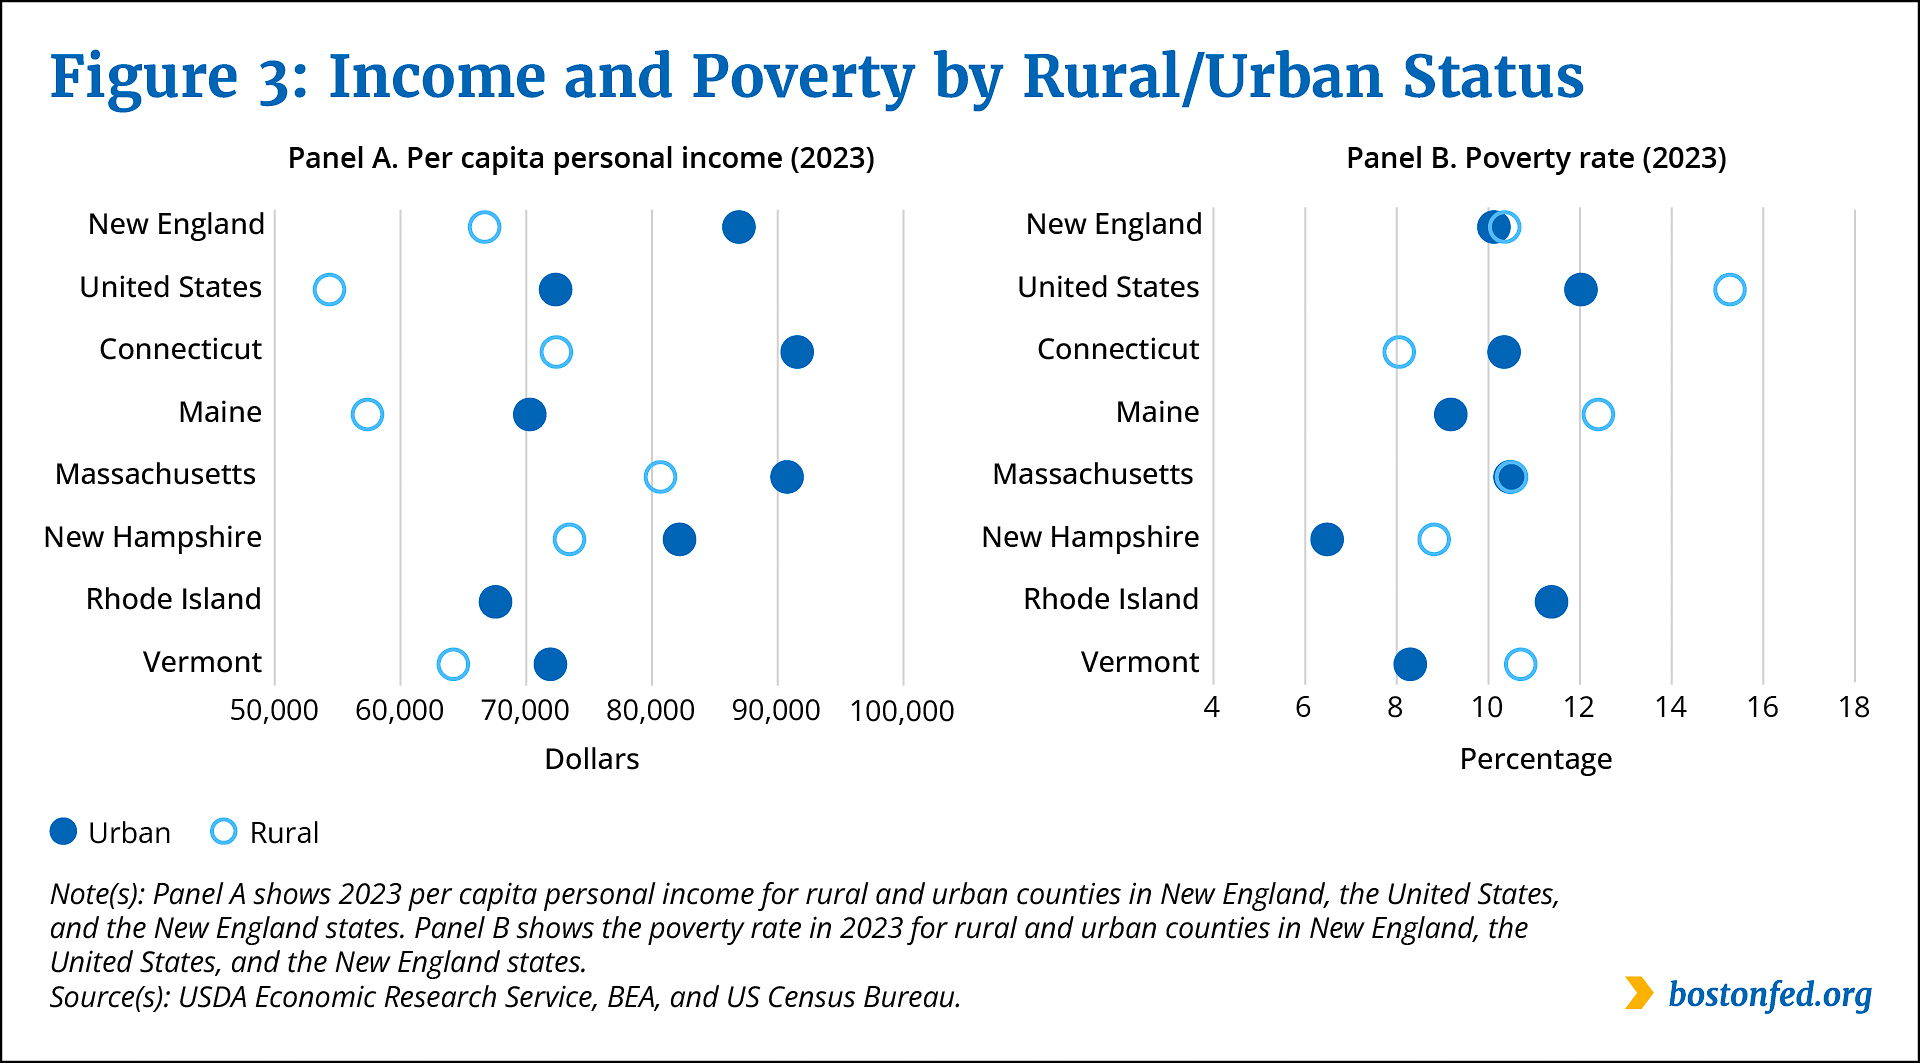
It is well established that in the United States, incomes are systematically higher in urban counties compared with rural counties; this is also true for New England (Figure 3, Panel A). It is notable that in 2023 (the most recent year for available data) the rural-county per capita personal income in New England was nearly as high as the per capita personal income for urban counties nationally. In three New England states—Connecticut, Massachusetts, and New Hampshire—the rural-county per capita personal income was higher than the US urban-county per capital personal income.
Federal Reserve Bank of Boston
At the national level, the poverty rate was higher in rural counties than in urban counties, averaging 15.3 percent in rural counties in 2023 and 12.0 percent in urban counties (Figure 3, Panel B). By contrast, in New England, the urban-county and rural-county poverty rates were nearly indistinguishable. Within the region, however, with the exception of Massachusetts, there were considerable differences between the two rates. Poverty was lower in Connecticut’s rural counties than in the state’s urban counties, whereas in Maine, New Hampshire, and Vermont, poverty was higher in the rural counties than in the urban counties. (As noted earlier, Rhode Island has no rural counties.)
Rural New Englanders Are Becoming Increasingly More Highly Educated than the US Rural Population
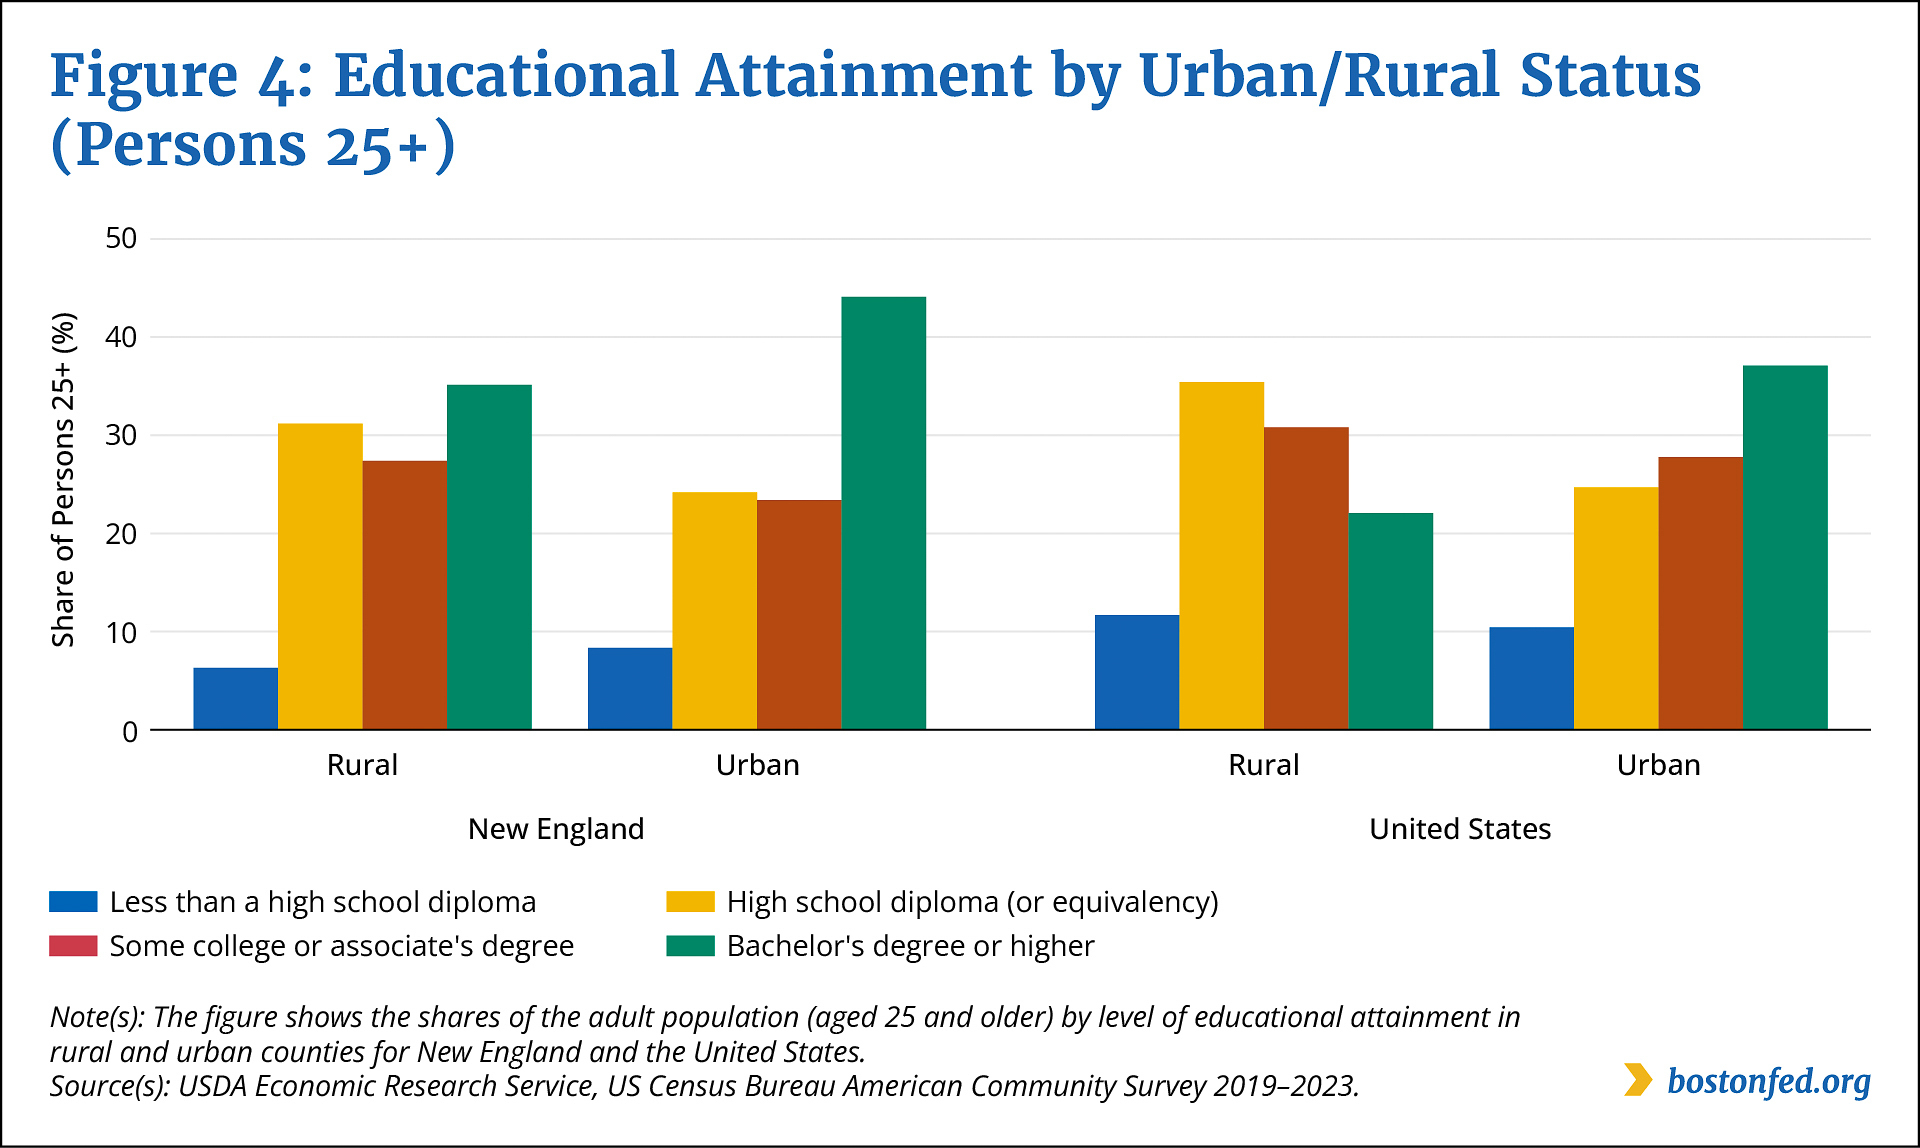
The adult population (aged 25 and older) in both rural and urban New England is more highly educated than the US adult population. Just 6.3 percent of adults in the region’s rural counties had less than a high school diploma during the 2019–2023 period compared with 11.7 percent nationally (Figure 4). During that same period, more than one-third of rural New Englanders (35.1 percent) had a bachelor’s degree or higher, whereas just one-fifth of rural Americans (22.1 percent) had a bachelor’s degree. Nationally, individuals with a high school degree or a GED comprised the largest educational-attainment group in rural areas; in rural New England, individuals with a bachelor’s degree or higher comprised the largest group.
Federal Reserve Bank of Boston
Furthermore, the educational advantage of rural New Englanders over their national counterparts has grown. The share of adults in rural counties with a bachelor’s degree was 8.2 percentage points higher for New England than for the country in 1990 and 13.0 percentage points higher during the 2019–23 period.
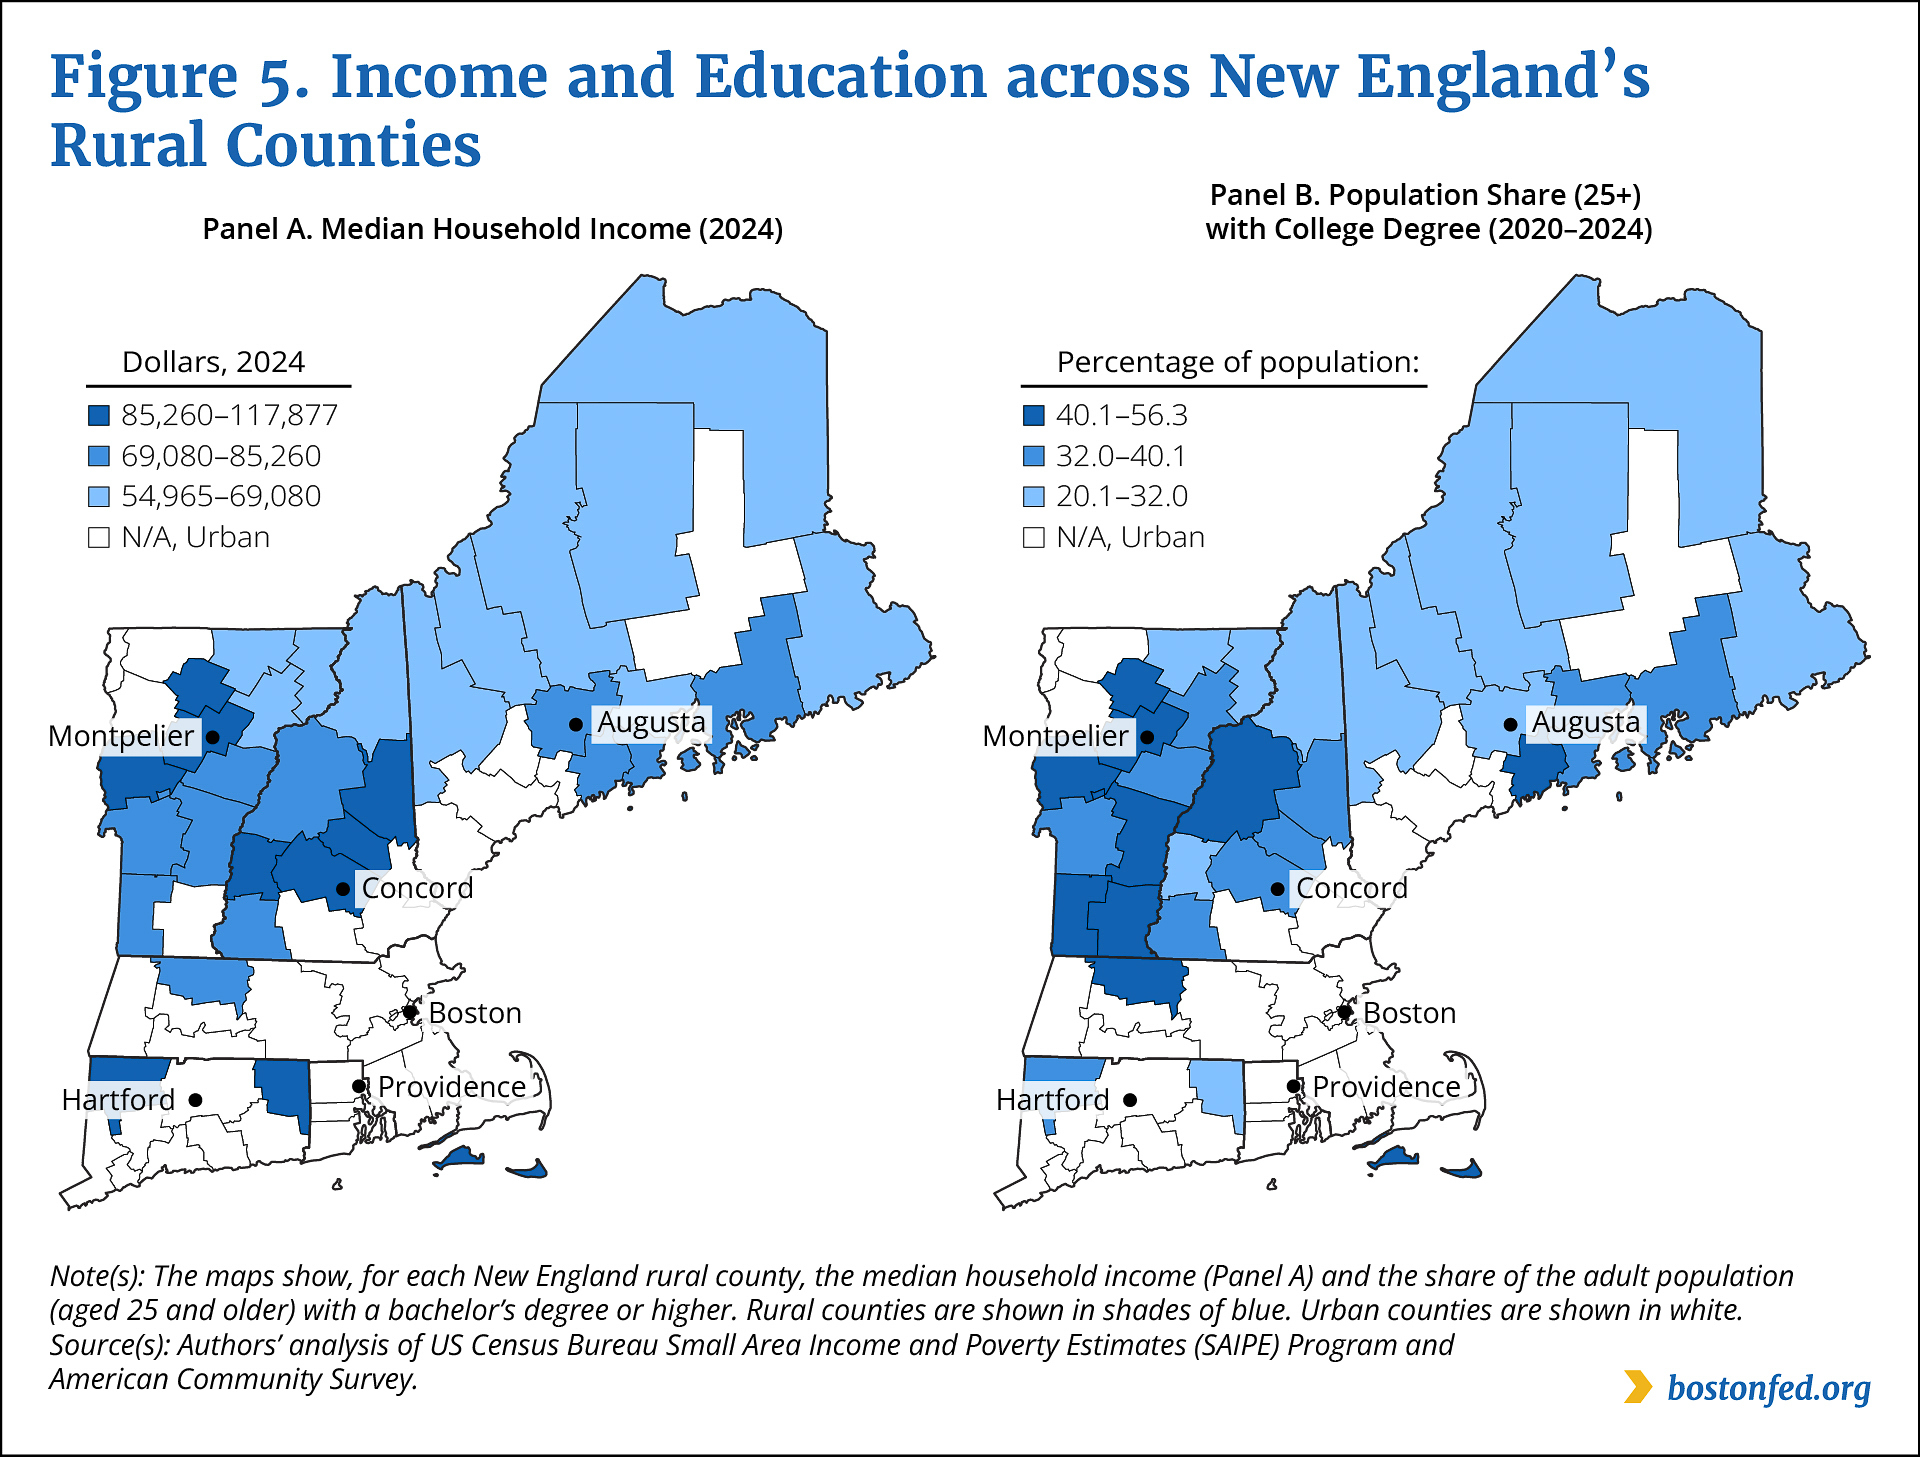
While New England’s rural counties overall stand apart from rural counties in other parts of the country in terms of income and education, there is substantial variation within the region. As the maps in Figure 5 illustrate, the rural counties with the highest incomes and the highest average levels of education tend to be located closer to the region’s urban areas and state capitals.
As Panel A of Figure 5 shows, each of the highest-income rural counties (median household income from $85,260 to $117,877) borders an urban county; in the case of Vermont and New Hampshire, a highest-income county also contains the state capital. Massachusetts’ Nantucket and Dukes (on Martha’s Vineyard) counties—both of which are islands that are affluent vacation destinations—are the two counterexamples. The lowest-income (median household income from $54,965 to $69,080) rural counties are the most remote. They are located primarily in the Northeast Kingdom at the northern tip of Vermont and in northern New Hampshire and northern Maine.
Federal Reserve Bank of Boston
Many of the high-income rural counties are also among the rural counties with the highest average levels of educational attainment (Figure 5, Panel B). In the northern New England states, the counties in which 40.1 percent to 56.3 percent of the adult population has a bachelor’s degree or higher are home to or adjacent to the state capital. Most of the rural counties in Vermont have adult populations with high levels of average educational attainment, whereas most of the remote northerly regions of New Hampshire and Maine tend to have lower average levels of educational attainment, with less than one-third of the adult population holding a bachelor’s degree or higher.
New England’s Farms Are Smaller and Less Productive than US Farms
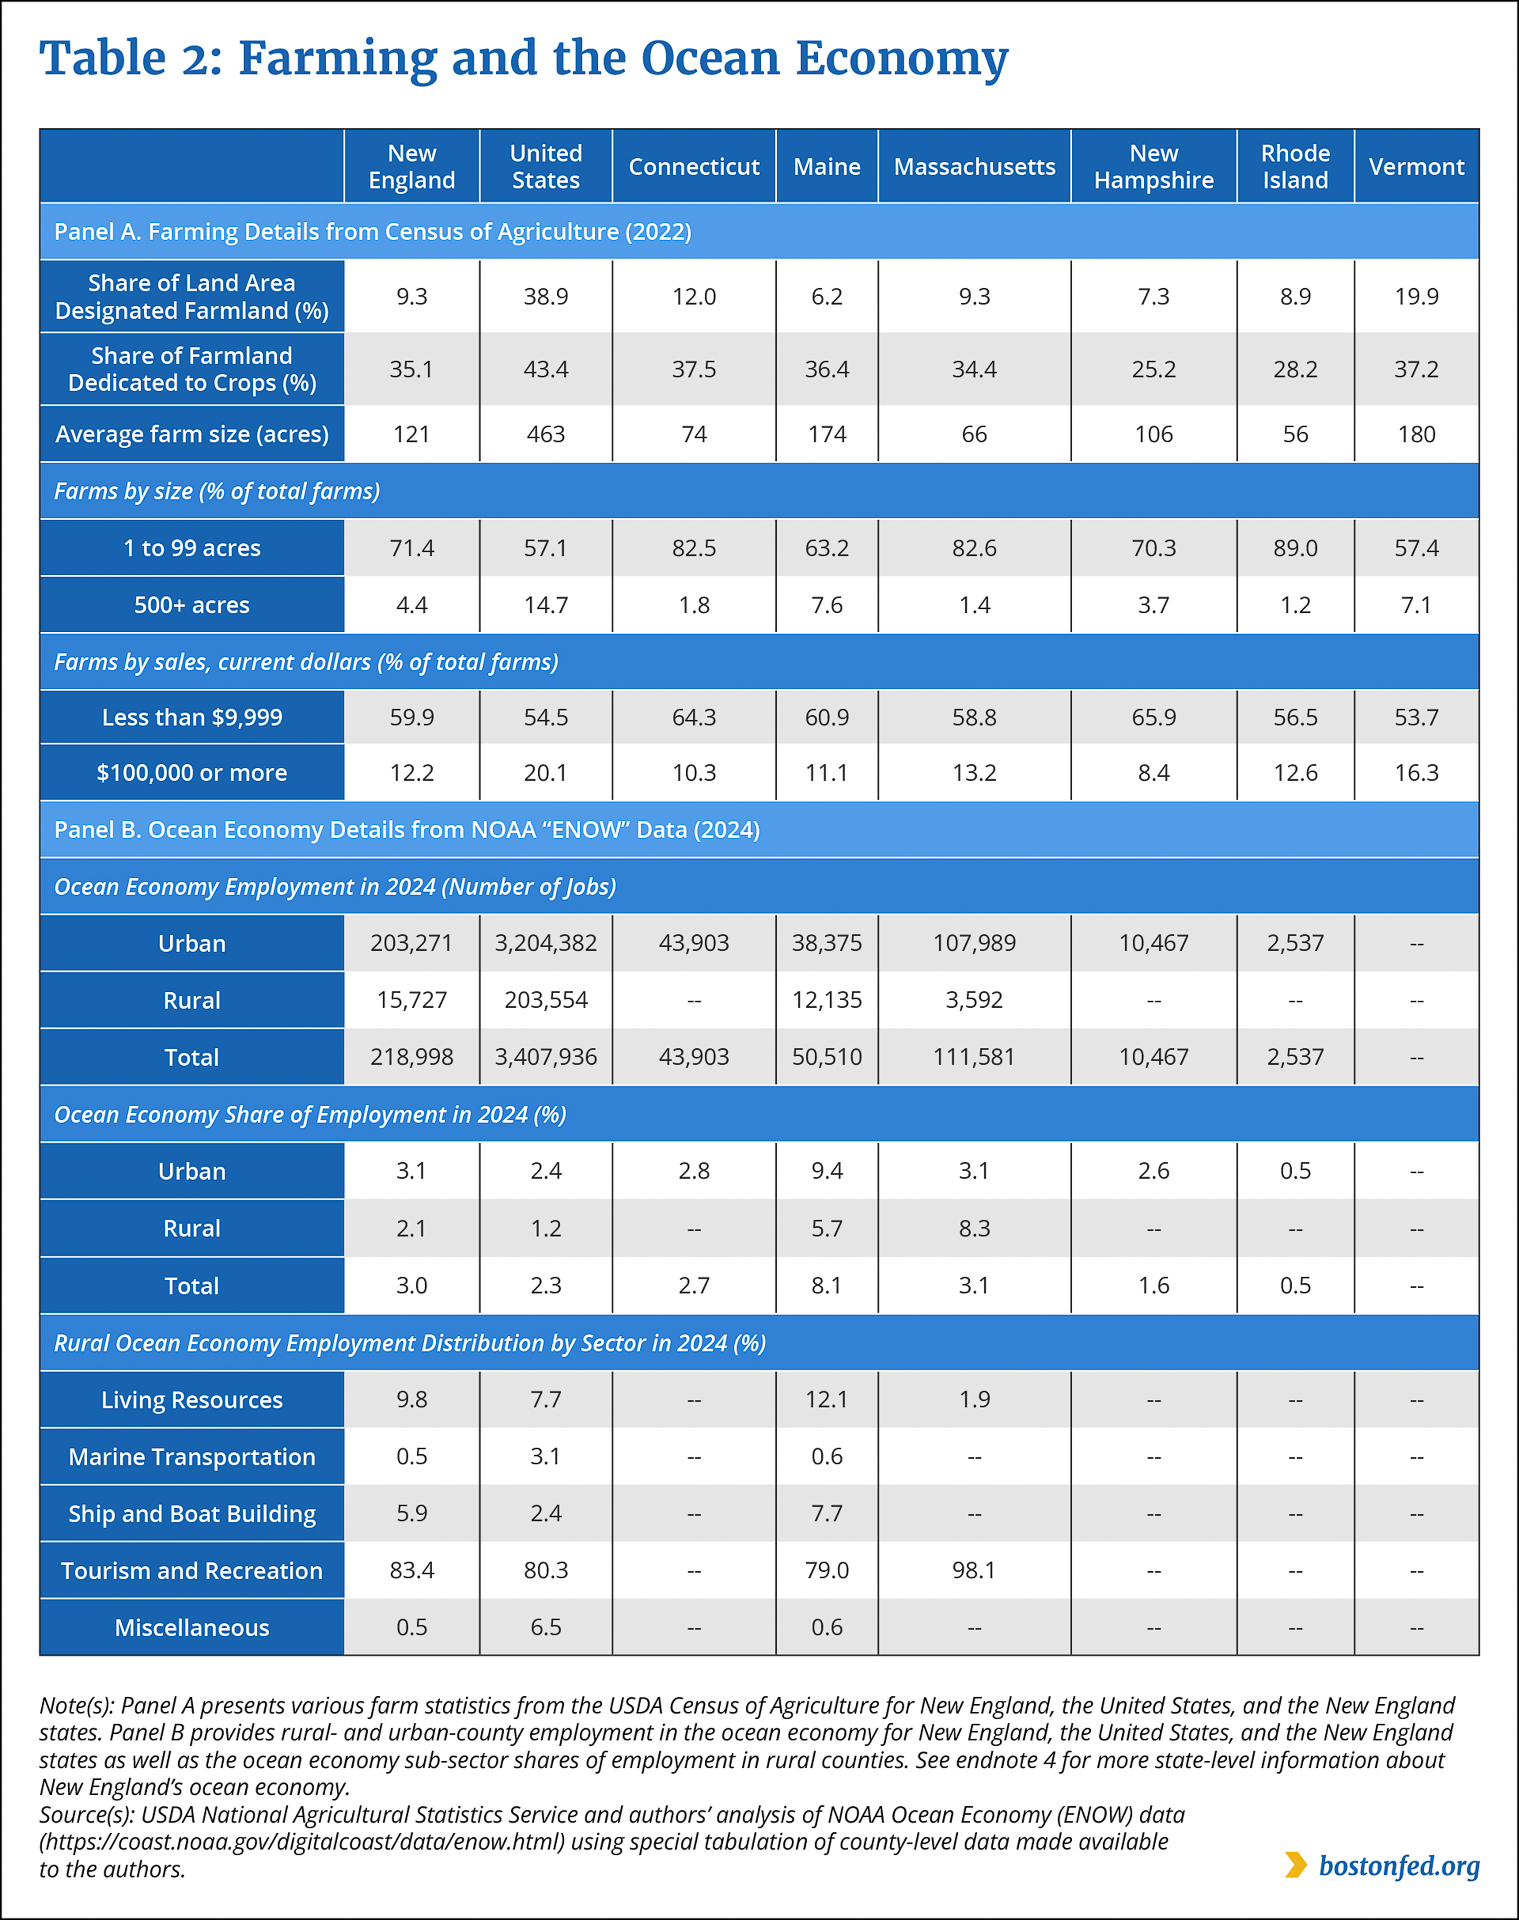
Farms account for a smaller portion of land in New England than in the country as a whole. Less than 10 percent of the land in New England was designated farmland in 2022 compared with 39 percent nationally (Table 2, Panel A). Within the region, the farmland share of the land ranged from almost 20 percent in Vermont to just 6.2 percent in Maine. The portion of New England farmland devoted to crops was also smaller than the national share, just over 35 percent versus more than 43 percent in 2022.
Federal Reserve Bank of Boston
New England farms are, on average, smaller and generate lower sales volumes. The average farm in New England was 121 acres in 2022, compared with 463 acres nationally. Within the region, the average size ranged from 56 acres in Rhode Island to 180 acres in Vermont. The region includes very few large farms; in 2022, less than 5 percent of New England farms were larger than 500 acres, compared with nearly 15 percent of farms nationally. Only 12 percent of New England farms had annual sales of $100,000 or more, compared with 20 percent of farms nationally. Vermont stands out in the region with a little more than 16 percent of its farms generating sales that reached that level.
The top agricultural commodities in New England differ substantially from the top US agricultural commodities.3 Of the national top three (cattle, corn, and soybeans) only one was among the top five commodities of any New England state (cattle in Vermont) in 2023. Prominent New England commodities include dairy products, of which Vermont is the region’s largest producer, and potatoes, which are the top commodity in Maine. Floriculture, chicken eggs, and “miscellaneous crops” are also among the region’s top agricultural commodities. Cranberries are the third-largest commodity in Massachusetts.
Many New Englanders with traditional jobs are not working with the land, but rather on the sea: Ocean economy jobs employed 219,000 New Englanders in 2024, according to the NOAA Open Ocean Economy program’s Open Economics: National Ocean Watch (Open ENOW) data set (Table 2, Panel B).4 Most of the region’s ocean economy work is found in urban counties. However, these jobs employed nearly 16,000 rural New Englanders in 2024, including more than 12,000 in Maine. Ocean economy jobs accounted for only 2.3 percent of total (rural and urban) employment nationally in 2024, but New England’s ocean economy jobs accounted for 3.0 percent of the region’s total employment. Ocean economy jobs account for 8.1 percent of Maine’s total employment and 5.7 percent of its rural-county employment. Dominated by the contributions of Nantucket and Martha’s Vineyard, ocean economy jobs provided 8.3 percent of rural-county employment in Massachusetts.
The tourism and recreation sector accounted for the single largest portion of rural ocean economy jobs in 2024, both nationally (80.3 percent) and in New England (83.4 percent). Other important sectors for New England are living resources (fishing, lobstering, hatcheries and seafood processing and markets), which accounted for 10 percent of the rural ocean economy jobs regionally and 12 percent in Maine in 2024, and shipbuilding and boatbuilding, which accounted for 6 percent of those jobs regionally and 8 percent in Maine.
Endnotes
- According to the standard practice of researchers in the US Department of Agriculture Research Service, the terms “urban” and “rural” refer, respectively, to counties that are part of a metropolitan statistical area and counties that are not part of a metropolitan statistical area (USDA 2026). Metropolitan statistical areas are county-based regions defined by the Office of Management and Budget (OMB 2023).
- Some New England counties have experienced temporary status changes in recent years. In 2006, Windham County in Connecticut was reclassified from rural to urban, and Franklin County in Massachusetts went from urban to rural. Both of these changes were reversed following the 2010 census, and the counties reverted to their previous status in 2013. Other switches in 2006 were Litchfield County in Connecticut (urban to rural) and Sagadahoc and York counties in Maine (rural to urban) (NCHS 2024).
- For the entire United States “cattle and calves” was the single largest agricultural commodity in 2023. It had annual cash receipts of more than $101 billion and accounted for 31.4 percent of the total value of the top five agriculture commodities. In Connecticut, Massachusetts, New Hampshire, and Rhode Island “miscellaneous crops” were the largest agricultural commodity, with cash receipts of $304 million, $206 million, $62 million, and $66 million, respectively. Miscellaneous crops made up 45.8 percent, 45.6 percent, 28.7 percent, and 66.8 percent, respectively, of the total value of each of those states’ top five agricultural commodities. In Maine, potatoes had cash receipts of more than $223 million, constituting 31.7 percent of the total value of the state’s top five commodities. In Vermont, dairy products had cash receipts of nearly $552 million, making up 63.1 percent of the total value of the state’s top five commodities.
- Vermont has no ocean economy employment; Connecticut, New Hampshire, and Rhode Island all have ocean economy employment, but it is fully contained in counties that are not considered rural. Connecticut had 43,900 ocean economy jobs in 2024. Tourism and recreation (93 percent of the state’s ocean economy jobs) and marine transportation (4 percent) were the two largest sectors. New Hampshire had 10,500 ocean economy jobs in 2024. Tourism and recreation (75 percent of the state’s ocean economy jobs) and marine transportation (22 percent) were the state’s two largest sectors. Rhode Island had 2,500 ocean economy jobs in 2024. Marine transportation (57 percent of the state’s ocean economy jobs) and shipbuilding and boatbuilding (40 percent) were the two largest sectors. In Maine, 18 percent of the 38,400 urban ocean economy jobs are in the shipbuilding and boatbuilding sector.
References
Executive Office of the President, Office of Management and Budget (OMB). 2023. OMB Bulletin No. 23-01.
US Centers for Disease Control and Prevention National Center for Health Statistics (NCHS). 2024. “NCHS Urban–Rural Classification Scheme for Counties.”
US Department of Agriculture Research Service (USDA). 2026. “Rural Classifications—What Is Rural?”

 About the Authors
Jeffrey P. Thompson,
Federal Reserve Bank of Boston
Jeffrey P. Thompson is a vice president and economist in the Federal Reserve Bank of Boston Research Department, where he is the director of the New England Public Policy Center.
Email: jeffrey.thompson@bos.frb.org
Nathaniel R. Nelson,
Federal Reserve Bank of Boston
Nathaniel R. Nelson was a senior research associate with the New England Public Policy Center in the Federal Reserve Bank of Boston Research Department when he coauthored this brief.
Acknowledgments
The authors thank New England Public Policy Center Research Associate Elizabeth Brame for excellent assistance.
Resources
Site Topics
Keywords
- New England ,
- NEPPC Regional Brief ,
- rural economy