How Closely Do Public and Private Labor Market Data Align for New England Compared with the Nation? 


Federal Reserve Bank of Boston

The views expressed herein are those of the authors and do not indicate concurrence by the Federal Reserve Bank of Boston, the principals of the Board of Governors, or the Federal Reserve System.
Researchers and policymakers often rely on publicly provided government data on US economic conditions to inform their analyses and decisions. Jerome Powell regularly emphasized the importance of these data while serving as Federal Reserve chair, noting that the members of the Federal Open Market Committee “determine the appropriate stance of monetary policy based on the incoming data, the evolving outlook, and the balance of risks” and specifying that “government data really is the gold standard in data.”1 However, government data have faced mounting challenges in recent years that have implications for their usage. These challenges include falling survey response rates, funding constraints, and an intermittent lack of availability due to federal government shutdowns.2 As such issues have emerged, privately provided data have gained prominence among researchers and policymakers at the Federal Reserve and elsewhere as a potential alternative to publicly provided data for economic analysis, particularly of labor market conditions.3
The use of private labor market data for research and policy work has prompted discussion about how they align with public data at the national level.4 However, there has been less assessment of such alignment at the regional level, where patterns may differ given distinct sample sizes, market features, and other factors. During the fall 2025 federal government shutdown, we used private labor market data when examining New England economic conditions and found that the regional trends differed somewhat from the national trends.5
Sign up for new research and data on the New England economy.
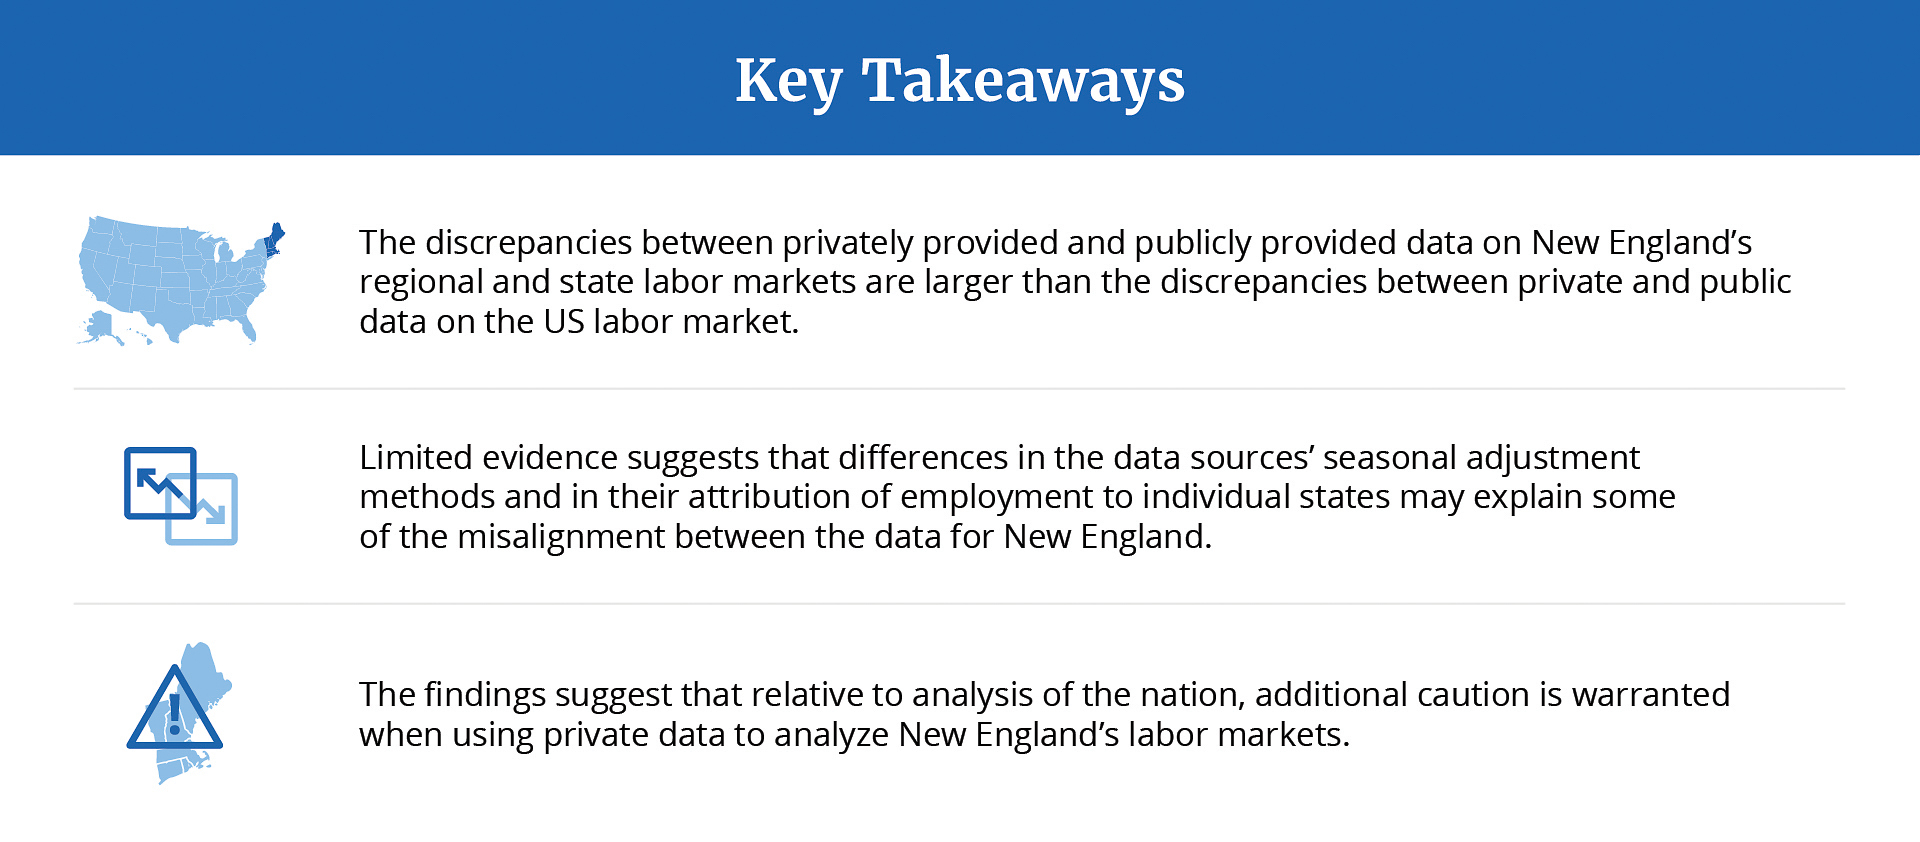
Our current analysis indicates that private labor market data for New England or the New England states are generally less aligned with corresponding public data compared with the alignment of private and public data for the United States as a whole. We examine several potential reasons for these patterns and find that seasonal adjustments and area-specific measurement error could play roles. More specifically, we find limited evidence that differences in the data sources’ seasonal adjustment methods and in their attribution of employment to individual New England states may help to explain why the misalignment between public and private employment data is greater for the region than for the country. These findings suggest that relative to analyzing the national labor market, additional caution is warranted when using private data for regional analysis.
Comparing BLS Data with Data from ADP, Indeed, and Revelio
For much of our analysis, we focus on employment data. The traditional, government employment data come from the Current Employment Statistics (CES, also known as the establishment survey or payroll survey), which are provided by the US Bureau of Labor Statistics (BLS). The alternative, private data on employment come from two sources: the payroll-processing firm ADP—specifically, the ADP Research Institute’s National Employment Report—and the workforce-analytics firm Revelio Labs and its Revelio Public Labor Statistics.6 We also compare job postings data from the BLS’s Job Openings and Labor Turnover Survey (JOLTS) with data from the online job-listing firm Indeed (namely, the Indeed Hiring Lab’s daily Job Postings Index), and Revelio Lab’s Public Labor Statistics.7
Our sample period is January 2023 through December 2025. Unless otherwise indicated, the data were accessed by early April 2026.8 We index each monthly data series—from the BLS and the private sources—to its January 2023 value; that is, we set the January 2023 value to 100 and rescale each subsequent data point in the series accordingly. We then assess how well the public data series aligns with the corresponding private data series using regression analysis. A regression coefficient of 1 would reflect perfect alignment on average between the BLS data and whichever private data series is analyzed, while the magnitude of a coefficient’s difference, positive or negative, from 1 reflects the extent of the misalignment between the public and private data series.9 In our discussion of potential reasons for misalignment, we use the same regression approach to test whether accounting for a given factor improves the alignment.
Employment Data Are Less Aligned in the Region than in the Nation
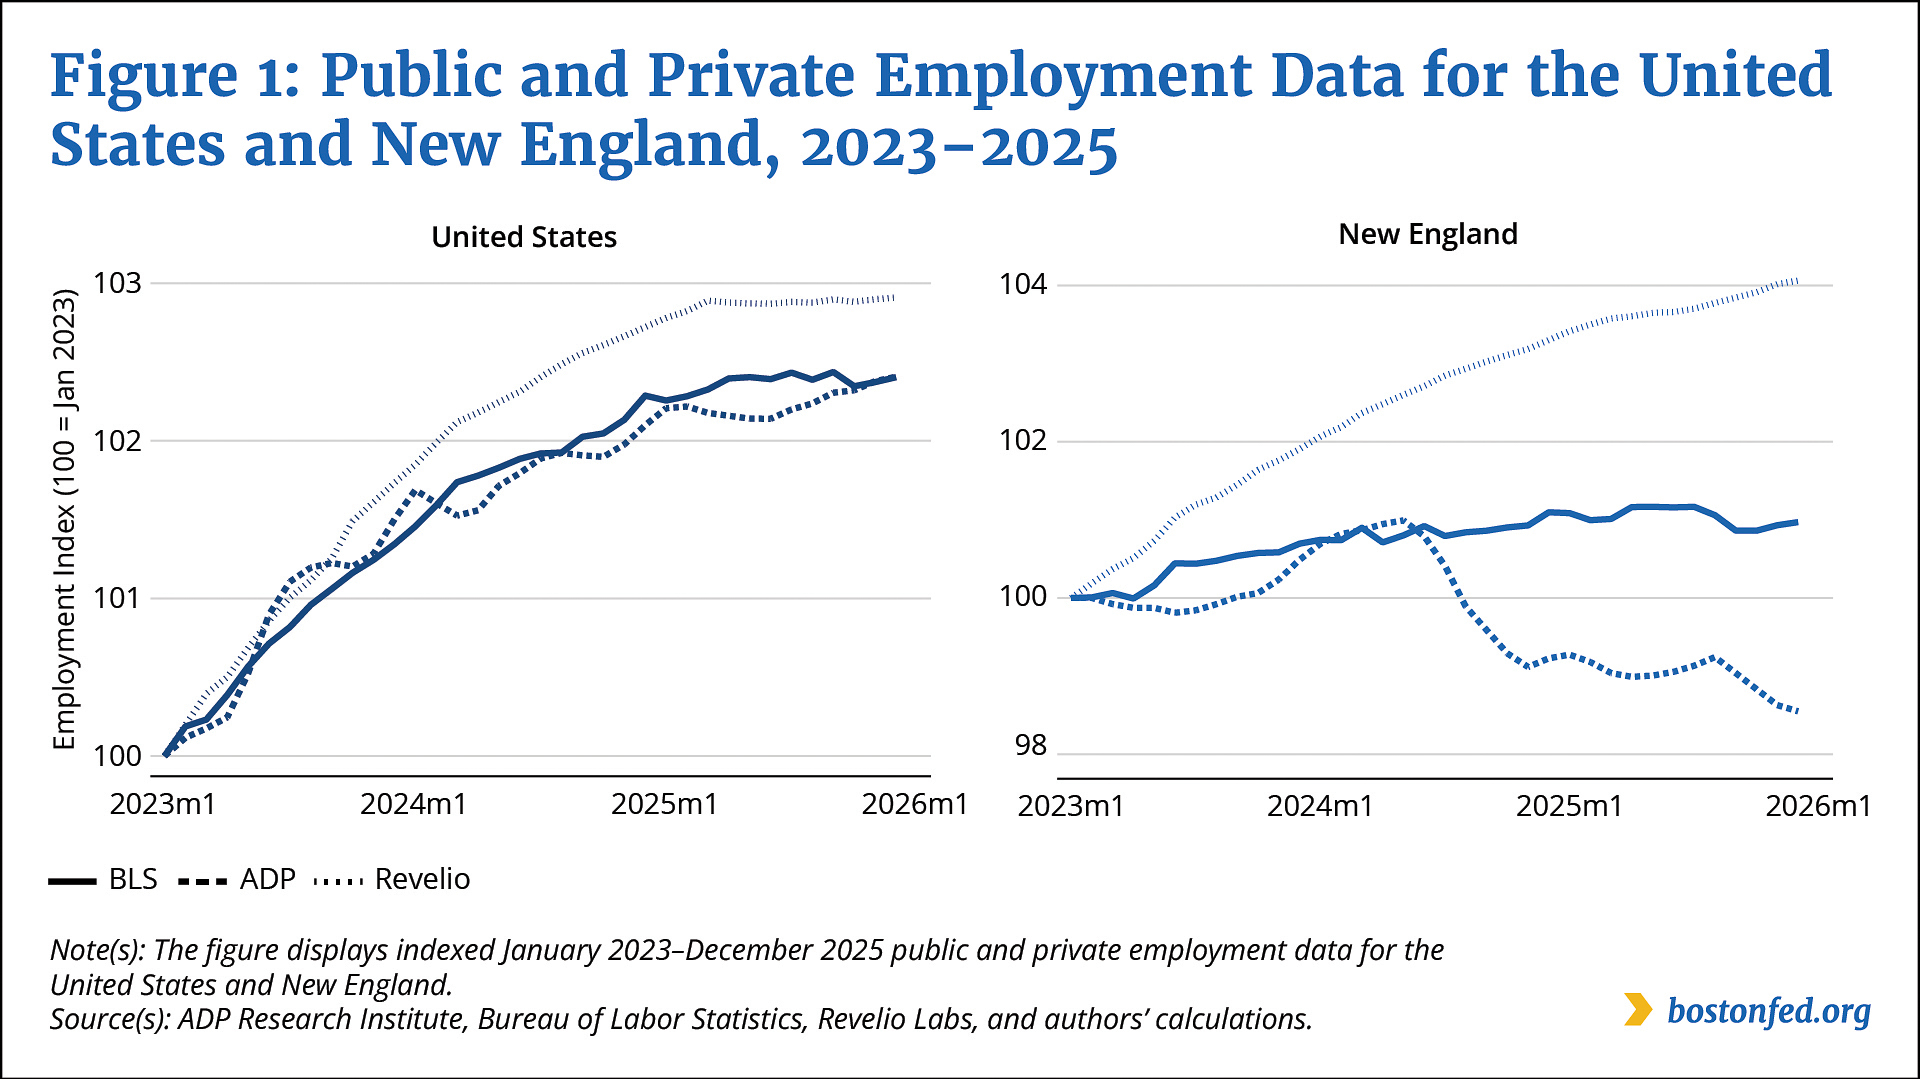
Figure 1 displays indexed January 2023–December 2025 employment data from the BLS, ADP, and Revelio for the United States and New England. According to the BLS data, US employment grew 2.4 percent from January 2023 to December 2025. The private data show similar qualitative and quantitative patterns over that period: 2.4 percent growth according to ADP and 2.9 percent growth according to Revelio. However, the public and private data series for employment in New England are not aligned. According to the BLS data, employment in New England grew 1.0 percent from January 2023 to December 2025, but according to the Revelio data, regional employment grew four times faster, at 4.1 percent. ADP data, on the other hand, indicate a decline in regional employment of 1.5 percent (–1.5 percent growth).
Federal Reserve Bank of Boston
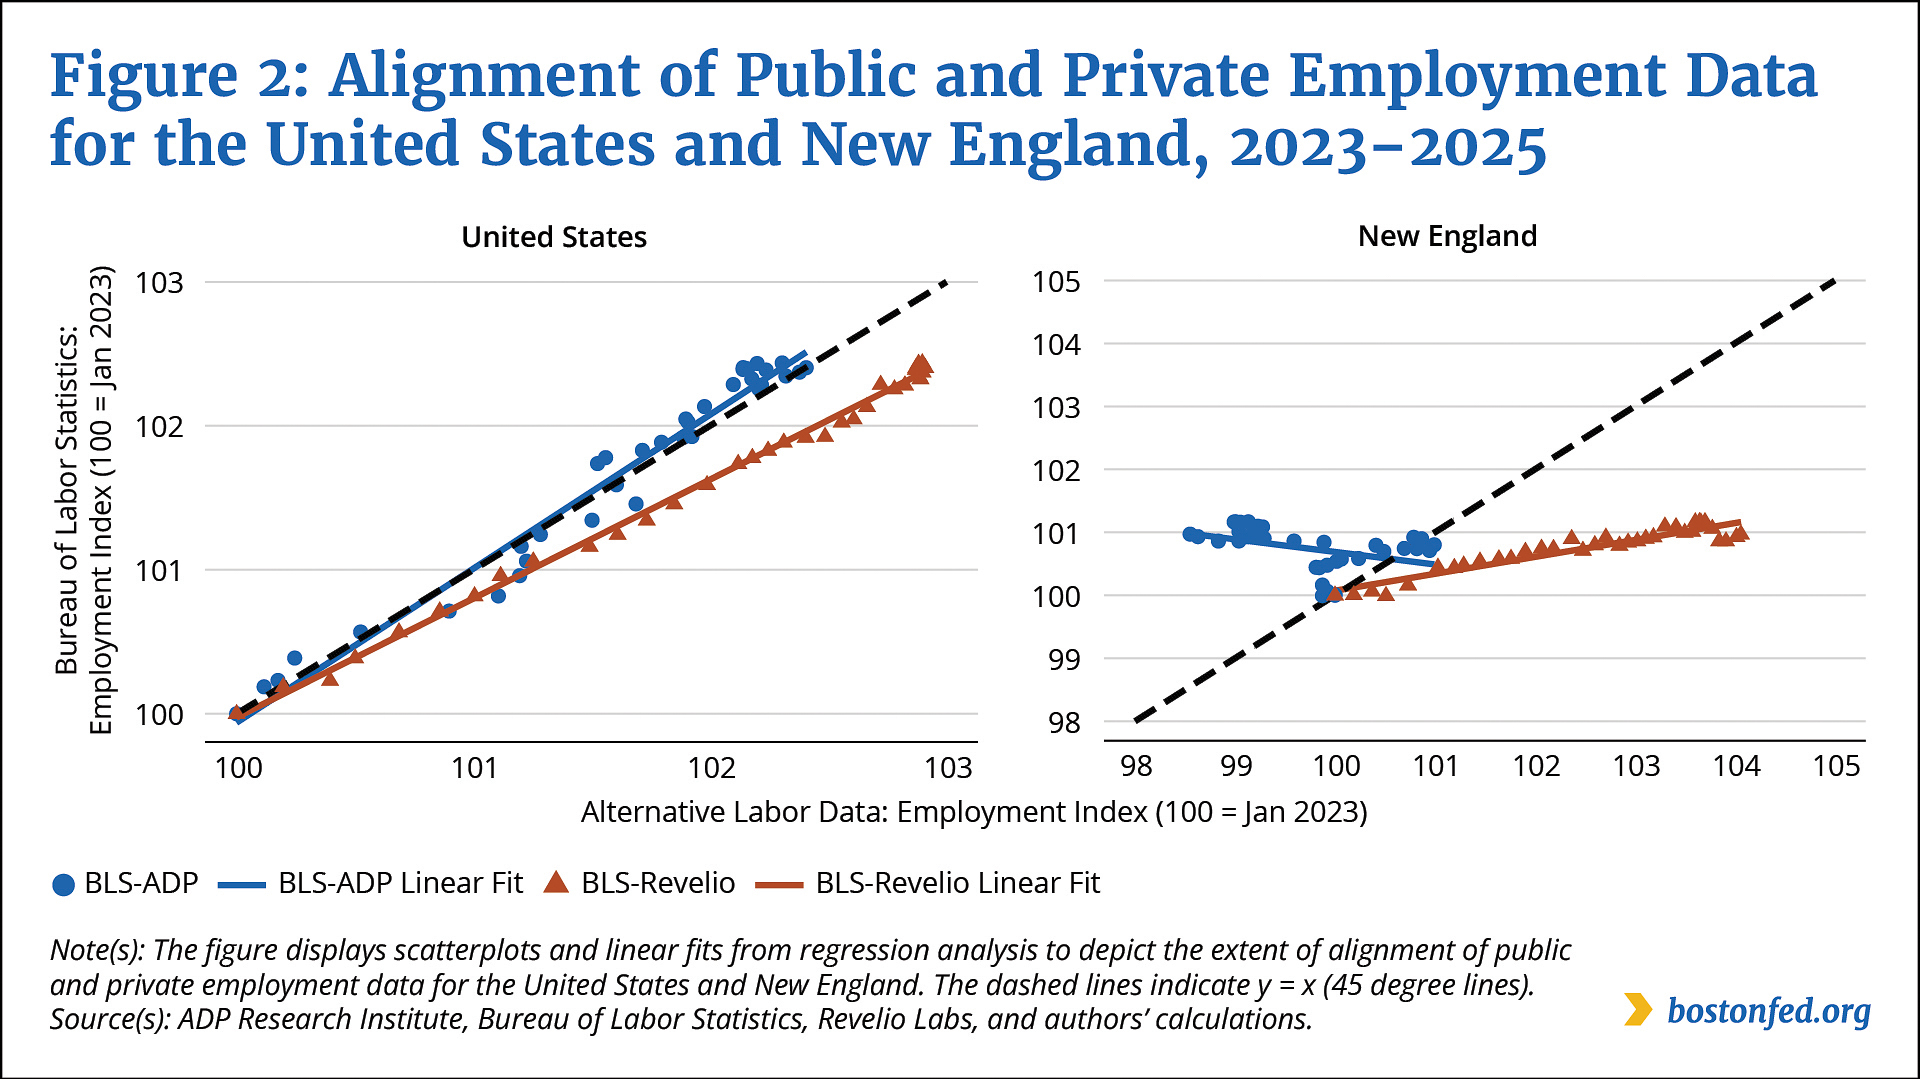
In Figure 2, the scatterplots and linear fits from our regression analysis further depict the alignment and misalignment of the data series. The public and private employment data for the United States exhibit similar trends during the sample period, as the linear fits for both comparisons (BLS with ADP and BLS with Revelio) closely match the 45 degree line (top panel). Accordingly, the ADP regression coefficient of 1.07 and the Revelio coefficient of 0.83 are both close to 1; the absolute differences from 1 are 0.07 and 0.17, respectively. Using the ADP data as an example, we can interpret our findings to mean that if the ADP data indicate 10 percent employment growth above baseline on average, then the BLS data show a strongly associated average growth rate of 10.7 percent.
Federal Reserve Bank of Boston
The bottom panel of Figure 2 depicts the relative misalignment of the public and private employment data for New England. The coefficients are –0.20 for ADP and 0.27 for Revelio, and the absolute differences from 1 are 1.20 and 0.73, respectively. Thus, compared with the US private data, the New England analogs deviate from the public data approximately four to 17 times as much, depending on the private series.10
Federal Reserve Bank of Boston
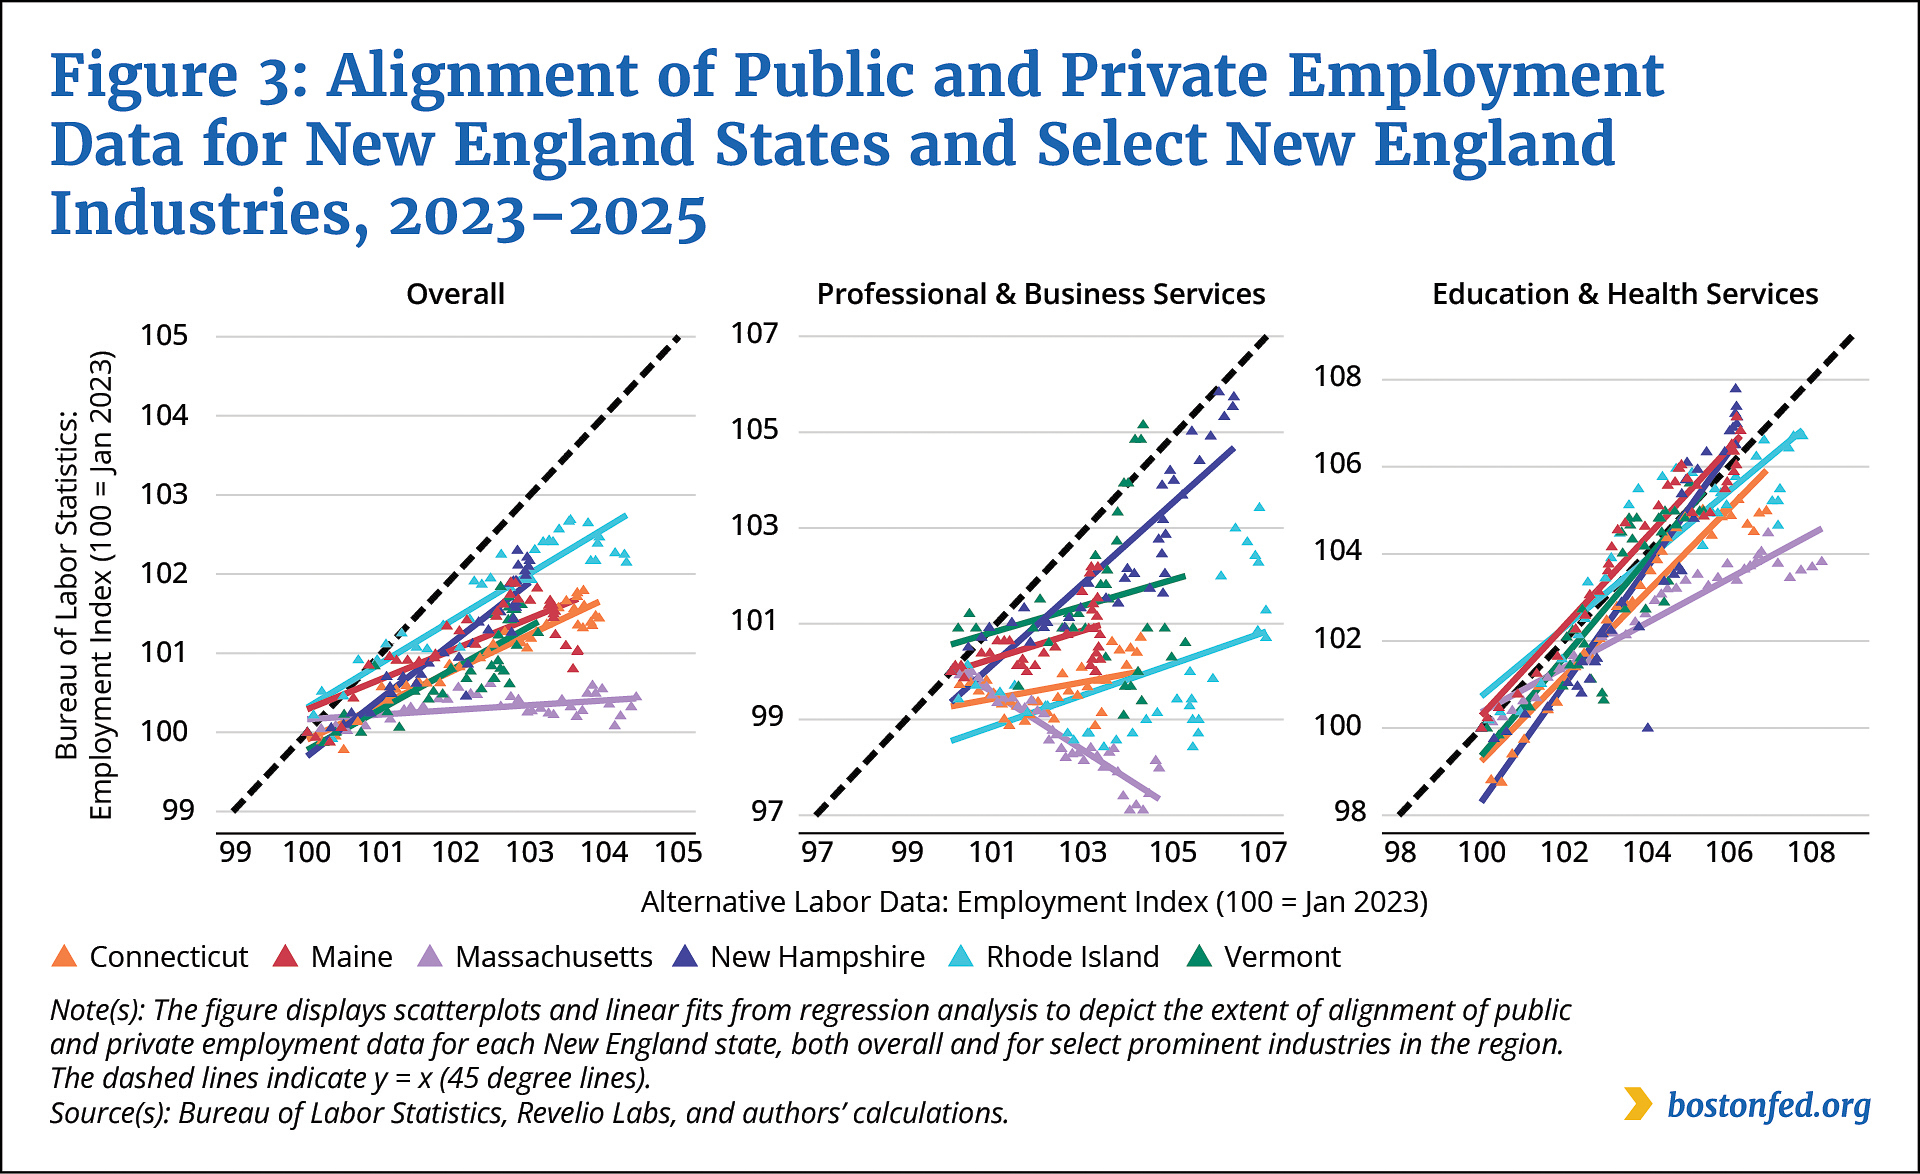
Figure 3 depicts the alignment of public and private employment data for each New England state, both overall and for select prominent industries in the region.11 Revelio is the sole source of private data for this analysis because state-level data are not available from ADP. The overall patterns vary across the states; the private data are most aligned with the public data for New Hampshire (0.73 coefficient) and least aligned for Massachusetts (0.06 coefficient). Broadly similar patterns hold for comparisons of public and private data on professional and business services, with the sectoral data for New Hampshire most aligned (0.85 coefficient) and the sectoral data for Massachusetts least aligned (–0.60 coefficient). By contrast, the public and private employment data for education and health services are qualitatively and quantitatively similar across states, with the Maine data most aligned and the Massachusetts data least aligned (coefficients of 1.02 and 0.51, respectively).
Alignment of Job Postings Data Varies across New England States
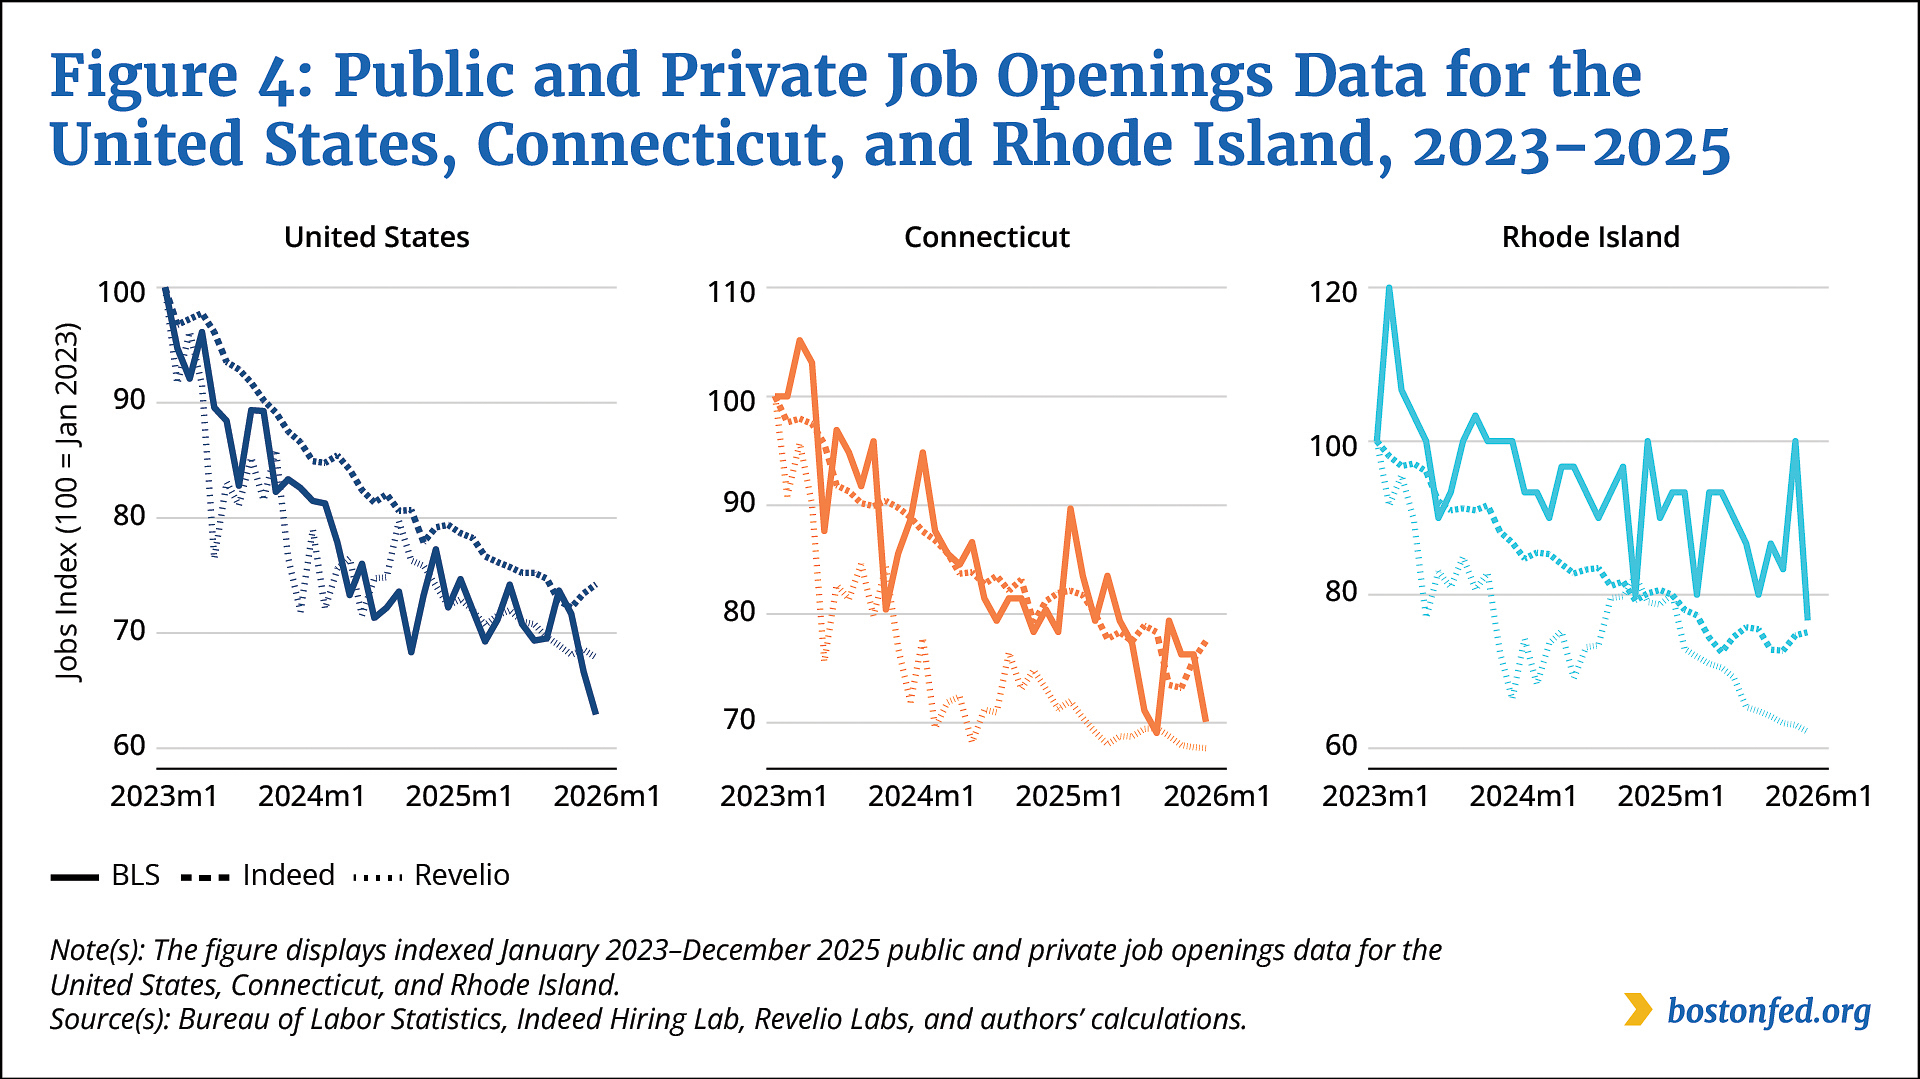
Figure 4 shows indexed January 2023–December 2025 job postings data for the United States and select New England states (aggregate regional data are either not available or cannot be readily determined), revealing patterns that are similar to those of the employment data. Nationally, the BLS data indicate that job openings decreased 37.1 percent during the sample period. The private data also show job openings declining nationally, but more moderately—25.8 percent according to Indeed and 32.1 percent according to Revelio. The public and private job openings data for Connecticut are strongly aligned: The BLS data show a 29.9 percent decline over the 2023–2025 period, while the Indeed data show a decline of 22.5 percent, and the Revelio data show a decline of 32.3 percent. Job openings data for Rhode Island, by contrast, diverge notably: The BLS and Indeed data indicate declines of 23.3 and 24.9 percent, respectively, while the Revelio data show job openings falling by 37.8 percent.
Federal Reserve Bank of Boston
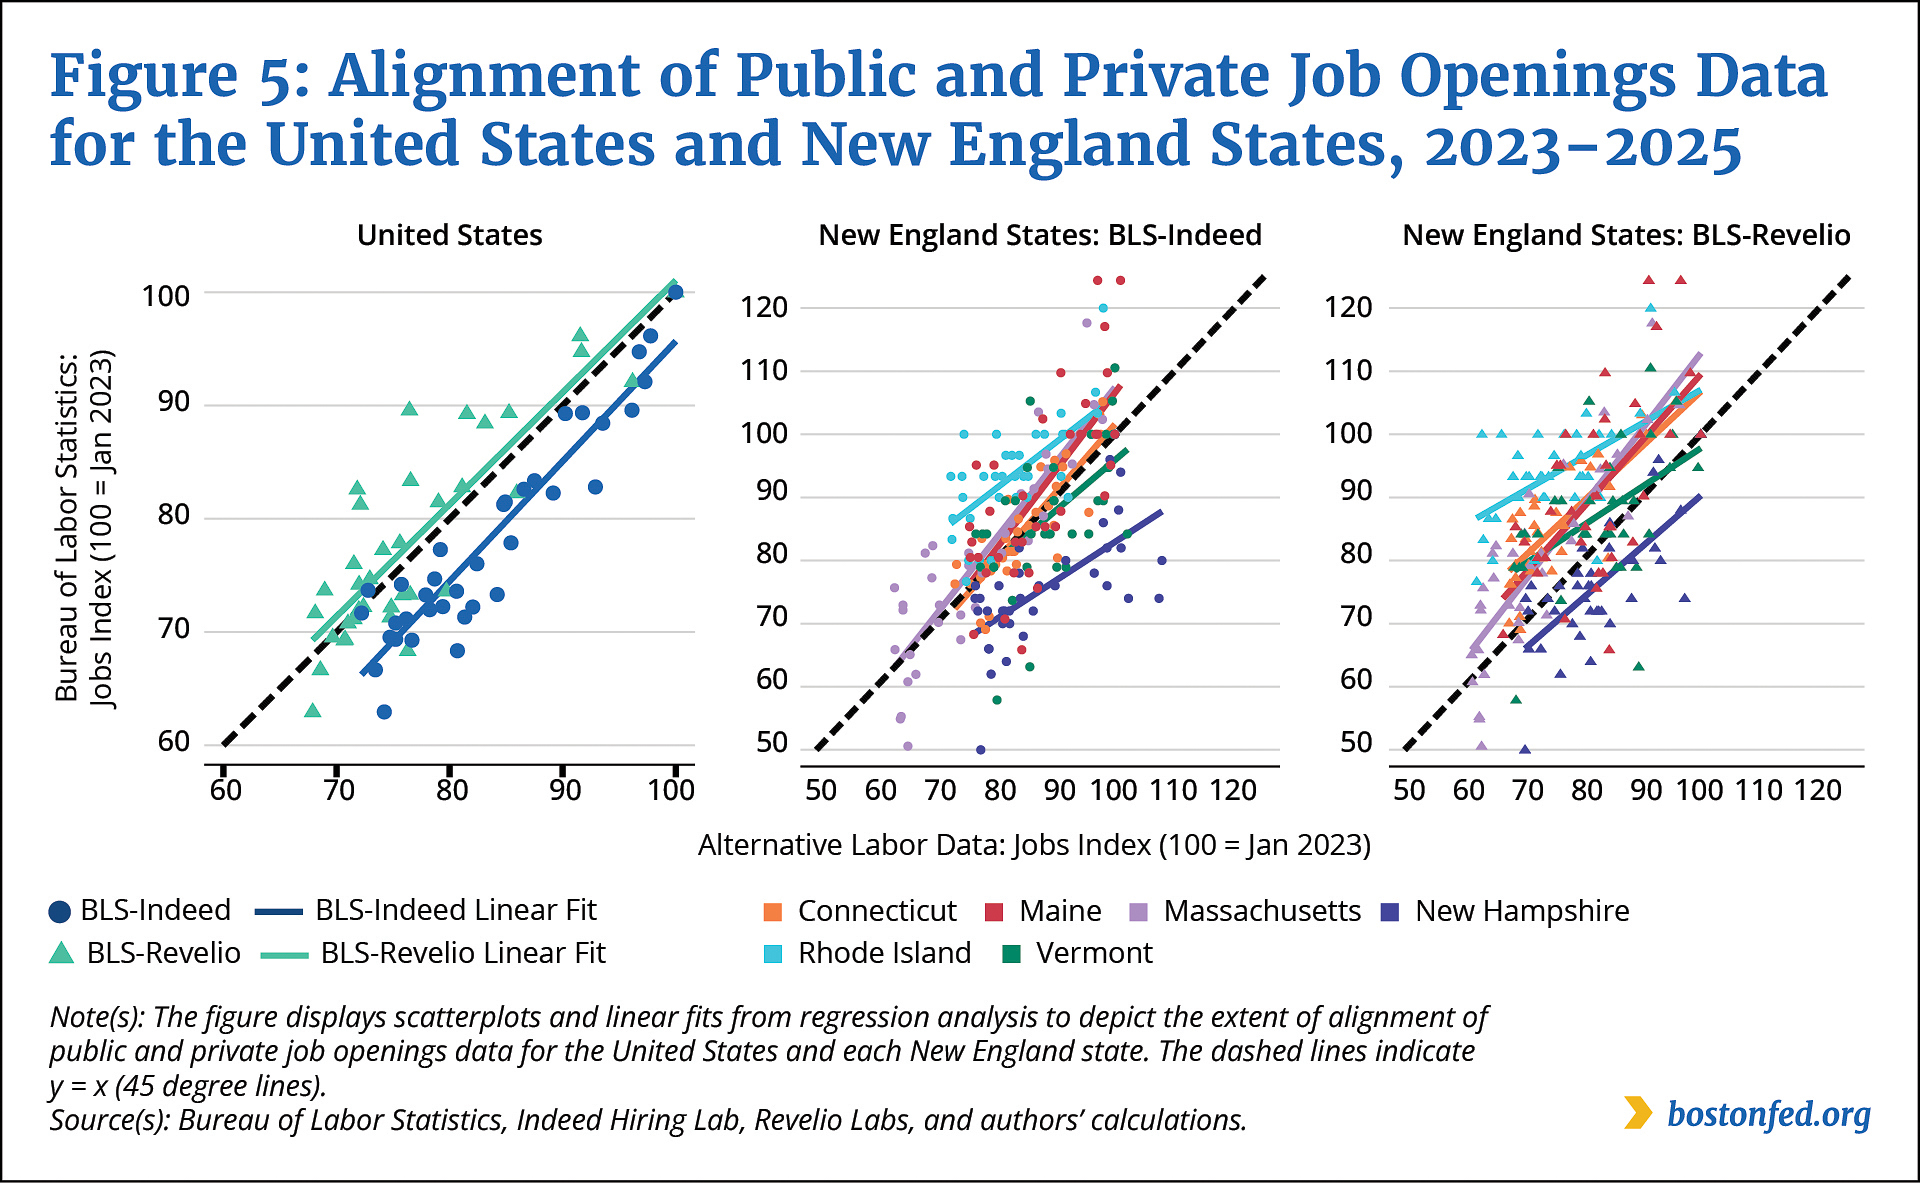
The scatterplots and linear fits in Figure 5 confirm the patterns in the time series plots. At the national level, the private series closely fit the public data, with coefficients of 1.06 (Indeed) and 0.99 (Revelio). In Connecticut, the public and private data align closely. With coefficients of 1.09 for Indeed and 0.88 for Revelio, each linear fit is nearly parallel to the 45 degree line. By contrast, the public and private data for Rhode Island diverge substantially. The coefficients of 0.73 for the Indeed data and 0.54 for the Revelio data indicate that both overstate the decline in job openings relative to the BLS series.
Federal Reserve Bank of Boston
Methodological Differences May Contribute to the Misalignment
The public labor market data we analyze differ from the private data in scope. With respect to employment, the BLS CES reflects public and private employers, while ADP covers only the private sector through its payroll accounts. Revelio draws on online professional profiles, making it potentially more matched to household information than to payroll information. To assess whether these differences contribute to misalignment, we substitute the BLS CES series with two alternative BLS measures in our regression analysis: the CES restricted to private employment and the Current Population Survey (CPS), which is a survey of households.12
Restricting the BLS series to private employment modestly worsens its alignment with the ADP data nationally; that is, the coefficient moves further from 1 (0.89 versus 1.07 with the full BLS CES). Restricting the BLS series has little effect on its alignment with the ADP data for New England (a coefficient of –0.15 versus a coefficient of –0.20 with the full BLS CES), suggesting that ADP’s private-sector scope does not explain why its New England data diverge more than its national data from the BLS data.
The BLS CPS comparison yields similarly inconclusive results: For New England, the Revelio employment data are more aligned with the BLS CPS data than with the BLS CES data (a coefficient of 0.54 versus a coefficient of 0.27), while the alignment at the national level changes only negligibly (from a coefficient of 0.83 to a coefficient of 0.82). State-level results vary. Using the BLS CPS survey data instead of the BLS CES data improves the public–private data alignment markedly for Massachusetts (from a coefficient of 0.06 to a coefficient of 0.71) but generally worsens it for most of the other New England states.
Seasonal adjustment is intended to remove the influence of predictable seasonal patterns from a data series, revealing the variation that is unaffected by seasonal factors. Because each data source implements seasonal adjustment differently—by both method and frequency—these differences could contribute to the misalignment of the public and private data.13 We test this mechanism by using versions of the data that are not seasonally adjusted in our regression analysis.
For employment, removing seasonal adjustment improves the alignment between the BLS and Revelio data at the national level (the coefficient changes from 0.83 to 1.01) and regionally (from 0.27 to 0.58); the results for the ADP data are mixed, with the alignment worsening nationally (1.07 to 0.78) and improving regionally (–0.20 to 0.64). For job postings, regressions using data with no seasonal adjustment likewise produce mixed results, with the alignment between the BLS data and each of the two private data series worsening at the national level and for most New England states but improving for Rhode Island.
Differential seasonal adjustment methods may therefore explain some of the data misalignment, particularly for regional employment, for which the alignment of the public and private data consistently improves in the absence of seasonal adjustment.
Measurement Error Also May Play a Role in the Misalignment
The data misalignment also could result from area-specific measurement error—inaccuracies in attributing employment or job postings to the correct state, which would not distort national data but could affect regional and state data. We use the number of states bordering each New England state as a rough proxy for the probability of such error. The proxy yields a moderate, positive correlation with the misalignment of BLS and Revelio state-level employment data (a correlation of 0.51) and weaker correlations with the misalignment of BLS and Revelio or Indeed state-level job postings data (correlations of 0.08 for Revelio and –0.19 for Indeed). However, none of these correlations is statistically significant. This coarse assessment thus offers some suggestive evidence of a role for area-specific measurement error in the employment analysis, but it should be interpreted with caution, because different proxies yield distinct results.14
Each year, the BLS benchmarks the CES (and other select data series), re-estimating the preceding year’s employment statistics to so that the CES survey sample aligns more closely with the universe of employees in administrative unemployment insurance data.15 We find that the revisions to the national BLS data negligibly affect the alignment with the private data, as expected given that the national revisions were released on February 11, 2026, before we acquired the BLS data for our main analysis. But for New England, the findings are mixed. The revised BLS data, relative to the original data, are more aligned with the ADP series but slightly less aligned with the Revelio series. We also find mixed results for the state-level employment data.16
Given the recent emergence of alternative, privately provided labor market data, understanding the benefits and limitations of these series is critical for policy decisions within New England. Such data can provide timely insights into regional labor market conditions when traditional, publicly provided data are unavailable or available at a more limited frequency. (Note that, for example, in July 2026, the BLS state-level Job Openings and Labor Turnover Survey transitioned from a monthly news release to an annual news release.17)
However, relative to conducting US analysis, additional caution is warranted by researchers and policymakers when using private labor market data for regional analysis. While private and public national data closely align, such data for New England or the New England states often deviate considerably and in idiosyncratic ways. Thus, the use of private data merits consideration of timeliness requirements, the geography of interest, and the acceptable margin of error.
Endnotes
- See “Transcript of Chair Powell’s Press Conference: July 30, 2025,” Federal Reserve Board of Governors.
- See Ben Miller and Melinda Pitts, “More than Missing Data: Survey Response Rates Following the 2025 Government Shutdown,” Federal Reserve Bank of Atlanta, April 9, 2026; Tim Sablik, “Good Data Is Hard to Find,” Econ Focus, Federal Reserve Bank of Richmond, First/Second Quarter 2025; “Discontinued CPI and AP Series,” US Bureau of Labor Statistics (which indicates, among other items, the lack of availability of fuel and utilities as a component of the Consumer Price Index series at the census-division level after 2024); and “Revised News Release Dates Following the 2025 and 2026 Lapses in Appropriations,” US Bureau of Labor Statistics.
- See Ben Casselman, “The Jobs Report Is Canceled. Here’s What Private Data Shows,” New York Times, November 7, 2025; Konrad Putzier, “The Unofficial Jobs Numbers Are In and It’s Rough Out There,” Wall Street Journal, October 8, 2025; and “Chairman's Task Forces for Advancing Monetary Policy: Data Sources,” Federal Reserve Board of Governors, accessed on August 15, 2026.
- See “The Problem with America’s Shutdown Economy,” The Economist, November 9, 2025.
- See Nick Hall and Osborne Jackson, “New England Economic Conditions through November 18, 2025,” Federal Reserve Bank of Boston.
- The Current Employment Statistics (CES) produced by the US Bureau of Labor Statistics (BLS) are monthly survey data on employment, hours, and earnings from a sample of nonfarm establishments—about 119,000 businesses and government agencies (that is, private and public sectors) reflecting approximately 622,000 individual worksites and 26 percent of nonfarm payroll employees. These data, with origins dating to 1915, reference the pay period that includes the 12th of the month. Survey estimates are subject to revision for two months after their initial release and are also revised annually through benchmarking to the Quarterly Census of Employment and Wages (QCEW), which covers about 97 percent of US jobs. See “Handbook of Methods: Current Employment Statistics (Overview),” “Handbook of Methods: Current Employment Statistics (History),” “Technical Notes for the CES National Benchmark,” and “CES National Benchmark Article,” Bureau of Labor Statistics.
The National Employment Report produced by the ADP Research Institute is a monthly snapshot of private sector employment drawn from weekly payroll data that reflect more than 500,000 companies and more than 26 million workers, corresponding to roughly 20 percent of the US private sector workforce. The report data, available from 2010 onward (including retooling in 2022), reference the pay period that includes the 12th of the month and are subject to revision for one month after their initial release. See “ADP National Employment Report,” ADP Research Institute (accessed May 24, 2026) and Cajner et al. (2018).
The Revelio Public Labor Statistics on employment produced by Revelio Labs are monthly individual-level data obtained from more than 100 million online professional profiles such as those available on LinkedIn (duplicates removed), reflecting approximately 65 percent of employed US workers in public and private nonfarm sectors. Estimates of the monthly change in employment are a proxy for jobs added or lost during the month and are available from 2021 onward, with all historical data subject to revision. See “Revelio Public Labor Statistics” (including a linked methodology document), Revelio Labs (accessed May 24, 2026). - The Job Openings and Labor Turnover Survey (JOLTS) produced by the BLS are monthly survey data on job openings, hires, and separations from a sample of approximately 21,000 nonfarm establishments in the private and public sectors. These data, with origins dating to 1998, have a reference period that corresponds to positions “open” on the last business day of the month. A position is considered open if (1) the job exists, and work is available for the position; (2) the job could start within 30 days; and (3) the employer is actively recruiting workers for the job from outside the establishment. Survey estimates are subject to revision for one month after their initial release and are also revised annually through benchmarking to reflect the annual revisions to the CES. Monthly news releases for state-level JOLTS data were halted after December 2025, shifting instead to annual news releases each July (starting July 2026) that comprise monthly data for the previous calendar year and incorporate benchmark revisions. See “Job Openings and Labor Turnover Survey Overview Page,” “Job Openings and Labor Turnover Survey: Data Definitions,” “Handbook of Methods: Job Openings and Labor Turnover Survey (Overview),” “Upcoming Change to the JOLTS State Estimates,” and “Handbook of Methods: Job Openings and Labor Turnover Survey (History),” Bureau of Labor Statistics (accessed May 24, 2026).
The Job Postings Index produced by the Indeed Hiring Lab is a seven-day trailing average of the change in the level of job openings since February 1, 2020. The postings correspond to data from publicly available employer career websites, applicant tracking systems, and other sources accessible on Indeed’s website (duplicates removed), reflecting private and public sectors. We focus on the last calendar day of each month to align with other job-postings data available at a monthly frequency. Available documentation from Indeed does not indicate the frequency of revision, if any, for its historical data. See “Indeed Data Frequently Asked Questions,” Indeed Hiring Lab (accessed May 24, 2026).
The Revelio Public Labor Statistics on job postings produced by Revelio Labs are monthly data from company career pages, job boards such as LinkedIn and Indeed, and staffing firms (duplicates removed), reflecting public and private sectors. These data reference job postings that are active at any time during a given month (with any intended time horizon for hiring) and are available from 2022 onward, with all historical data subject to revision. See “Revelio Public Labor Statistics” (including a linked methodology document), Revelio Labs (accessed May 24, 2026). - Indeed job postings data are an exception. We accessed those data on April 20, 2026. We accessed the BLS employment and job postings data for the main analysis on February 23, 2026. The early-April timing noted in the text is before BLS state-level employment data were released on April 8, 2026, with revisions from annual benchmarking (national employment analogs were released by the BLS on February 11, 2026) and likewise before the July 2026 release of BLS state-level job postings data with benchmark revisions (national job postings analogs were released by the BLS on March 13, 2026). For current and historical BLS data releases, see “Release Calendar” (accessed May 24, 2026).
- Although one could, we ultimately do not give secondary consideration to the standard errors from these ordinary least squares regressions (estimated assuming homoskedasticity), which reflect the precision of alignment.
- The New England-to-United States ratio of absolute differences from one for the employment regression coefficients is 1.200/0.069 = 17.391 for ADP and 0.732/0.174 = 4.207 for Revelio. Note that these absolute differences can be framed as percentage differences instead by multiplying them by 100. For instance, the ADP employment regression coefficient for the nation differs absolutely from one by 6.9 percent. This result means that on average, US employment growth since January 2023 based on ADP data differs absolutely from such growth based on BLS data by 6.9 percent.
- Using data from the US Bureau of Economic Analysis, we define “prominent industries” based on industry employment shares in 2022, before the analysis period. In New England, education and health services comprised a 21.1 percent employment share, while professional and business services comprised a 14.8 percent employment share. They ranked first and third, respectively, in employment shares among the broad industry categories we analyzed.
- See “Labor Force Statistics from the Current Population Survey Overview,” US Bureau of Labor Statistics (accessed May 24, 2026). The Current Population Survey (CPS and also known as the household survey) is a monthly survey of approximately 60,000 eligible households, conducted by the US Census Bureau for the BLS, that classifies respondents as employed, unemployed, or not in the labor force. Unlike the CES and ADP, which derive employment counts from employer payroll records, the CPS captures employment as reported by individual workers—a design more conceptually analogous to Revelio's individual-level online profile data. We accessed the CPS microdata as provided by the Minnesota Population Center through IPUMS (Flood et al. 2025).
- The BLS CES has used the X-13ARIMA-SEATS program for its seasonal adjustment since 2015, while Revelio uses “Season-Trend decomposition using LOESS.” Both are performed at a monthly frequency. See “Seasonal Adjustment Methodology for National Labor Force Statistics from the CPS,” US Bureau of Labor Statistics (accessed May 24, 2026); and “Revelio Public Labor Statistics (RPLS) Methodology,” Revelio Labs (accessed May 24, 2026). ADP seasonal adjustment occurs at a weekly frequency and follows the protocol outlined in Cleveland and Scott (2007). See Nela Richardson and Tim Decker, “Five Things to Know about the January ADP Employment Report,” Main Street Macro blog, ADP Research Institute, February 10, 2026. Indeed seasonally adjusts at a daily frequency, following the methodology from Ollech (2018). See “Indeed Job Posting Index,” Indeed Hiring Lab (accessed May 24, 2026).
- We investigate several other possible proxies for area-specific measurement error. Because the proposed measurement error mechanism derives from inaccuracy in locations, it is plausibly correlated with measures of interstate workers. We define three proxies using pooled American Community Survey (ACS) samples from 2021 and 2022 (Ruggles et al. 2025), before the analysis period: (1) the share of the aged 16 and older employed population that resides in the applicable New England state but works in any other US state, (2) the share of the aged 16 and older employed workers in the applicable New England state who reside in any other US state, and (3) a sum of those measures. We create a second set of those proxies for which “other US state” is restricted to New England states and New York. The resulting correlations with the state-level imperfect alignment are unexpectedly negative and often not statistically significant, potentially reflecting confoundedness due to the use of observed commuting behavior.
- See “CES National Benchmark Article,” US Bureau of Labor Statistics (accessed May 24, 2026). As noted, the BLS annual benchmark revision re-estimates CES employment data for the preceding year using the QCEW as an independent administrative benchmark. Because the QCEW covers nearly all employers subject to unemployment insurance laws, it provides a more complete count of employment than the CES sample alone (approximately 97 percent of non-farm employment; other data sources are analyzed to cover the remaining 3 percent).
- The private data used throughout this analysis were released in 2026 on April 1 (ADP), April 2 (Revelio), and April 20 (Indeed). Like the BLS and as noted, private data providers may periodically revise their historical series as additional data become available or methodological changes are implemented. The results therefore reflect best estimates from each provider when the data were acquired and may differ from what would have been observed in real time using earlier data vintages.
- See “Upcoming Change to the JOLTS State Estimates,” US Bureau of Labor Statistics (accessed May 24, 2026).
References
Cajner, Tomaz, Leland Crane, Ryan Decker, Adrian Hamins-Puertolas, Christpher Kurz, and Tyler Radler. 2018. “Using Payroll Processor Microdata to Measure Aggregate Labor Market Activity.” Finance and Economics Discussion Series 2018-005. Washington: Board of Governors of the Federal Reserve System.
Cleveland, William P., and Stuart Scott. 2007. “Seasonal Adjustment of Weekly Time Series with Application to Unemployment Insurance Claims and Steel Production.” Journal of Official Statistics 23(2): 209–221.
Flood, Sarah, Miriam King, Renae Rodgers, Steven Ruggles, J. Robert Warren, Daniel Backman, Etienne Breton, Grace Cooper, Julia A. Rivera Drew, Stephanie Richards, David Van Riper, and Kari C.W. Williams. 2025. IPUMS CPS: Version 13.0 [data set]. Minneapolis, MN: IPUMS.
Ollech, Daniel. 2018. “Seasonal Adjustment of Daily Time Series.” Deutsche Bundesbank Discussion Paper No 41/2018. Frankfurt: Deutsche Bundesbank.
Ruggles, Steven, Sarah Flood, Matthew Sobek, Daniel Backman, Grace Cooper, Julia A. Rivera Drew, Stephanie Richards, Renae Rodgers, Jonathan Schroeder, and Kari C.W. Williams. 2025. IPUMS USA: Version 16.0 [data set]. Minneapolis, MN: IPUMS.

 About the Authors
Nick Hall,
Federal Reserve Bank of Boston
Nick Hall was a senior research associate with the New England Public Policy Center in the Federal Reserve Bank of Boston Research Department when he coauthored this brief.
Osborne Jackson,
Federal Reserve Bank of Boston
Osborne Jackson is a principal economist with the New England Public Policy Center in the Federal Reserve Bank of Boston Research Department.
Email: Osborne.Jackson@bos.frb.org
Acknowledgments
The authors thank Jeff Thompson for his valuable suggestions and feedback. Larry Bean provided helpful edits.
Resources
Site Topics
Keywords
- New England ,
- NEPPC Regional Brief ,
- Labor Market ,
- seasonal adjustment ,
- private data