Yale Labor Survey - Report of October 14, 2020 for the week ending October 3, 2020 

Meghan Smith/Federal Reserve Bank of Boston


The Yale Labor Survey, a research project from Yale University’s Tobin Center for Economic Policy, is designed to provide policy makers and the public with real-time information about the US labor market. Its questions are modelled on those of the monthly BLS-Census Current Population Survey. The project has been designed and developed by researchers at Yale University, Stanford University, and the Boston Fed’s research department. Data are made available weekly at the websites of the Boston Fed and the Yale Labor Survey website at the Tobin Center. Background documentation for the Yale Labor Survey is available in Cowles Foundation Discussion Paper No. 2243. The Yale Labor Survey is not an official forecast of the Federal Reserve Bank of Boston or its president, the Federal Reserve System, or the Federal Open Market Committee.
Results Summary
Current YLS results cover labor market activities through the week of September 27 to October 3. YLS data are not seasonally adjusted and refer to the population aged 20 and older. This week’s key findings are as follows:
- The YLS unemployment rate rose to 12.4% in the week ending October 3. It has risen 0.3 percentage point since the September CPS reference week (September 6-12).
- In official government data, “employment” includes (i) persons who “work for pay” during the reference week plus (ii) persons who are absent from work due to vacation, illness, or similar reasons. The YLS measures the ratio of work-for-pay to population (WFPR) and the employment-to-population ratio (EPR). The WFPR was 53.8% for the week ending October 3, essentially unchanged from the previous week. The EPR was 55.2%, down about ½ percentage point from the previous week.
- The labor force participation rate (LFPR) is estimated at 64.6% for the week ending October 3, down 0.3 percentage point from the previous week.
- Recently published CPS data for the September reference week suggest that labor market improvement was less rapid in that month than it was in August. For example, the CPS’s 20+ EPR rose by only 0.3 percentage point in September, after rising 1.2 percentage points in August. Similarly, the CPS’s UR fell 0.9 percentage point in September, after falling 1.8 percentage points in August. Slowing improvement in the job market appears more pronounced in the YLS. For example, as of the week ending October 3, the YLS UR is down only 0.9 percentage point relative to its mid-July value.
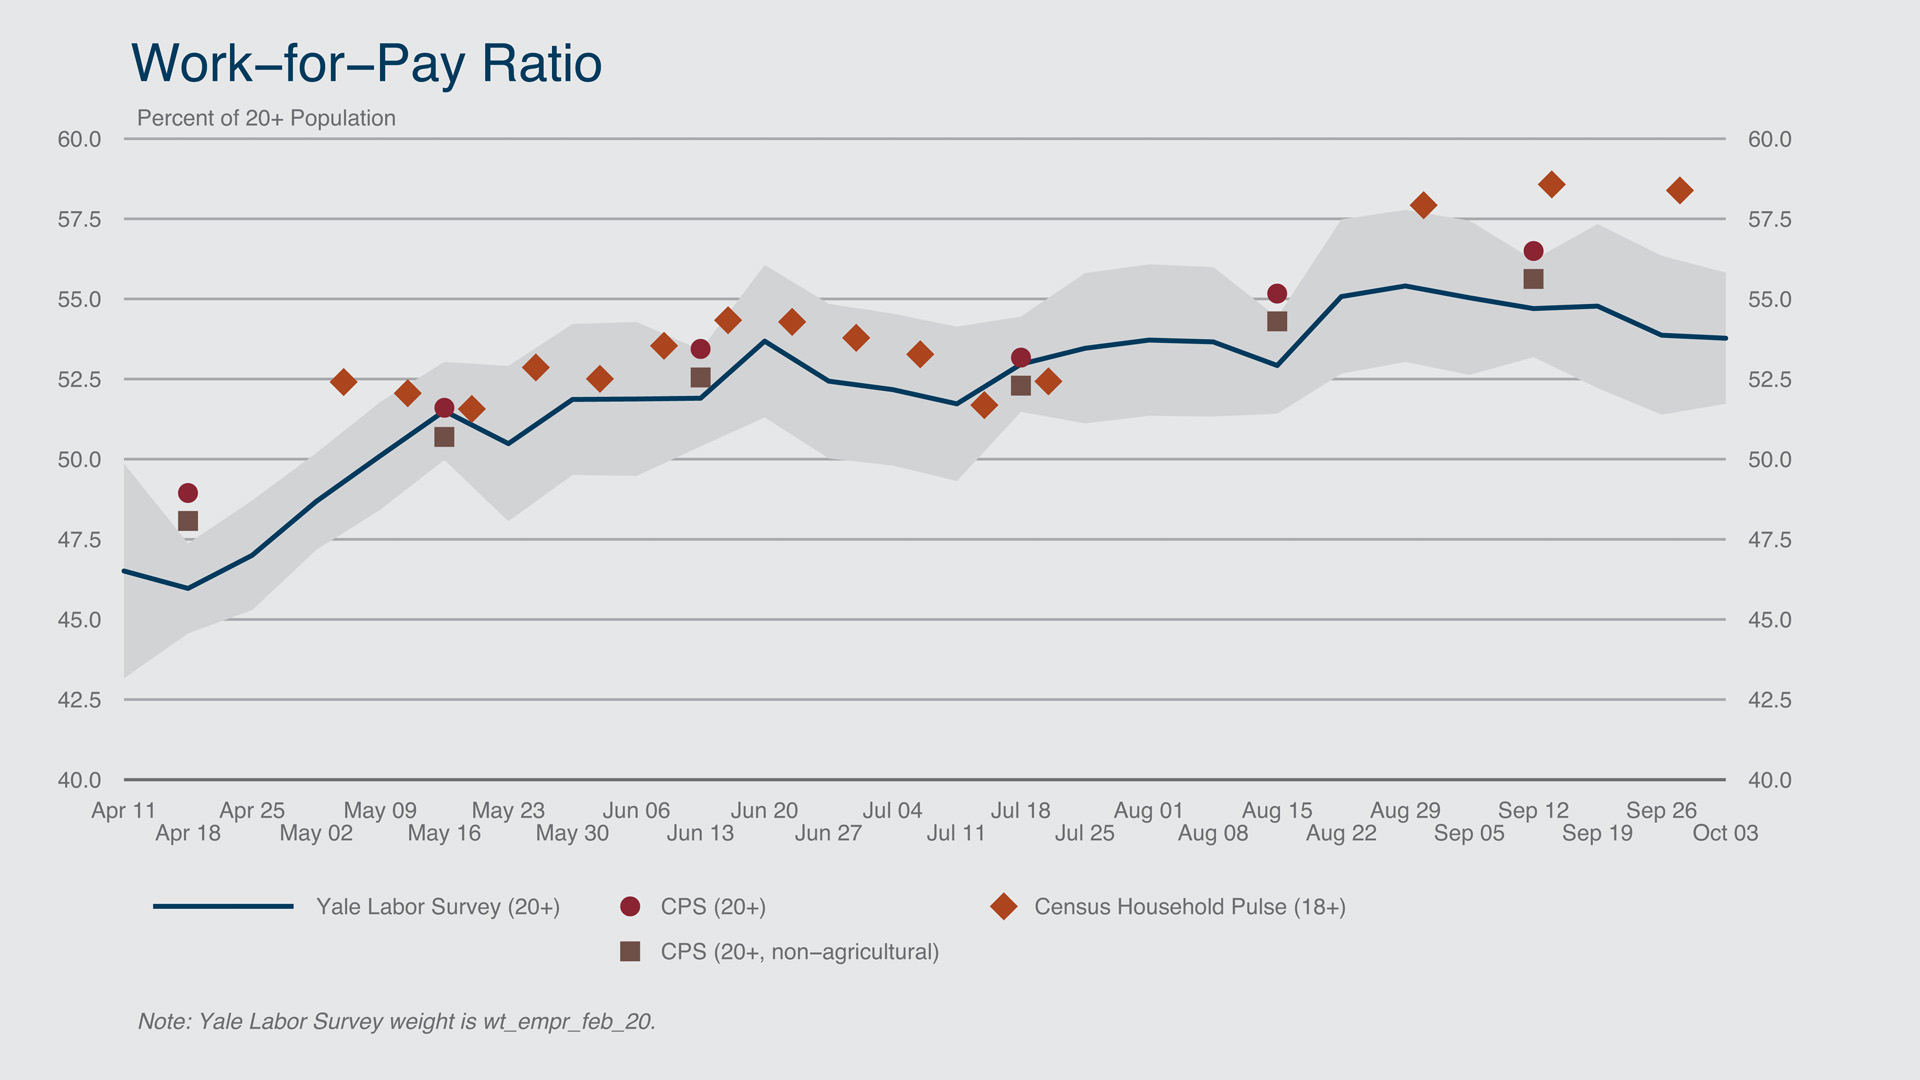
Work-for-Pay Ratio
The work-for-pay ratio (WFPR) measures the fraction of survey respondents who report that they worked for pay or profit during the reference week. After falling sharply when the pandemic hit, the WFPR rose quickly from late April through mid-June. For the week ending October 3, the YLS estimate of the 20+ WFPR was 53.8%, essentially unchanged from a 53.9% reading the previous week. Since the August CPS reference week, the YLS WFPR has risen by about 1 percentage point.
Federal Reserve Bank of Boston
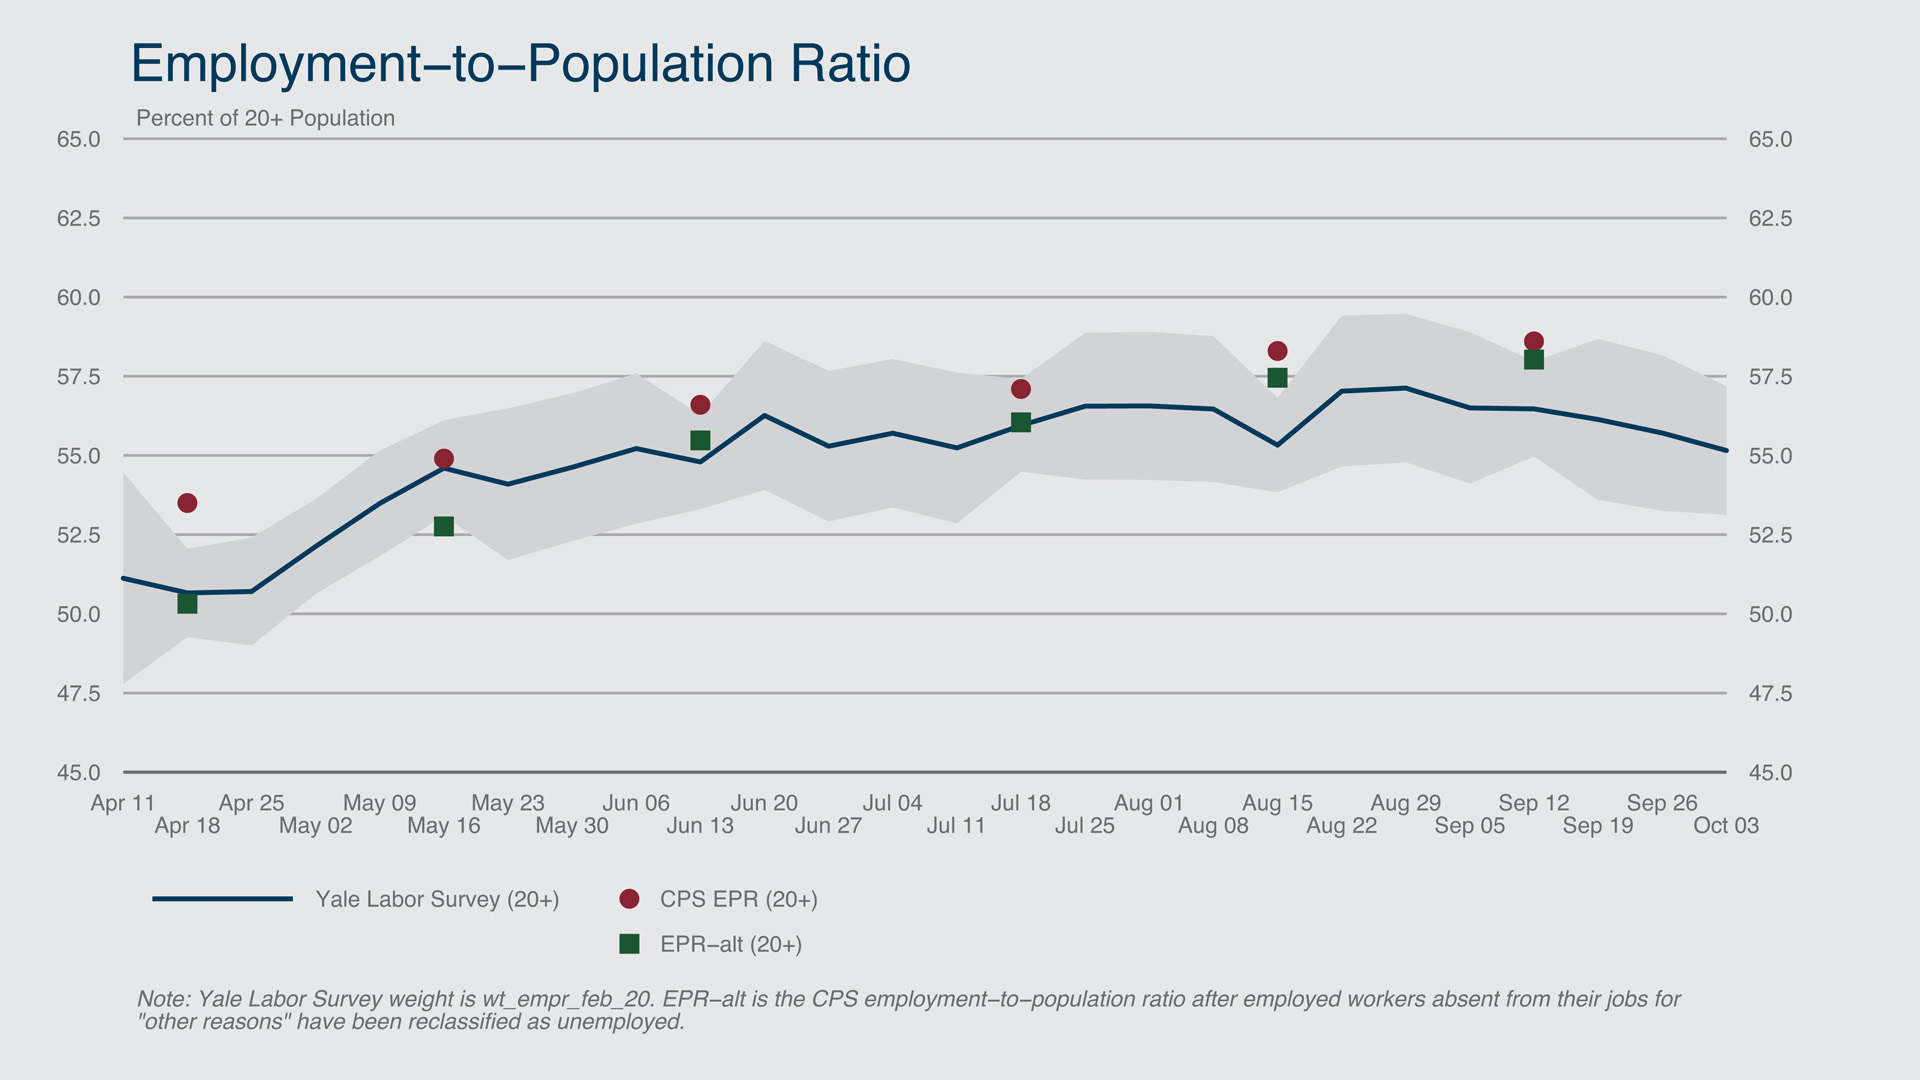
Employment-to-Population Ratio
The employment-to-population ratio (EPR) is the standard measure of labor market activity reported by the Bureau of Labor Statistics (BLS). In addition to persons working for pay, the EPR also includes workers who are absent from their regular jobs (for example, workers on vacation). For the week ending October 3, the YLS EPR was 55.2%, down from 55.7% the previous week.
During the pandemic, the BLS has stated that the CPS has had difficulty distinguishing between workers who were absent from their jobs for the usual reasons (such as vacation or illness) and workers who were displaced by the pandemic. An alternative measure of the government’s EPR calculated by YLS researchers with CPS microdata, “EPR-alt,” is designed to remove pandemic-displaced workers from CPS employment. The EPR-alt measure is close to the YLS definition of employment, which includes only paid absences and is therefore less susceptible to classification error (see the background documentation for details). The most recent CPS estimate for EPR-alt corresponds to the week of September 12-18, when this statistic reached 58.0%, about ½ percentage point higher than its level in mid-August.
Federal Reserve Bank of Boston
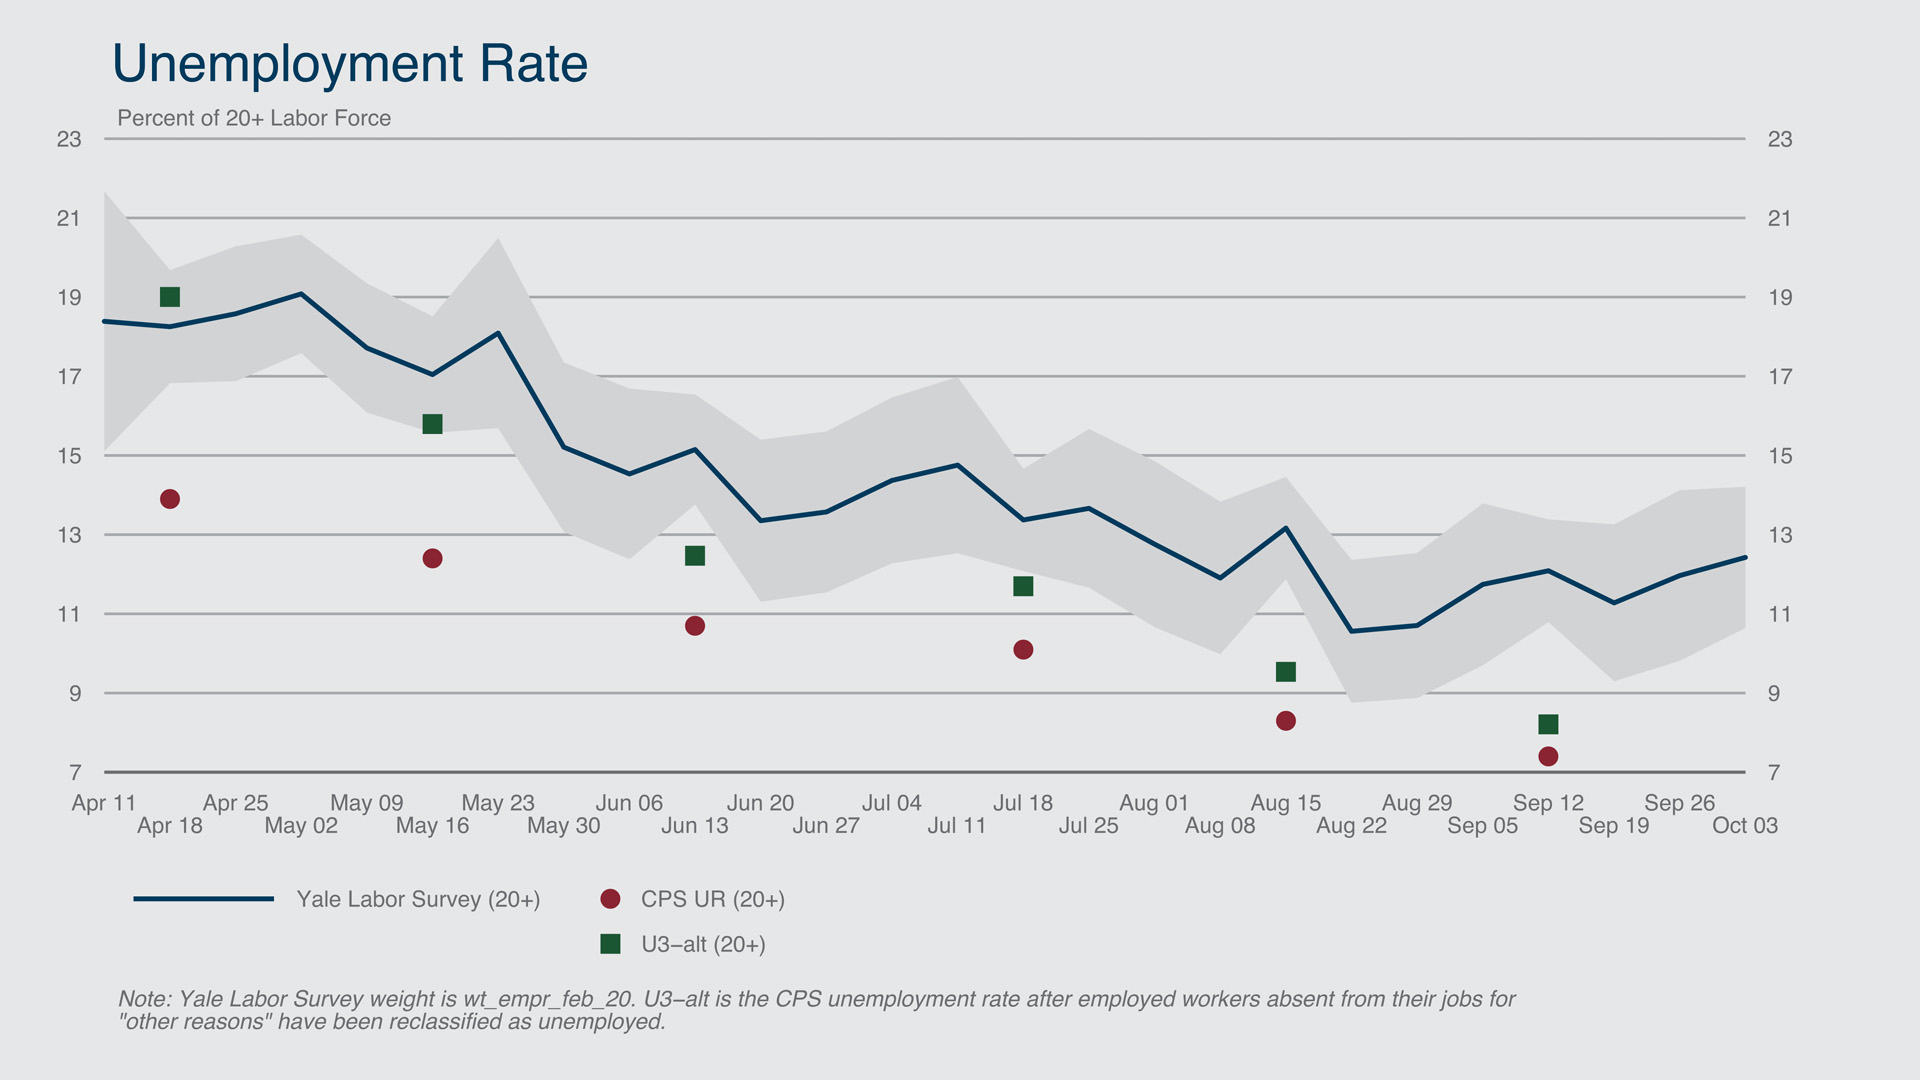
Unemployment Rate
The YLS has consistently overestimated the unemployment rate, although the divergence depends upon whether corrections for recent CPS classification errors discussed above are made. To be classified as unemployed, a non-employed person must either (i) have actively searched for a job in the last four weeks, or (ii) be laid off from a job with an expectation of return. The questions that gather information about job-search activities and layoff conditions differ slightly between the CPS and YLS.
Despite the differences, basic trends in CPS and YLS unemployment-rate estimates have been similar through most of the sample period. Unemployment fell significantly from April through June, consistent with the significant increase in employment that both surveys measure. However, since late August the YLS UR has drifted higher, reaching 12.4% in the week ending October 3. An adjusted version of the CPS UR (“U3-alt”) declined over much of this period, falling from 9.5% in mid-August to 8.2% in mid-September.
Federal Reserve Bank of Boston
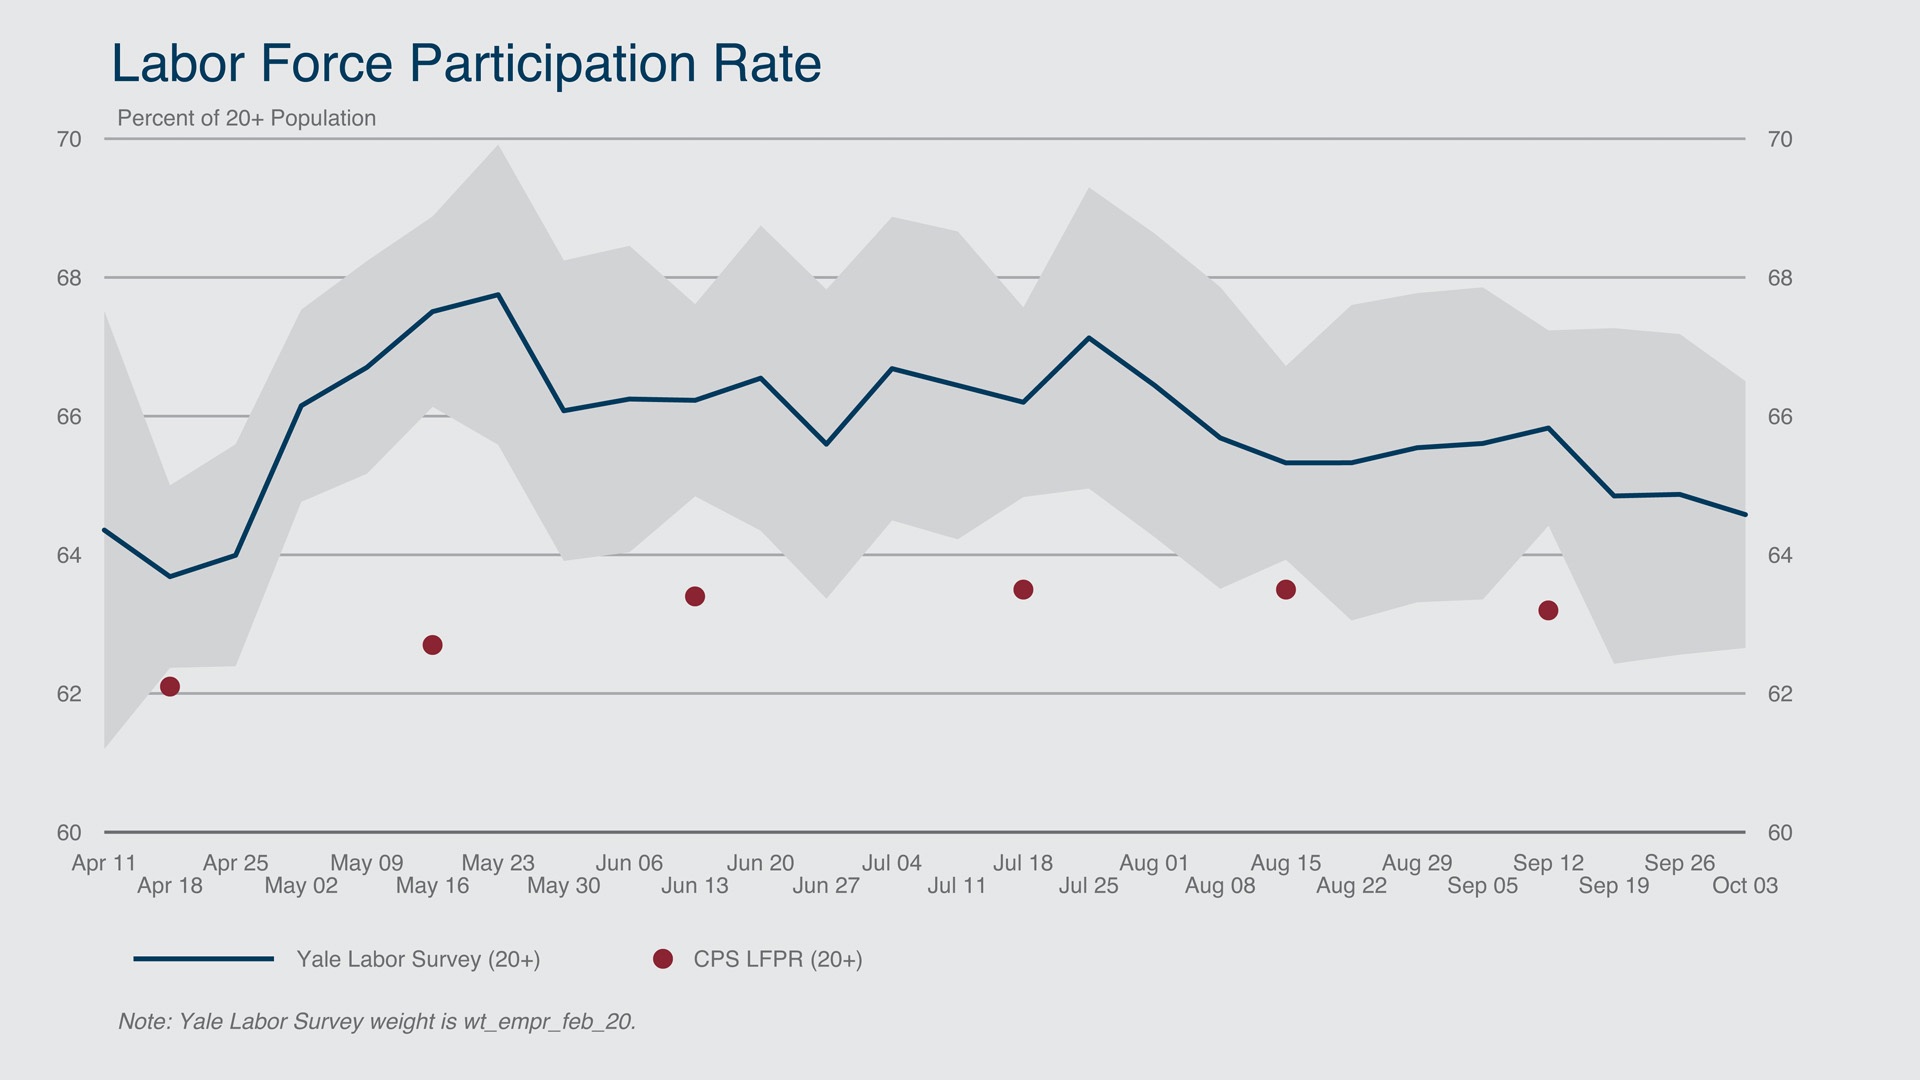
Labor Force Participation Rate
As of the week ending October 3, the YLS labor force participation rate (LFPR) stood at 64.6 percent, down 0.3 percentage point from the previous week. Over the entire sample period, the YLS participation rate has been higher than the corresponding CPS rate, although both series have been relatively stable in recent months.
Federal Reserve Bank of Boston
 collapse all
 expand all