Reassessing the U.S. Economy’s Vulnerability to Oil Shocks 


Federal Reserve Bank of Boston
The views expressed herein are solely those of the authors and should not be reported as representing the views of the Federal Reserve Bank of Boston, the principals of the Board of Governors, or the Federal Reserve System.
Since the start of the United States–Iran conflict in late February, few tankers have crossed the Strait of Hormuz, a chokepoint through which roughly one-fifth of the world’s seaborne oil trade normally passes. The effective closure of the strait has severely disrupted the supply of a commodity essential to modern economic functioning, triggering a sharp rise in global crude oil prices.
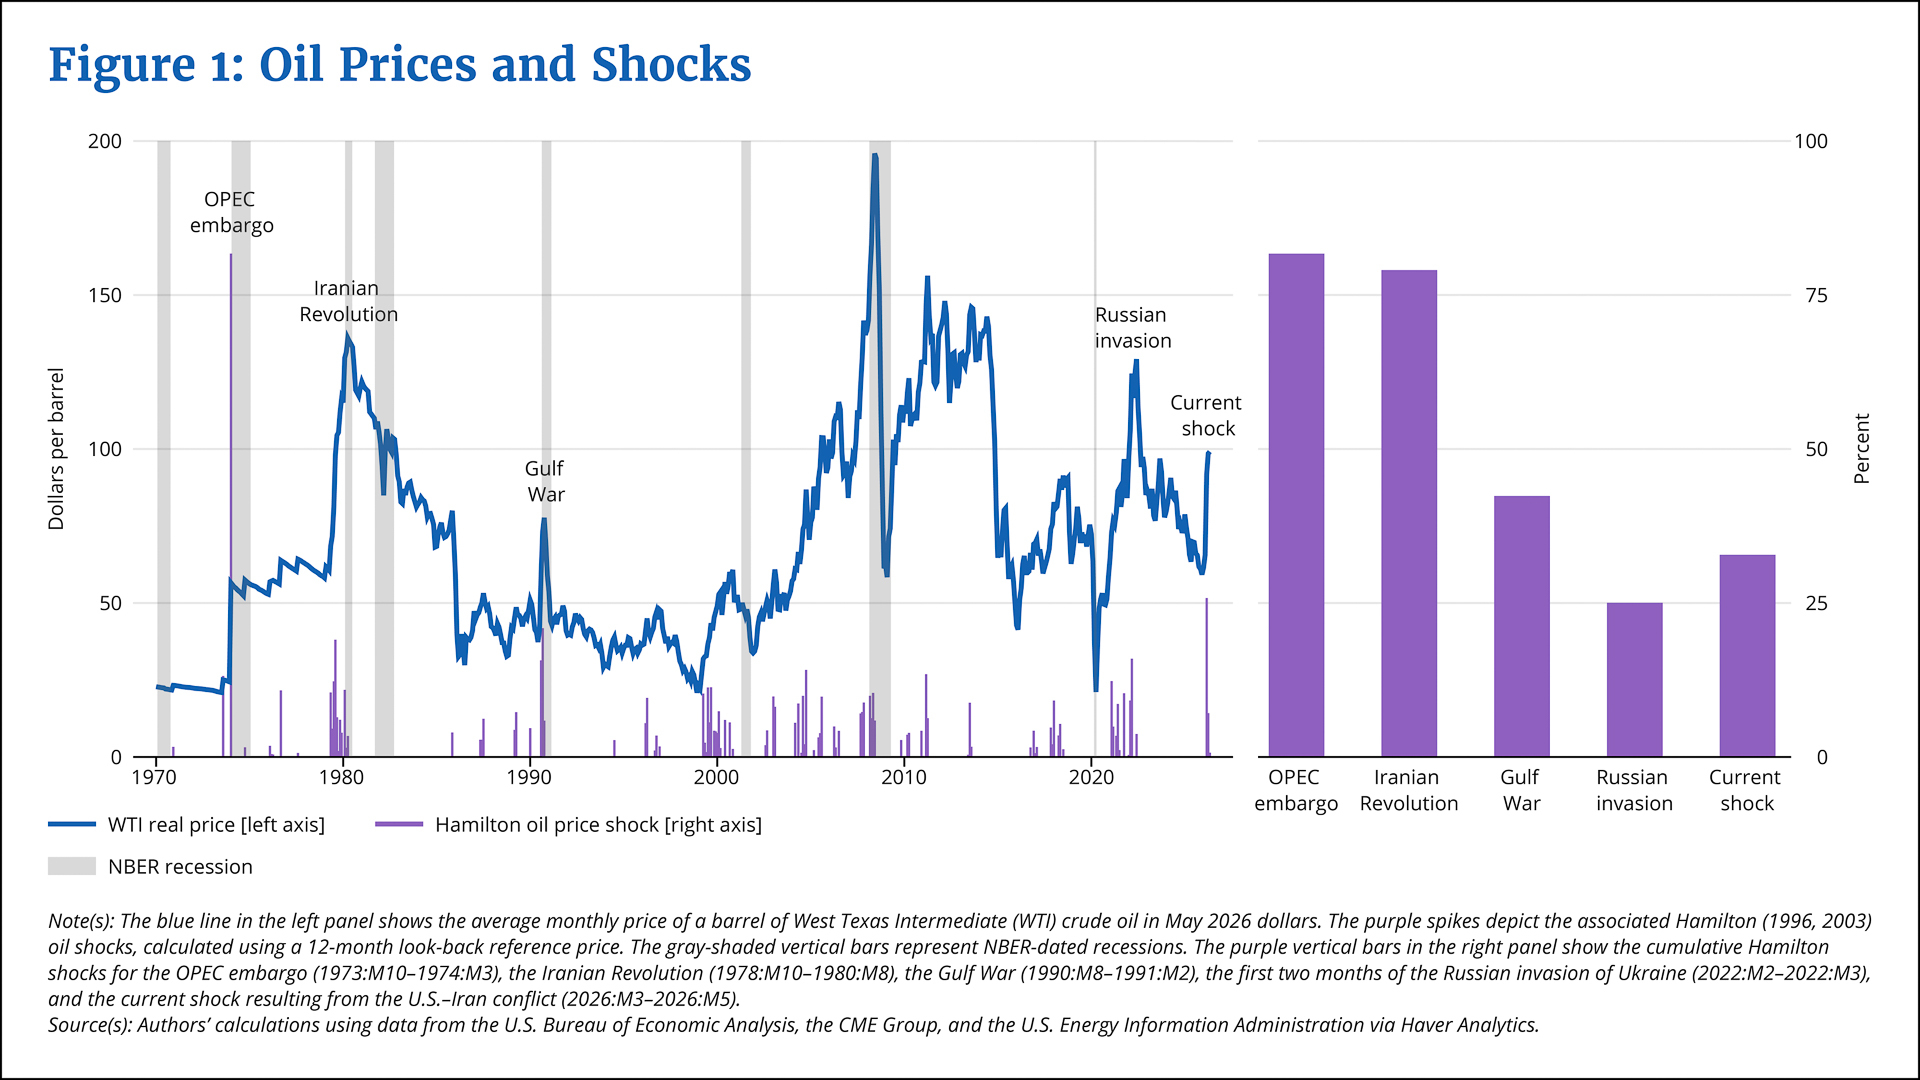
As shown by the blue line in the left panel of Figure 1, the average monthly real price of a barrel of West Texas Intermediate (WTI) crude oil—the U.S. benchmark—jumped from $65 in February to almost $100 in May, a 54 percent increase.1 Of course, not every oil price increase constitutes an economic shock. Prices fluctuate regularly and often substantially due to seasonal demand, routine or unexpected supply adjustments, and normal market dynamics. To identify oil shocks—price movements potentially large enough to disrupt economic planning and force widespread behavioral changes among consumers and businesses—we use a method developed by Hamilton (1996, 2003) that distinguishes between normal price fluctuations and jumps that substantially exceed recent price levels.
Federal Reserve Bank of Boston
Our application of Hamilton’s method identifies instances when oil prices surge above the highest level seen in the preceding 12 months (see the accompanying appendix for details). These spikes—shown in purple in the left panel of Figure 1—represent shocks that can challenge the existing plans of businesses and consumers, potentially forcing rapid and costly economic adjustments. As illustrated in the figure’s right panel, the current conflict has generated a real oil price shock of about 33 percent according to this measure. The right panel also provides historical context for the current shock, showing that it is about half the size of those experienced during the 1973–1974 OPEC oil embargo or the 1978–1980 Iranian Revolution and falls roughly between the shocks experienced during the 1990–1991 Gulf War and at the beginning of the Russian invasion of Ukraine in 2022.2 While smaller than the most severe historical episodes, the current shock nonetheless remains a significant disruption with potentially substantial economic consequences.
Sharp and sudden increases in real oil prices raise costs throughout the economy, generating inflationary pressure that can become persistent through second-round (ripple) effects on non-energy prices. Beyond these inflationary effects, the erosion of consumers’ real purchasing power typically leads to reduced spending, which has often precipitated economic downturns (indicated by the gray shading in the left panel of Figure 1). The 1970s provide the most notorious example of such a pattern. Following two major oil shocks, the U.S. economy experienced so-called stagflation, the painful concurrence of high inflation and high unemployment.
Sign up for Research Department Updates.
Although the current shock is smaller than those of the 1970s the possibility of similar dynamics poses particular challenges for monetary policymakers. Inflation measured by the personal consumption expenditure (PCE) price index—the Federal Reserve’s preferred gauge—has been running above the Fed’s 2 percent target for more than five years. Moreover, the inflationary effects of the oil shock may already be in motion. Indeed, year-over-year inflation, as measured by the PCE price index, jumped from 2.9 percent in February to 3.8 percent in April, driven primarily by substantial energy price increases. At the same time, the labor market, while currently balanced, may be fragile, as the pace of hiring remains relatively weak, even with the unemployment rate hovering near historical lows.
Yet the impact of today’s oil shocks may differ markedly from historical experience. As noted in the minutes of the April 28–29, 2026, Federal Open Market Committee (FOMC) meeting, two structural changes to the U.S. economy could cushion the impact of the shock: the substantial increase in domestic oil production and the declining share of spending devoted to energy. This brief examines empirical evidence on how these transformations have altered the U.S. economy’s vulnerability to oil shocks.
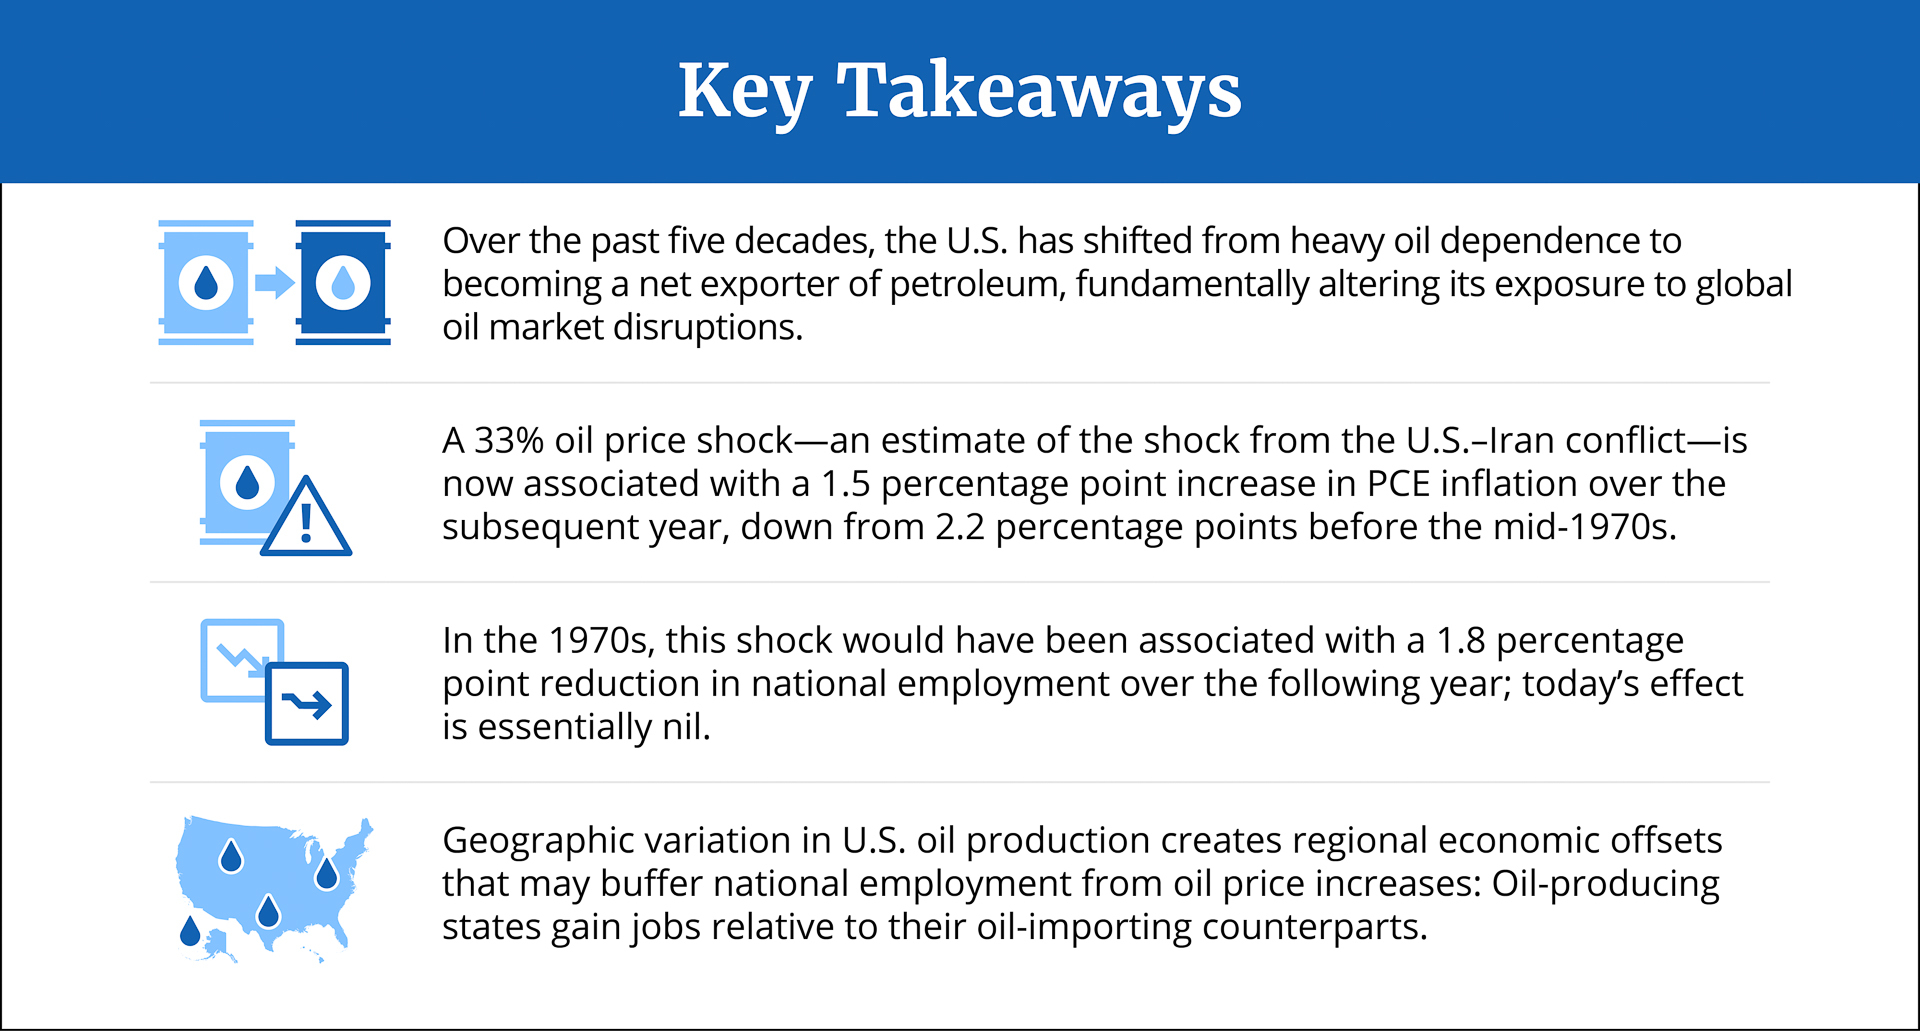
We find that because the United States’ exposure to global oil market disruptions has changed fundamentally since the 1970s, oil shocks today are associated with less of an impact on PCE inflation relative to the impact of comparable shocks four or five decades ago. We also find that the negative effects of oil shocks on national employment may be tempered by job gains in U.S. states that produce oil. However, those smaller employment effects could result in less disinflationary pressure to counterbalance the inflationary impact of higher oil prices. These findings imply that monetary policy should focus more on the inflation effects associated with oil shocks as opposed to the employment effects.
The Oil–Macroeconomy Relationship Has Changed Substantially since the 1970s
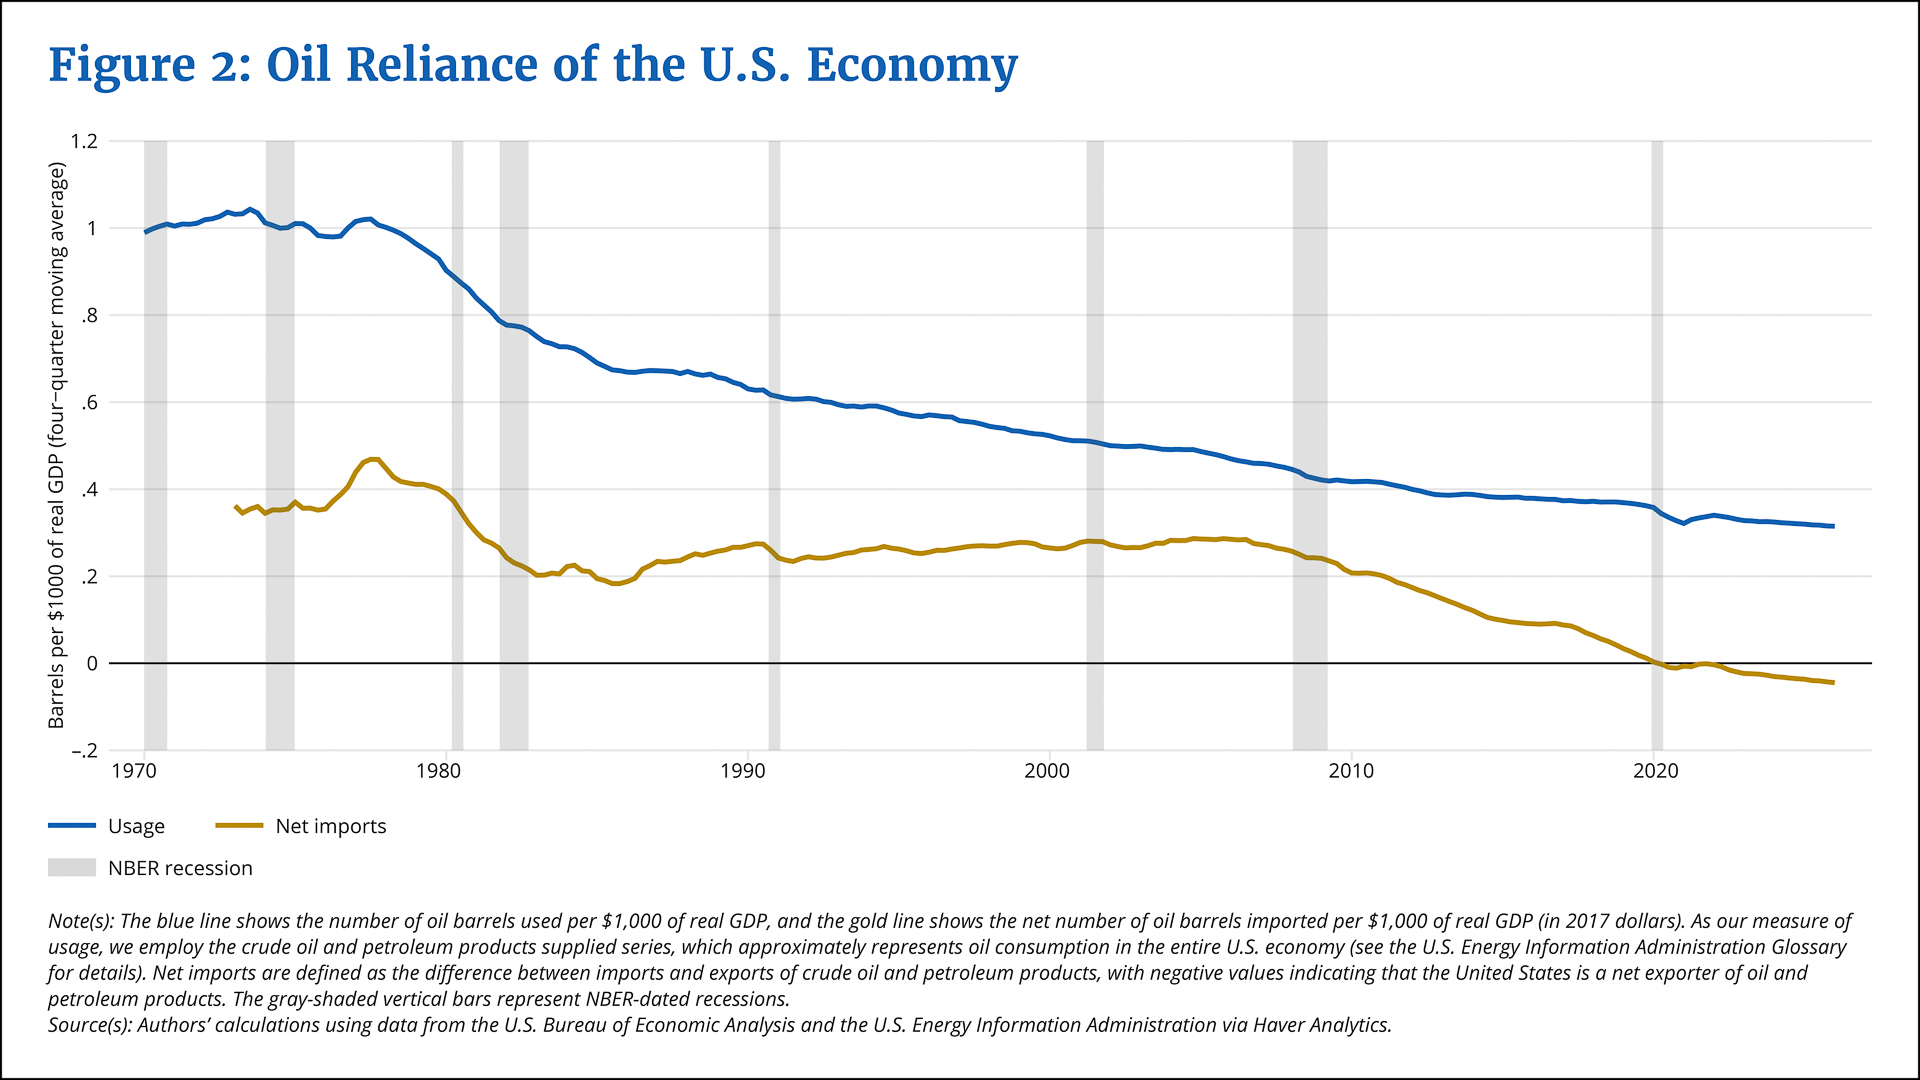
The U.S. economy has become far less dependent on oil over time. As the blue line in Figure 2 shows, the economy consumed nearly one barrel of oil for each $1,000 of real output produced throughout most of the 1970s. Today, the U.S. economy’s oil reliance is less than one-third of what it was, reflecting greater efficiency in oil use and a structural shift away from energy-intensive goods manufacturing and toward services.
Federal Reserve Bank of Boston
While the country’s oil usage has declined, its domestic oil production has grown, substantially reducing reliance on foreign oil supplies. As the gold line in Figure 2 shows, net oil imports accounted for about two-fifths of all domestic oil consumption, on average, during the 1970s. By the mid-1980s, this share had dropped to about one-third. It remained at or above that level through the 2000s despite declining overall oil usage, reflecting the United States’ continued dependence on foreign oil. Net oil import reliance began falling more rapidly around 2010 due to the shale oil boom enabled by hydraulic fracturing. In fact, by 2019, the United States had become a net oil exporter.3
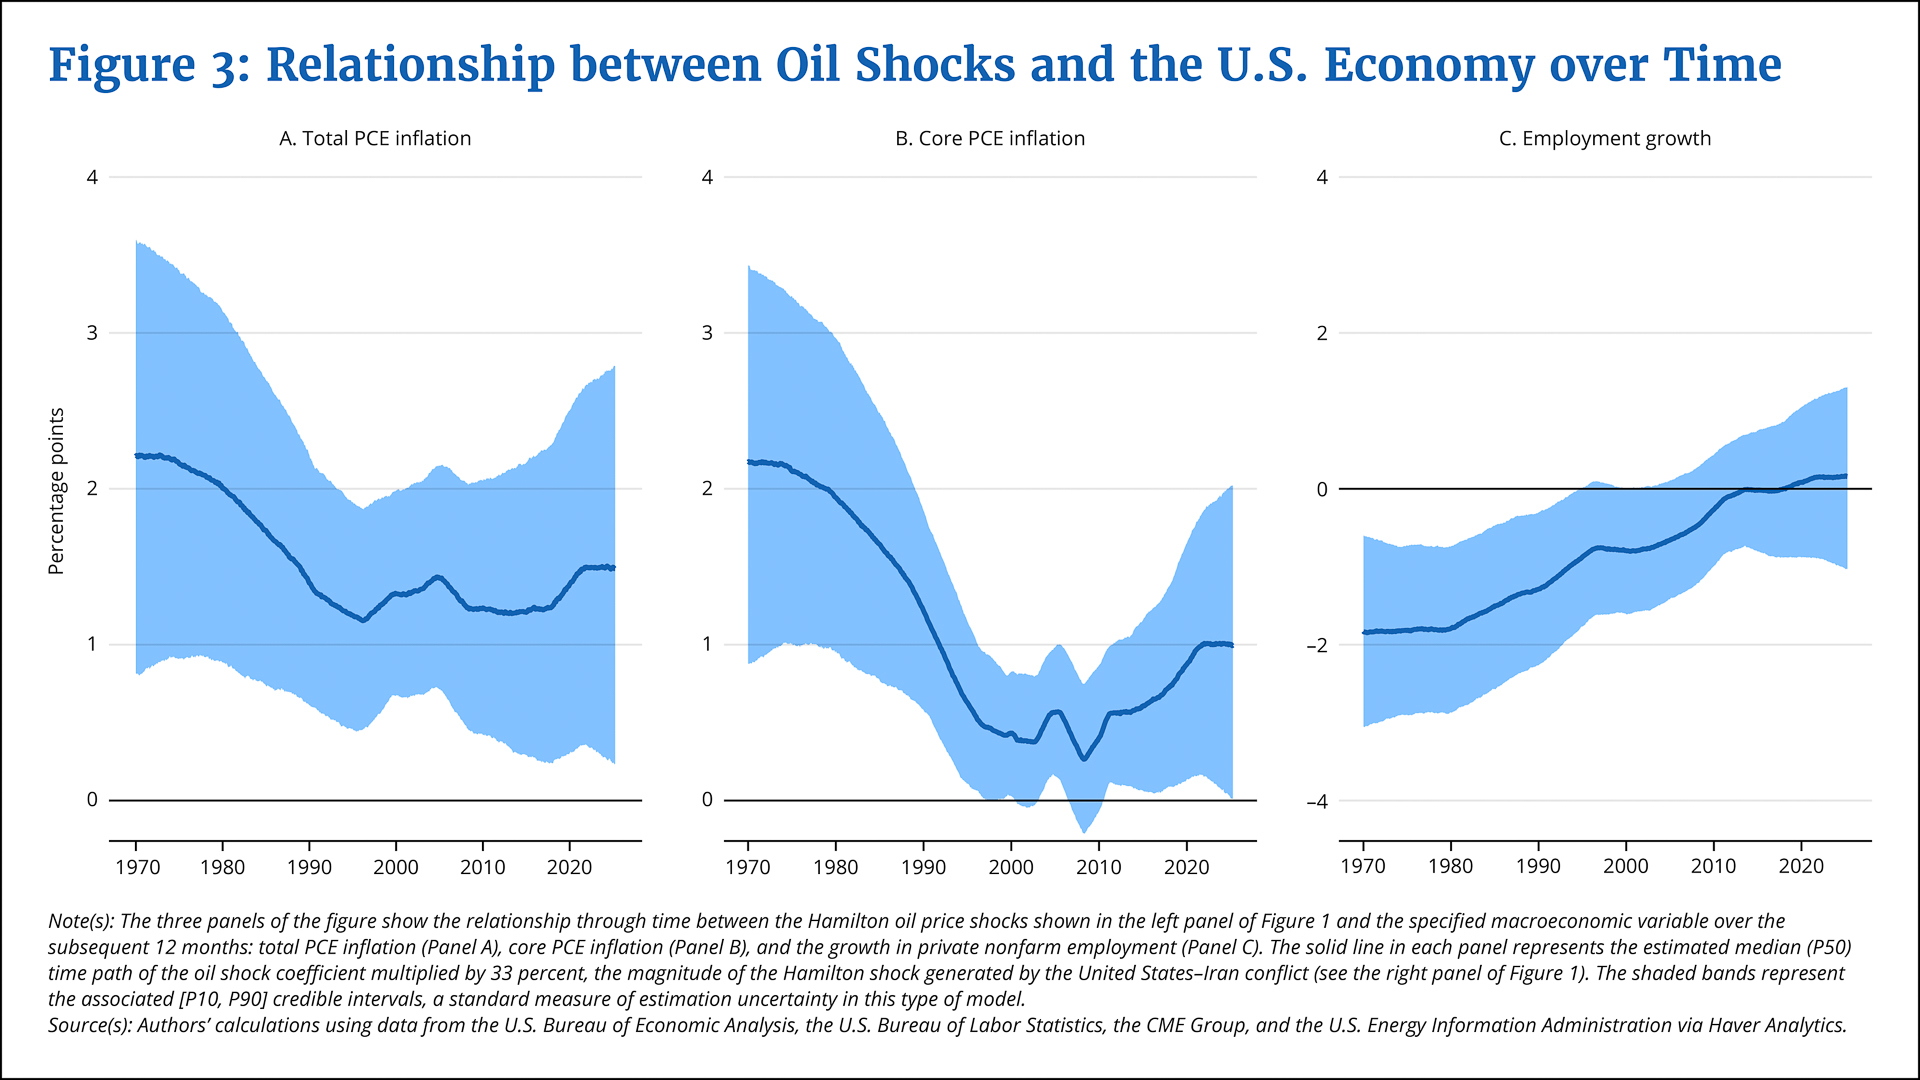
The decline in oil reliance suggests that oil is now less central to the U.S. economy than in the 1970s. This transformation raises the question of whether the macroeconomic effects associated with oil shocks are smaller today than they would have been decades ago with comparable shocks. Figure 3 illustrates how the relationship between oil shocks and macroeconomic effects has changed over time. It shows estimates from a regression model that relates a Hamilton oil shock in a given month to PCE inflation—both total and core (which excludes food and energy prices)—and employment growth over the subsequent 12 months.4 The model, which allows the relationship between oil shocks and these three economic outcomes to evolve smoothly over time, reveals a marked decline in the strength of these associations since the 1970s and 1980s.
Federal Reserve Bank of Boston
In particular, Panel A shows that while a 33 percent oil shock was associated with an increase in year-ahead (the subsequent 12 months) total PCE inflation of about 2.2 percentage points before the mid-1980s, the estimated effect has gradually declined to approximately 1.5 percentage points today, though these estimates are subject to considerable uncertainty. A more pronounced attenuation is evident for year-ahead core PCE inflation, shown in Panel B. The estimated relationship weakened substantially through the mid-1990s, reaching its lowest point between 1995 and 2010, before strengthening modestly over the past decade. Because core inflation excludes direct energy costs, the estimated effect captures how oil shocks propagate through the broader economy via second-round effects on wages, non-energy goods, and services.
Panel C illustrates perhaps the most striking change: An oil shock of today’s magnitude would have been associated with a significant decline in year-ahead employment growth (about 1.8 percentage points) during the 1970s. This negative relationship, while diminishing somewhat, persisted through the 1990s and 2000s but has largely disappeared in recent years. This pattern indicates far less pronounced effects of oil shocks on the labor market today compared with the 1970s and 1980s. Notably, around 2010—when domestic oil production accelerated dramatically—the estimated employment impact of oil shocks effectively vanished.
Coinciding with this shift, the estimated core PCE inflation response to oil shocks (shown in Panel B) began rising modestly from its historical low point. This pattern suggests that as U.S. oil-producing regions gained jobs when prices rose, those gains may have helped offset job losses elsewhere, reducing the overall employment drag. With less of an economic slowdown materializing, there was thus less disinflationary pressure to offset the inflationary impact of higher oil costs.
While these estimates represent statistical associations rather than causal estimates and should be interpreted with appropriate caution, they reveal several important patterns. First, while the inflationary effects of oil shocks are substantially smaller now than in the 1970s and 1980s—reflecting reduced oil dependence—they remain meaningful, particularly because economic activity now appears more resilient to such shocks. Second, the current oil shock will likely have a more muted impact on aggregate employment, as job gains in oil-producing states may counterbalance losses elsewhere.
Shocks Have Different Impacts across States due to Oil Production
The estimates presented in Panel C of Figure 3 show that the aggregate employment effects of oil shocks have diminished substantially since the 1970s and 1980s, effectively disappearing around 2010 when domestic oil production began its dramatic expansion. The timing of this shift likely masks important offsetting regional dynamics: Oil-importing states may continue to experience job losses when prices spike, while oil-producing states could enjoy employment gains that can help counterbalance employment losses at the national level. We examine this potential pattern by looking at how oil shocks affect individual states differently based on their oil production intensity.
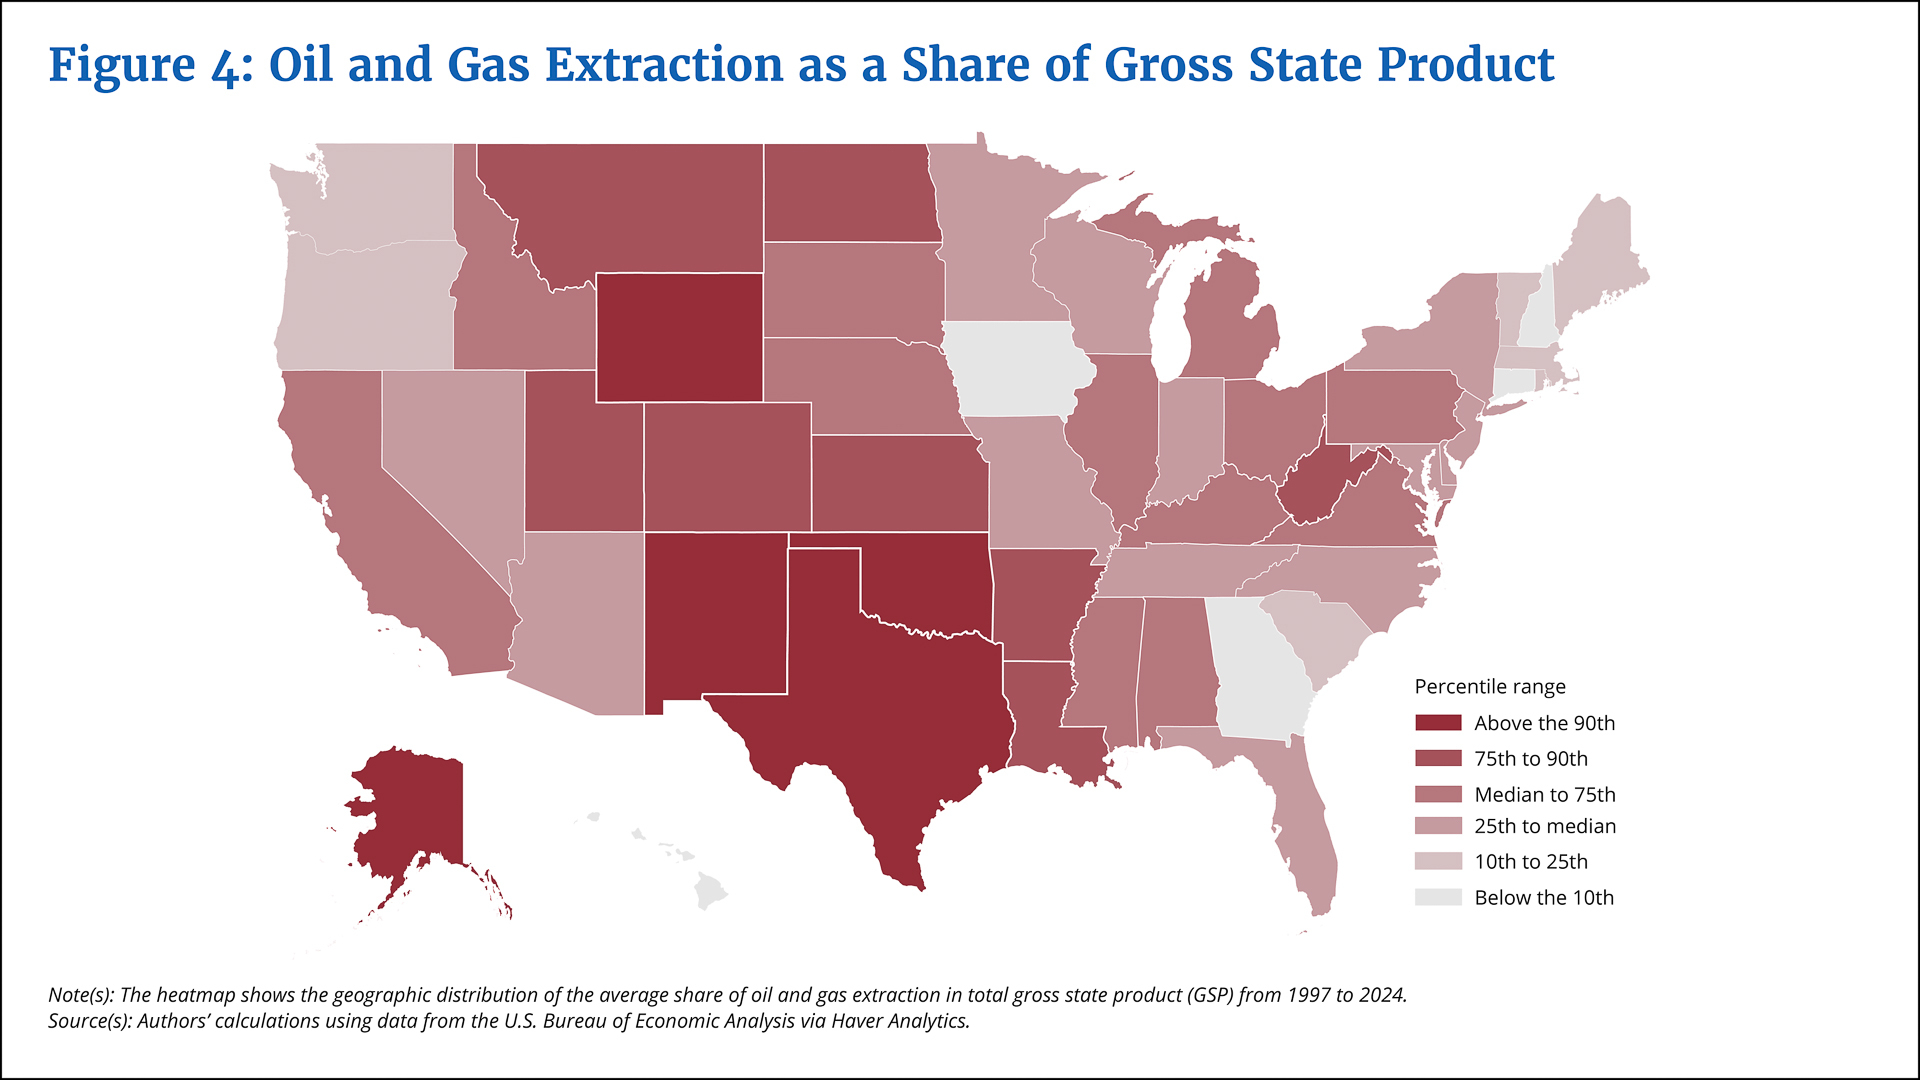
Because oil production is geographically concentrated, the benefits of higher oil prices accrue disproportionately to specific states. Figure 4 displays the average share of gross state product (GSP, the state-level equivalent to GDP) attributable to oil and gas extraction over the 1997–2024 period.5 States where oil and gas extraction represents a larger share of economic output are shaded in darker red. In 2024, the latest available data point, this industry comprised 1 percent of GSP on average. However, production was highly concentrated: The top five states by share—New Mexico, North Dakota, Alaska, Oklahoma, and Texas—together accounted for 82 percent of the nation’s oil and gas extraction output.
Federal Reserve Bank of Boston
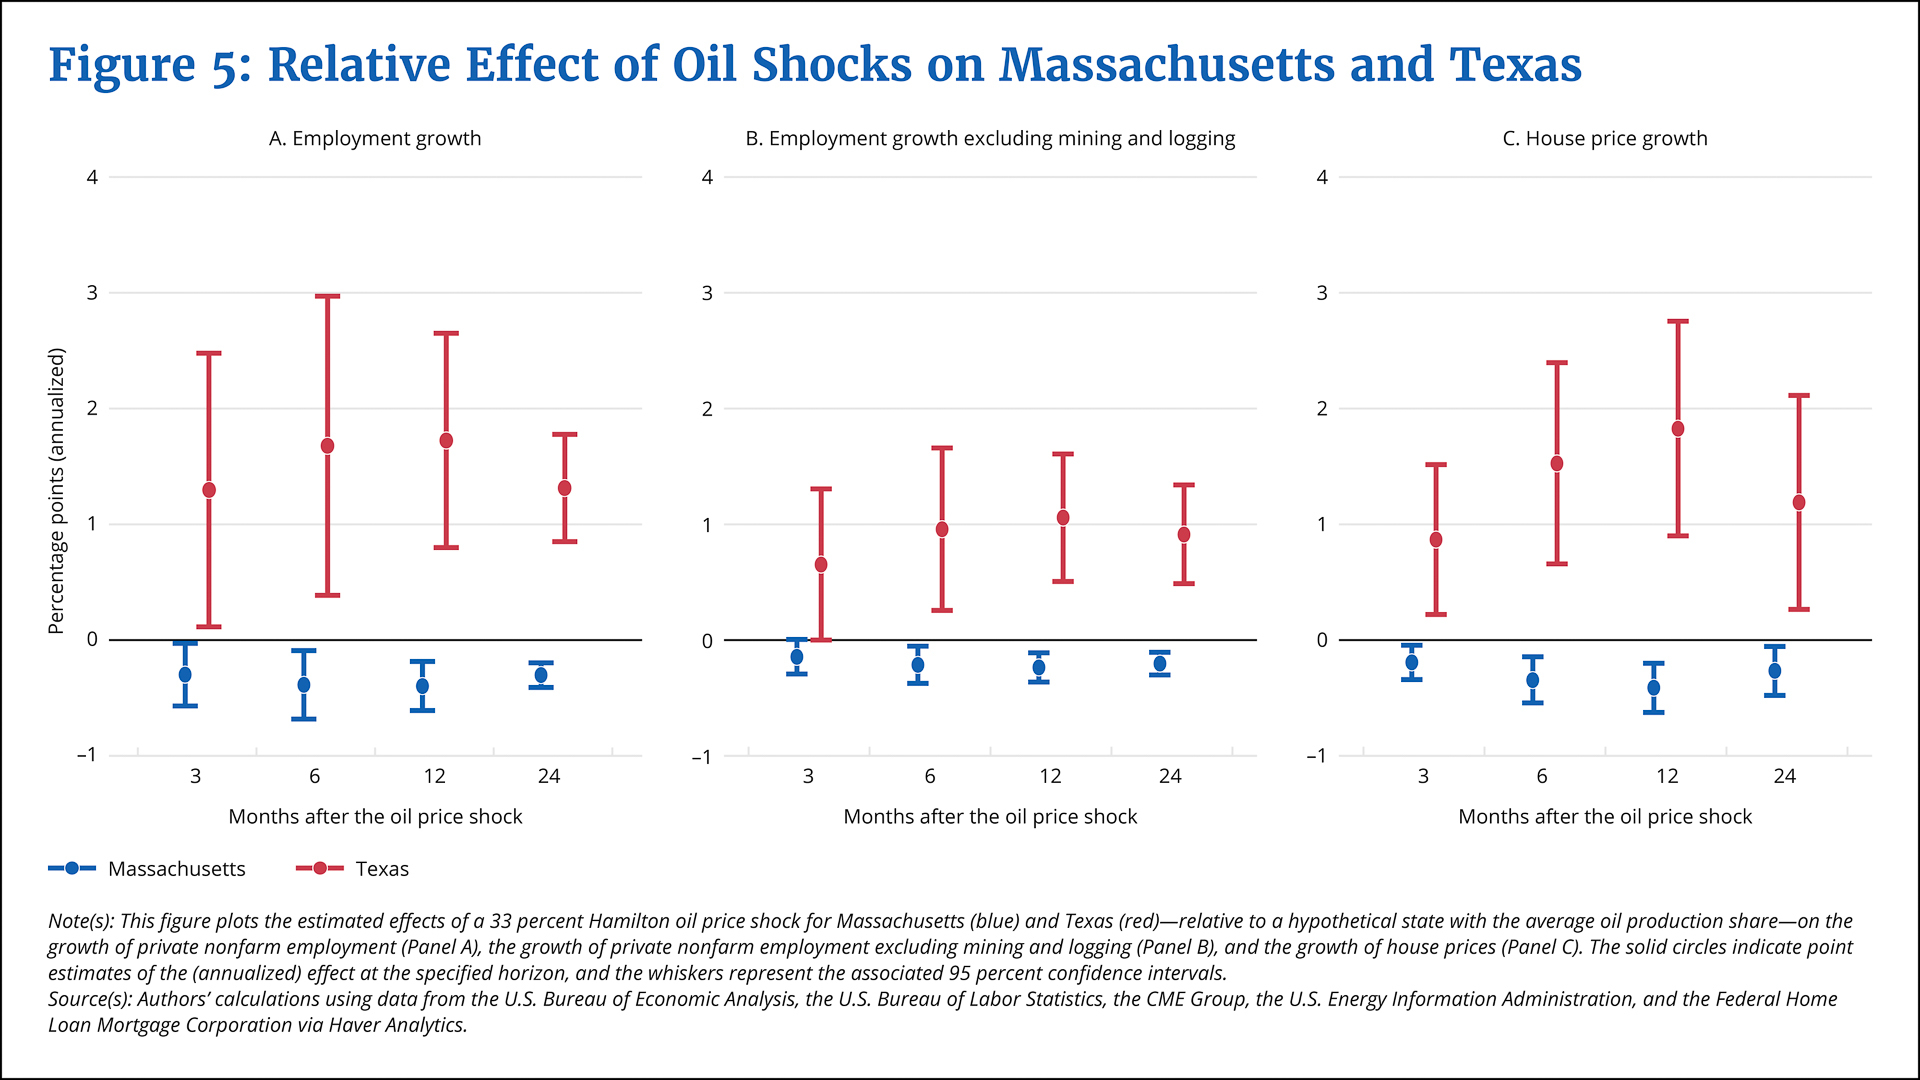
We quantify how oil production intensity cushions states from oil shocks by exploiting the variation shown in Figure 4 and estimating how, over the 1997–2024 period, state-level employment and house prices responded to Hamilton oil shocks. Because state-level consumer price data are not available, we use state-level house prices, which are intended to proxy for broader demand-driven price effects. Importantly, in our regressions, each state’s response to the oil shocks depends on its oil production intensity.6
Figure 5 illustrates these estimated effects for private nonfarm employment (Panel A); private nonfarm employment excluding mining and logging, under which the oil extraction industry is categorized (Panel B); and house prices (Panel C) for two contrasting example states: Texas, which derives almost 6 percent of its GSP from oil and gas extraction in the latest data, and Massachusetts, where the oil and gas industry is virtually nonexistent. The contrast is striking. As shown in Panel A, 12 months after a 33 percent oil shock (again, an estimate of the magnitude of the shock from the United States–Iran conflict), relative employment growth in Texas—measured against that of a hypothetical state with average oil production—would be approximately 1.7 percentage points higher, while Massachusetts would experience a relative employment decline of roughly 0.4 percentage point.
Federal Reserve Bank of Boston
Importantly, this pattern holds not just for overall employment but also for employment excluding mining and logging (Panel B), indicating that the benefits extend beyond the oil extraction sector. As oil producers capture larger revenues from elevated prices, they hire more workers to expand production, which supports broader consumption spending in these states and creates spillover employment gains in other industries.
As shown in Panel C, this relative strength in labor markets also translates into housing demand: Texas would experience house price growth that is 1.8 percentage points higher than average, while Massachusetts would see house prices decline by about 0.4 percentage point relative to the typical state.7 It is also worth noting that these differential effects are persistent, remaining economically and statistically significant for two years after the shock.
The Inflation Effects of an Oil Shock Are Now Stronger than the Employment Effects
The regional patterns involving employment and prices help explain the aggregate findings presented earlier. The pronounced negative employment effects of the 1970s and 1980s oil shocks reflect an era when the United States was heavily dependent on imported oil, meaning virtually all regions experienced the shock as a supply disruption that raised costs throughout the economy. Today, with substantial domestic production, the U.S. economy features built-in regional offsets; that is, gains in oil-producing states may counterbalance job losses in oil-importing states.
The implications for inflation are more nuanced. On one hand, reduced oil dependence means that oil price increases have smaller direct cost impacts throughout the economy, as evidenced by the declining inflation response shown in Panel A of Figure 3. On the other hand, because oil-producing states now experience positive demand effects that support aggregate employment, there is less disinflationary pressure to offset the inflationary impact of higher oil costs. This dynamic could explain why the core PCE inflation response, while substantially weaker than in earlier decades, has grown modestly since around 2010, as shown in Panel B of Figure 3.
These findings suggest two key considerations for monetary policymakers. First, the diminished aggregate employment effects of oil shocks reduce the likelihood of stagflation-style tradeoffs between inflation and unemployment that characterized the 1970s. The geographic diversification of oil production creates natural economic buffers at the national level. Second, because oil-producing regions can offset employment losses elsewhere, the disinflationary pressure materializing from a slowdown in economic activity induced by oil shocks may be less pronounced.
Understanding this transformed landscape is essential for calibrating an appropriate monetary policy response to future energy market disruptions. The U.S. economy’s vulnerability to oil shocks has fundamentally changed—it has not been eliminated but rather reconfigured. Oil shocks may now pose less of a challenge for monetary policy, allowing policymakers to focus more on the upside risk to inflation.
Endnotes
- The real price equals the average monthly nominal WTI price deflated by the personal consumption expenditures (PCE) price index. Because May 2026 PCE data were not available at the time of writing, we extrapolate a May value of the PCE price index by assuming the same month-over-month inflation rate in May as in April.
- Our dating of the shocks associated with the OPEC embargo and the Iranian Revolution follows Kilian (2008).
- This shift has been driven primarily by exports of processed petroleum products, such as gasoline, diesel and jet fuels, lubricants, and asphalt. The United States still imports crude oil on net, though these imports have also decreased notably due to greater domestic production.
- The time-varying parameter regression model, which is estimated over the 1959:M1–2026:M5 period using standard Bayesian methods, allows both the intercept and the coefficient on the Hamilton oil shock to follow independent random walks. This enables us to capture the gradual evolution of the oil-macroeconomy relationship without imposing arbitrary structural break dates on when that relationship may have changed, an important consideration given the slow changes in oil reliance shown in Figure 2. The model also incorporates stochastic volatility to account for well-documented changes in macroeconomic volatility since the 1980s and adjusts for outliers to prevent extreme observations (for example, the COVID-19 pandemic) from unduly influencing the estimated coefficient paths.
- We use the narrow oil and gas extraction category, as opposed to a more expansive definition of the energy sector, due to data limitations at the state level and to capture the industry that benefits most directly from higher oil prices. Industries downstream from oil and gas extraction—namely, those that produce petroleum products—may or may not benefit from higher crude prices because price increases raise their input costs even as their output prices potentially rise.
- We also flexibly control for time-invariant state characteristics and common monthly effects, thereby isolating the interaction between each state’s oil production intensity and oil shocks. As discussed more fully in the accompanying appendix, this approach identifies only the relative effect of oil shocks across states, not absolute effects. While this approach cannot quantify total effects of oil shocks on individual states, it is well suited to our research question, namely, understanding whether domestic oil production creates regional offsets in employment responses.
- More generally, our estimates indicate that relative to a state with an oil extraction share at the 10th percentile (P10), a state with a share at the 90th percentile (P90) experiences a 1.9 percentage point increase in private nonfarm employment growth, a 1.1 percentage point increase in growth in employment excluding mining and logging, and a 2 percentage point increase in the growth of house prices 12 months after a 33 percent Hamilton oil price shock.
References
Hamilton, James D. 1996. “This Is What Happened to the Oil Price–Macroeconomy Relationship.” Journal of Monetary Economics 38(2): 215–220.
Hamilton, James D. 2003. “What Is an Oil Shock?” Journal of Econometrics 113(2): 363–398.
Kilian, Lutz. 2008. “Exogenous Oil Supply Shocks: How Big Are They and How Much Do They Matter for the U.S. Economy?” The Review of Economics and Statistics 90(2): 216–240.

 About the Authors
Danilo Leiva-León,
Federal Reserve Bank of Boston
Danilo Leiva-León is a principal economist and policy advisor in the Federal Reserve Bank of Boston Research Department.
Email: Danilo.Leiva-Leon@bos.frb.org
Giovanni P. Olivei,
Federal Reserve Bank of Boston
Giovanni P. Olivei is a senior vice president and deputy director of research at the Federal Reserve Bank of Boston.
Email: Giovanni.Olivei@bos.frb.org
Ara Patvakanian,
Federal Reserve Bank of Boston
Ara Patvakanian is a senior research associate in the Federal Reserve Bank of Boston Research Department.
Jenny Tang,
Federal Reserve Bank of Boston
Jenny Tang is a vice president and economist in the Federal Reserve Bank of Boston Research Department.
Email: Jenny.Tang@bos.frb.org
Egon Zakrajšek,
Federal Reserve Bank of Boston
Egon Zakrajšek is an executive vice president at the Federal Reserve Bank of Boston and the director of the Research Department.
Email: Egon.Zakrajsek@bos.frb.org
Resources
Site Topics
Keywords
- oil shocks ,
- monetary policy ,
- inflation ,
- employment
JEL Codes
- E3 ,
- E23 ,
- E52 ,
- Q34 ,
- Q43
Citation
Leiva-León, Danilo, Giovanni Olivei, Ara Patvakanian, Jenny Tang, and Egon Zakrajšek. 2026. “Reassessing the U.S. Economy’s Vulnerability to Oil Shocks.” Federal Reserve Bank of Boston Current Policy Perspectives 26-5.