Why Mortgage Rates Exceed Treasury Yields 
Default Title
Default Title


The views expressed herein are solely those of the author and should not be reported as representing the views of the Federal Reserve Bank of Boston, the principals of the Board of Governors, or the Federal Reserve System.
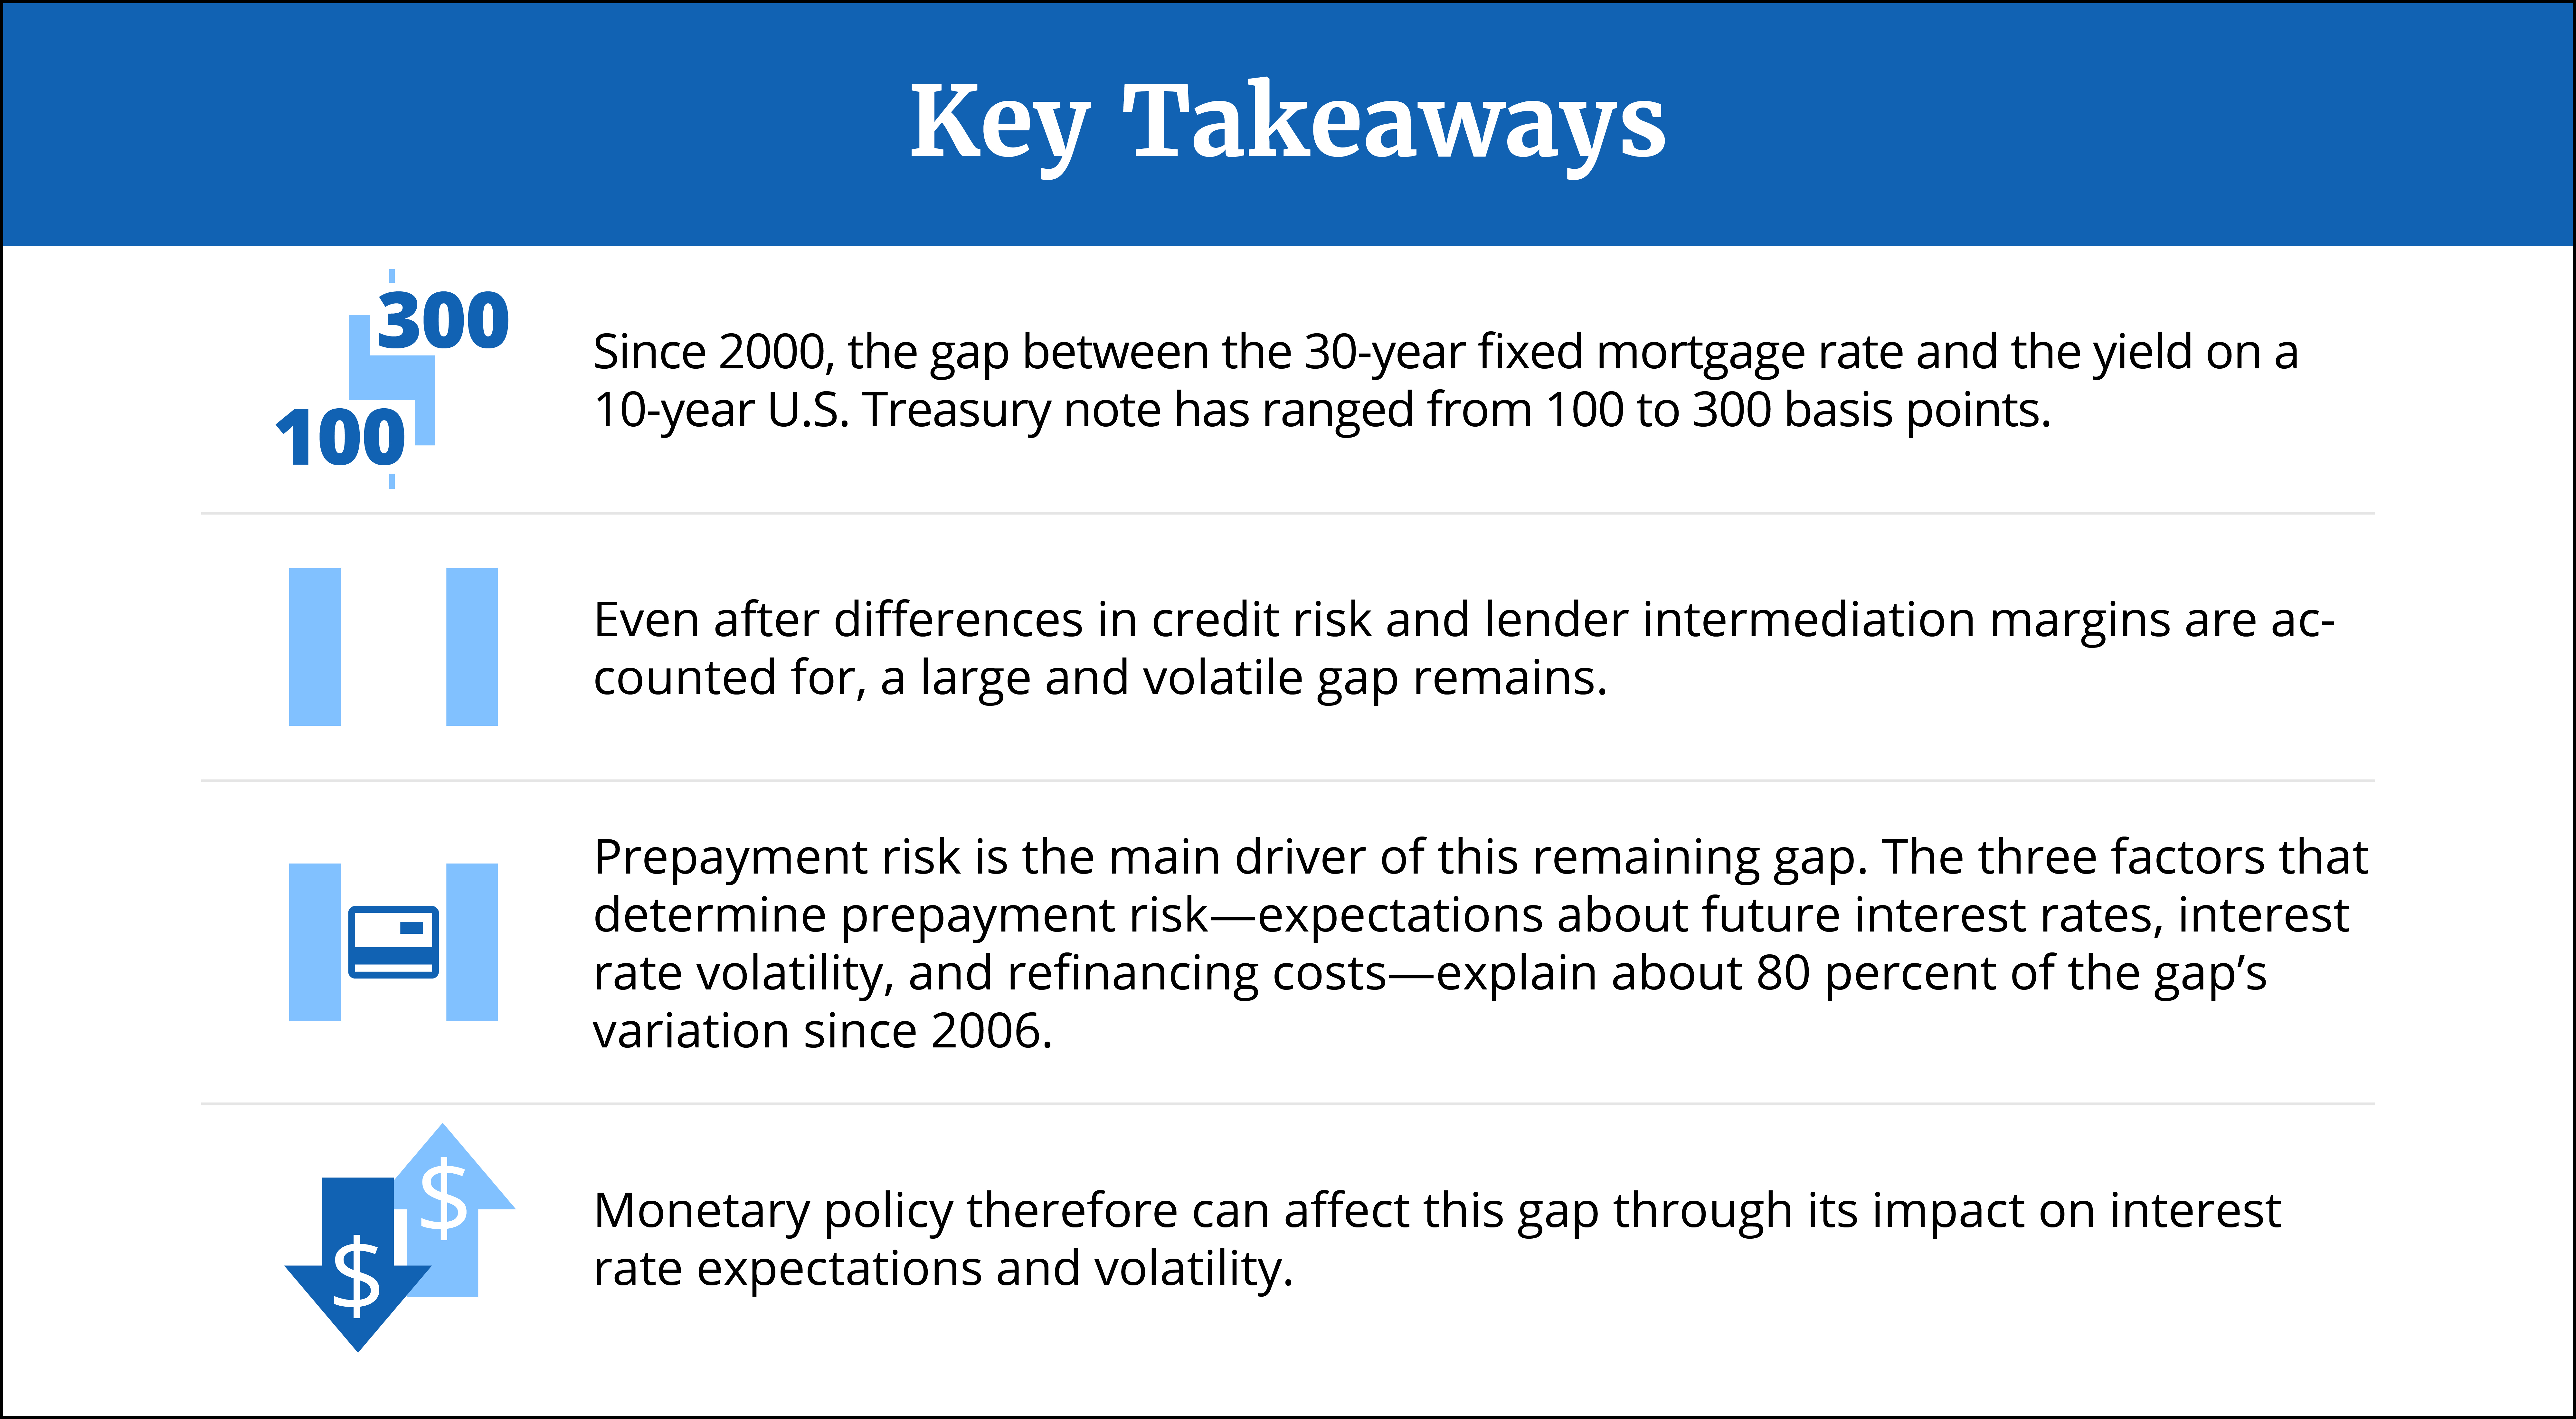
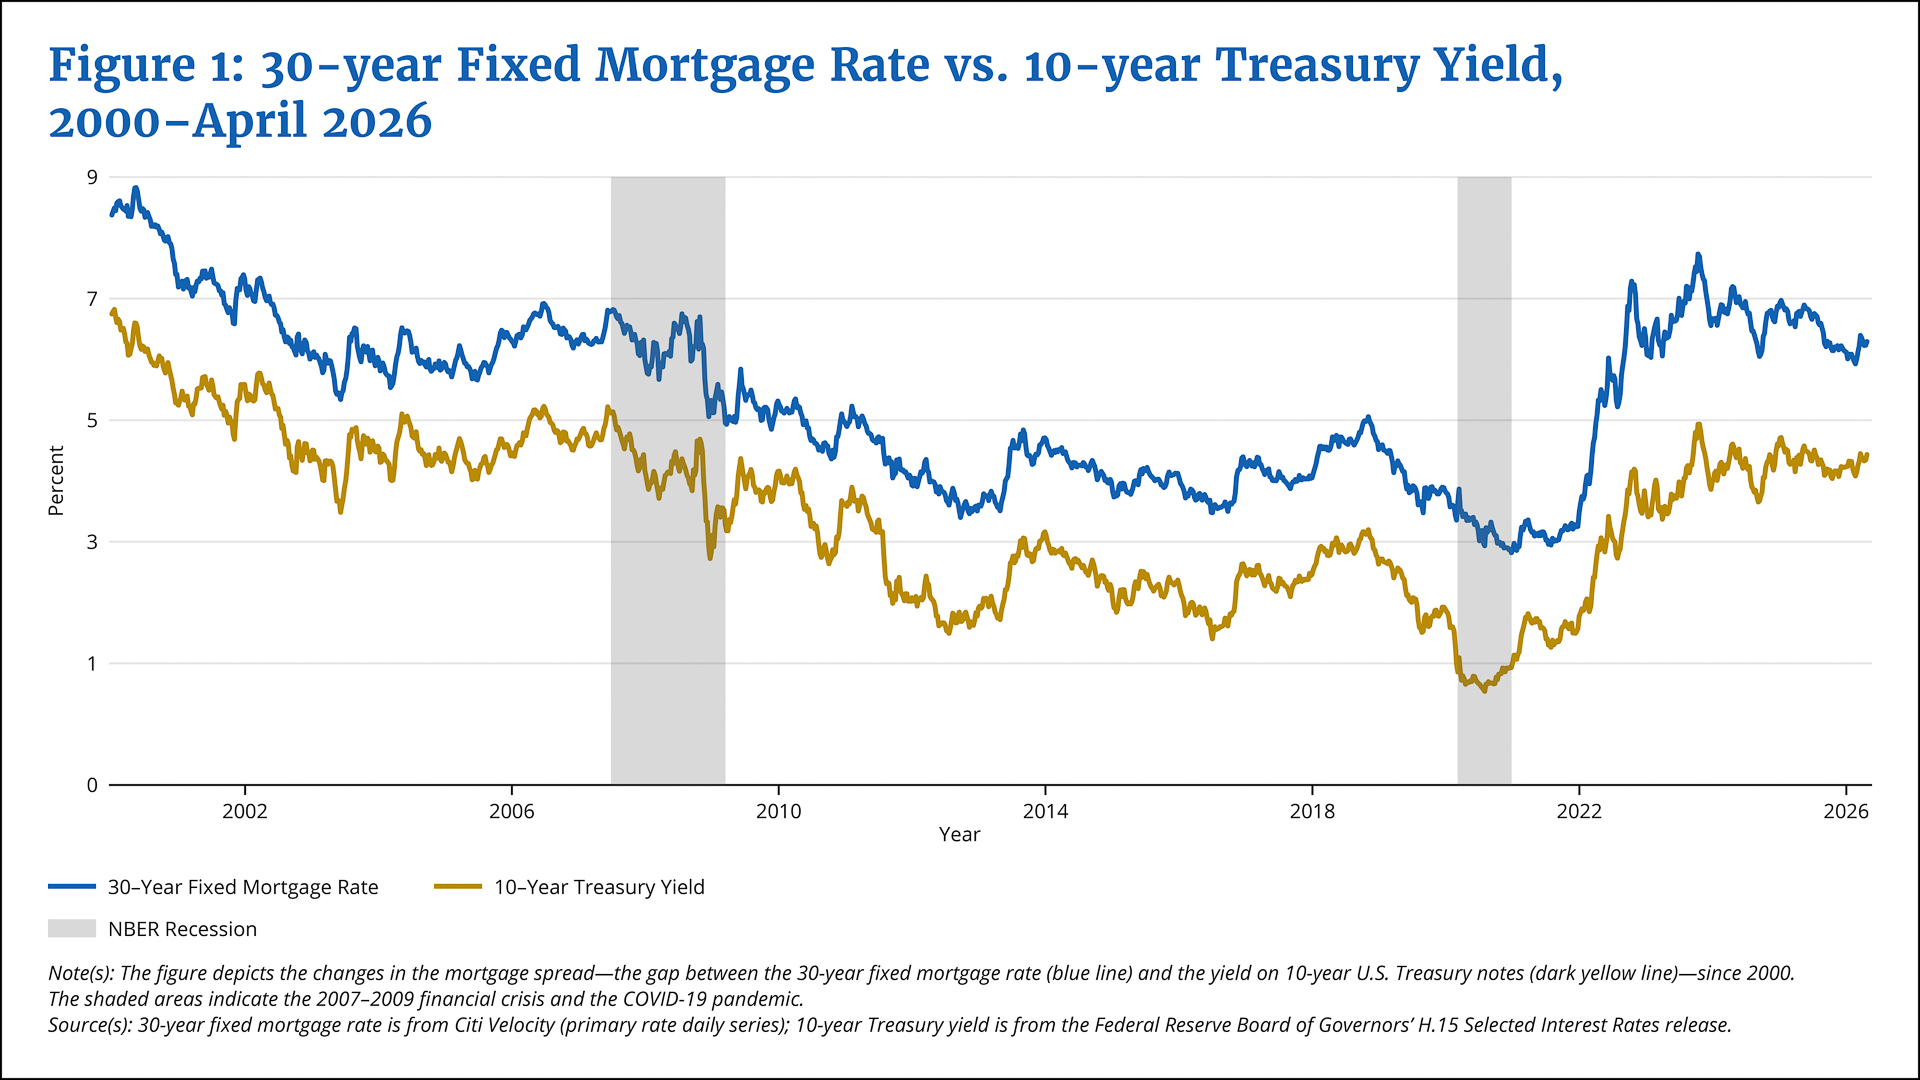
The 30-year fixed mortgage rate is currently about 6.5 percent, and the yield on 10-year U.S. Treasury notes—which reflects investors’ long-term expectations about inflation and economic growth and acts as a benchmark for other long-term interest rates—is about 4.5 percent. As Figure 1 shows, the gap between the primary mortgage rate and the 10-year Treasury yield, often called the mortgage spread, has varied dramatically since 2000, ranging from more than 300 basis points during the 2007–2009 financial crisis to less than 100 basis points in 2021 (a basis point is one-hundredth of a percentage point).
Federal Reserve Bank of Boston
The mortgage spread reflects several distinct factors stacked on top of each other. Lenders typically bundle mortgages that they originate into mortgage-backed securities (MBS) and sell them to investors. An MBS and a Treasury security have very different cash flows. First, a Treasury security returns the principal in a lump sum at maturity, while an MBS returns the principal gradually as borrowers amortize (make their monthly fixed payments) until they sell their homes and/or refinance. Second, an MBS carries credit risk because borrowers might default on their mortgages. Third, mortgage lenders incur intermediation costs to originate a loan, package it into an MBS, and sell the MBS to investors, and they charge borrowers a margin to cover these costs.
Even after these three factors are accounted for, a large and volatile gap between mortgage rates and Treasury yields remains. I refer to this gap as the coupon spread, in reference to the difference between interest rates paid by mortgage-backed securities and Treasury yields when I control for the aforementioned factors. I argue that the coupon spread largely reflects the price of the prepayment option—a borrower’s right to pay off their mortgage at any time without incurring a penalty.
Sign up for Research Department Updates.
The prepayment option creates an asymmetry that benefits borrowers at the expense of MBS investors: When mortgage rates fall, borrowers refinance, and investors get their principal back at a time when reinvestment yields are lower; when rates rise, borrowers hold on to their low-rate mortgages and MBS investors stay locked into below-market coupons. Borrowers win in both scenarios; investors lose in both. Because this asymmetry is costly to investors, they demand compensation in the form of higher mortgage rates.
The value of the prepayment option depends on borrowers’ likelihood of refinancing: The more likely refinancing is, the greater the option’s value, the higher the mortgage rate, and the larger the coupon spread. The same factors that determine the value of the prepayment option—expectations about interest rates, interest rate volatility, and refinancing costs—explain about 80 percent of the variation in the coupon spread since 2006, indicating that the prepayment option is what drives the spread.
This matters for borrowers. A period when the coupon spread is large is not necessarily a bad time to take out a mortgage. A large spread does not reflect inefficiency; it is the market pricing a real benefit, and it often signals that markets expect rates to fall, meaning borrowers may be able to refinance advantageously. Spreads were relatively small in 2021 and large in 2023, but homebuyers who took out a mortgage in 2023 got something of value: the real probability of refinancing into a lower rate.
Measuring the Coupon Spread
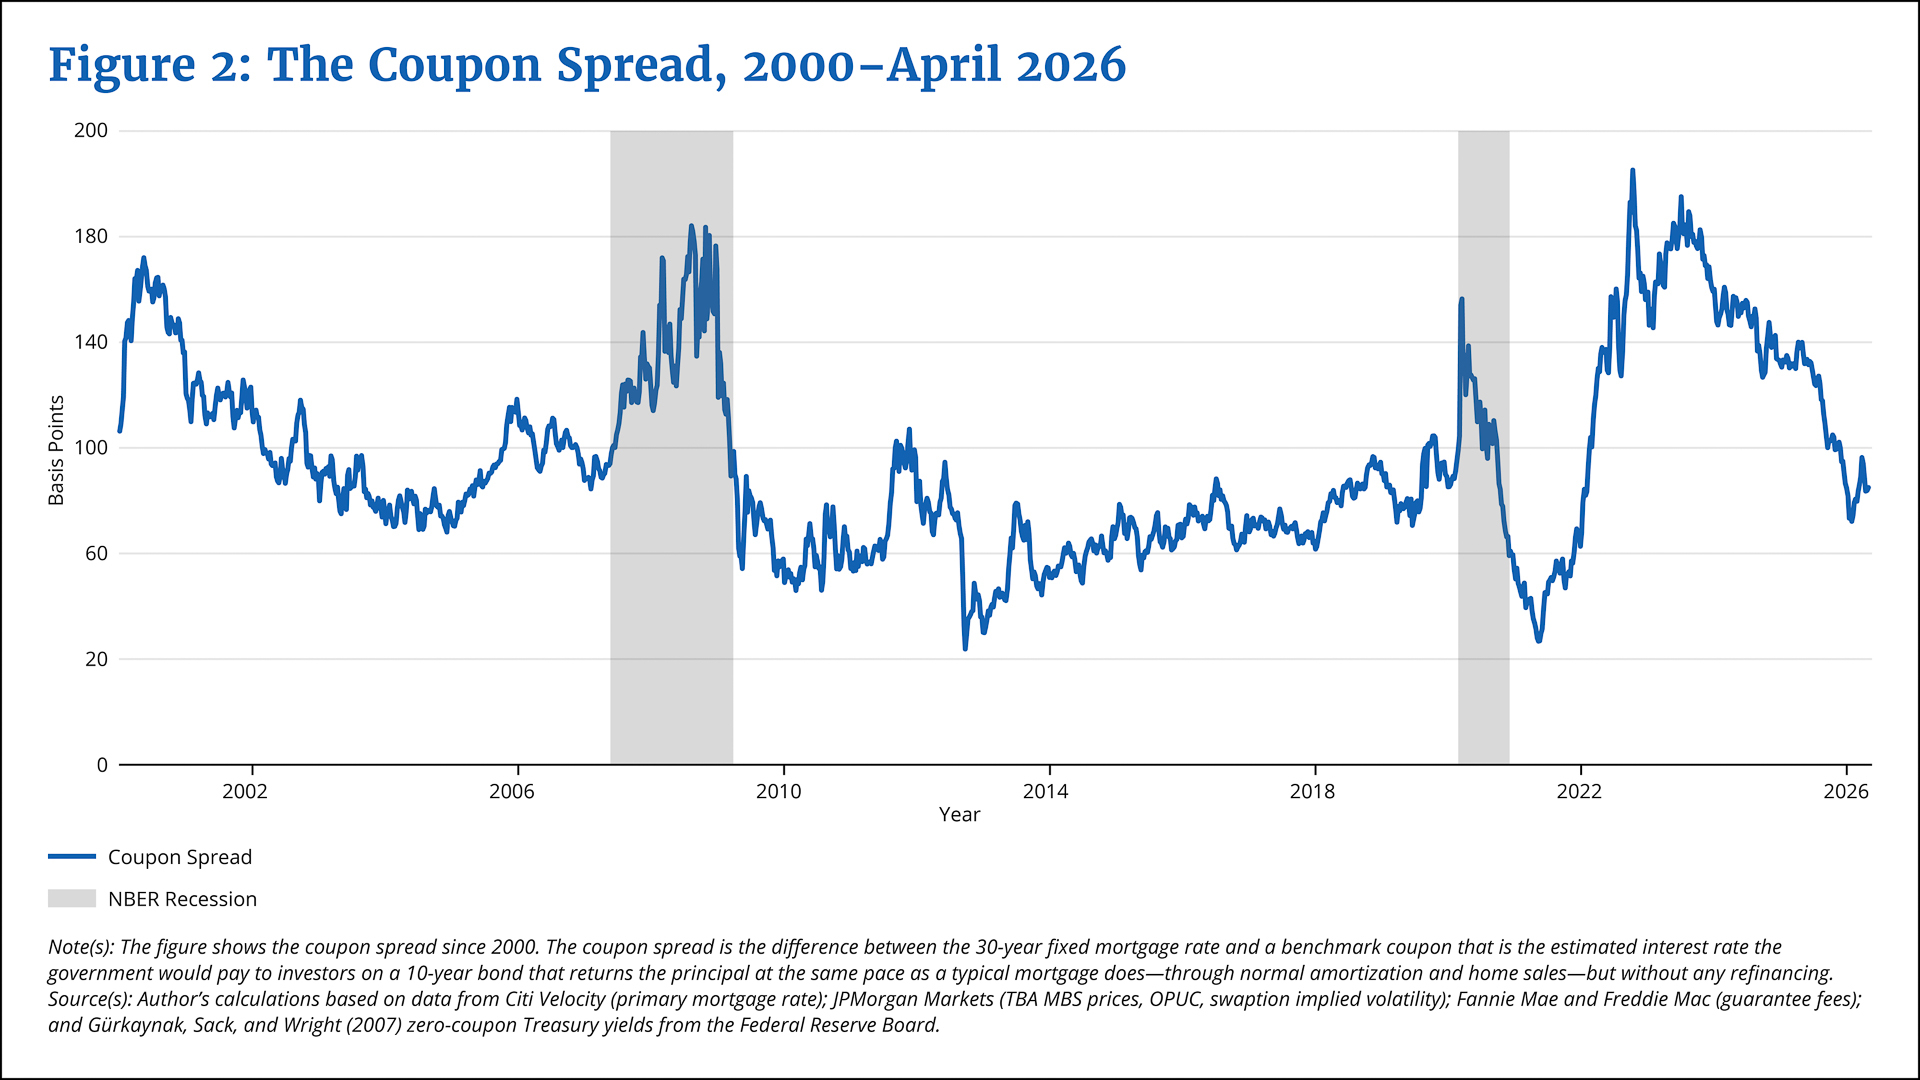
As noted, the 10-year Treasury yield is an imperfect reference for the mortgage rate: An MBS and a Treasury note differ in their cash flows, their credit risk, and whether a borrower pays an intermediation margin on top of the underlying rate. To build a better reference, I construct a hypothetical benchmark bond—a 10-year Treasury note adjusted to mimic a mortgage—and define the coupon spread as the difference between the mortgage rate and the coupon on this bond.
I construct the benchmark bond in three steps, each addressing one of the differences.1
Cash flows: A Treasury returns principal in a lump sum at maturity; a mortgage returns it gradually through amortization and home sales. The benchmark bond returns principal at the same pace as a mortgage, but with no refinancing.
Credit insurance: Mortgage investors (that is, MBS buyers) are protected against borrower default by Fannie Mae and Freddie Mac, which charge a guarantee fee (about 42 basis points) for this insurance. I add the guarantee fee to the benchmark’s coupon so that the benchmark matches the credit quality of a Treasury note.
Intermediation: Lenders earn their compensation by selling the mortgage (packaged with other mortgages as an MBS) to investors at a price above par (that is, above the face value of the loan), and the premium compensates them for originating, packaging, and selling the loan. I capture this markup by pricing the benchmark bond above par by that same premium, using a measure known as OPUC (originator profits and unmeasured costs), following Fuster et al. (2013).
Even after all three adjustments, the coupon spread—the difference between the mortgage rate and the coupon on this adjusted benchmark bond—is still large and volatile (Figure 2).
Federal Reserve Bank of Boston
The Prepayment Option’s Effect on the Coupon Spread
The prepayment option is central to explaining the coupon spread. It makes a mortgage fundamentally different from a Treasury note. As noted earlier, the government has to continue paying interest to investors on Treasury notes until the note matures, but borrowers can pay off their mortgages at any time without incurring a penalty fee. This creates an asymmetry with mortgages that benefits borrowers at the expense of MBS investors.
Also as noted earlier, when interest rates fall, borrowers refinance into less expensive mortgages and pay off their existing mortgages. Investors receive their principal back early—but it’s when reinvestment opportunities offer lower yields. When interest rates rise, borrowers keep their low-rate mortgages instead of refinancing. Investors remain locked into below-market coupons (the yield on the MBS) when new investments would pay more. Borrowers win in both scenarios; investors lose in both. This asymmetry is valuable to borrowers and costly to investors, so investors demand compensation through larger mortgage spreads, or, in the context of this brief, larger coupon spreads.
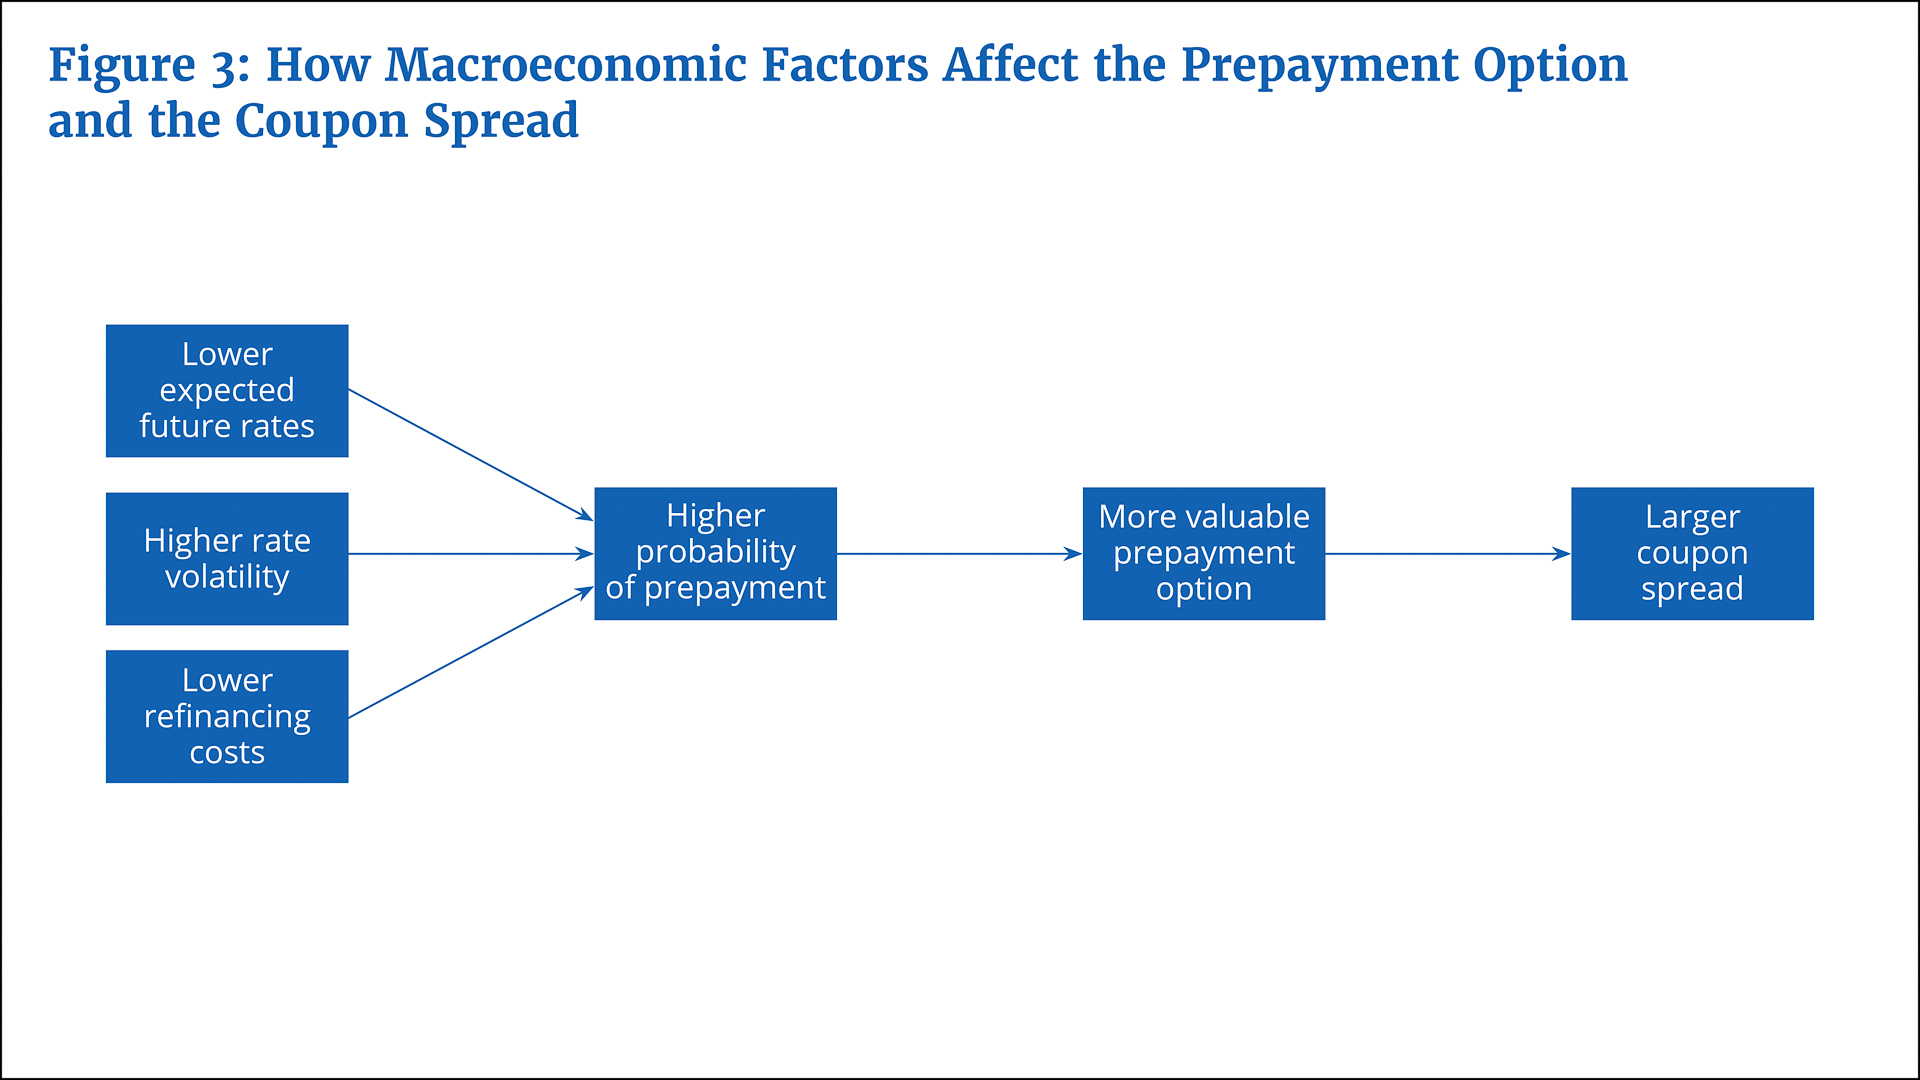
What makes the prepayment option more valuable or less valuable? Three factors matter. The first is expectations about future interest rates: If rates are expected to fall, refinancing is more likely, and the value of the option rises. The second is interest rate volatility: Even if rates are expected to stay flat, higher volatility means a greater chance they could fall enough to trigger refinancing. Third is the cost of refinancing. The intermediaries that originate a mortgage charge a margin to cover their costs, and that margin fluctuates with demand: When many borrowers want to refinance at the same time, originators become capacity-constrained, and the margin rises. When the margin is unusually high, markets anticipate it will fall back to normal levels as capacity catches up, making future refinancing more likely even if interest rates stay flat.
Federal Reserve Bank of Boston
Figure 3 illustrates how these factors combine to determine the value of the prepayment option. If the coupon spread compensates MBS investors for bearing prepayment risk—the higher the option’s value, the greater the risk, the larger the spread—then these same factors should explain changes in the spread over time. This is exactly what I find.
Which Factors Explain Coupon Spread Variation?
I measure the three factors identified in the preceding section—expectations about future interest rates, interest rate volatility, and the cost of refinancing—and estimate their contributions to coupon spread variation using a rolling regression—a statistical model that is re-estimated each week using only the preceding five years of data, allowing the relationship between each of the three factors and the spread to evolve over time. Together, these factors explain approximately 80 percent of the variation in the coupon spread since 2006.
I measure expectations about future interest rates by looking at the slope of the Treasury yield curve, which reflects the difference between 10-year and two-year Treasury rates. Monetary policy affects the yield curve because short-term yields are heavily influenced by the Federal Reserve’s policy rate; longer-term yields are driven by market expectations about future short-term interest rates, which are shaped by what the Fed says about the likely future course of monetary policy but ultimately determined by market participants. When the difference between the two yields is large (a “steep” curve), markets expect rates to rise, making refinancing less likely. When the curve is flat or inverted, markets expect rates to remain low or fall, making the prepayment option more valuable. I find that a 1 percentage point steepening of the yield curve (an increase in the difference between the 10-year and two-year Treasury rates) reduces the spread by about 40 basis points. I measure interest rate volatility using swaption implied volatility2 and find that a 10 basis point increase widens the spread by about 15 basis points. I measure refinancing costs using OPUC (Fuster et al. 2013).
Federal Reserve Bank of Boston
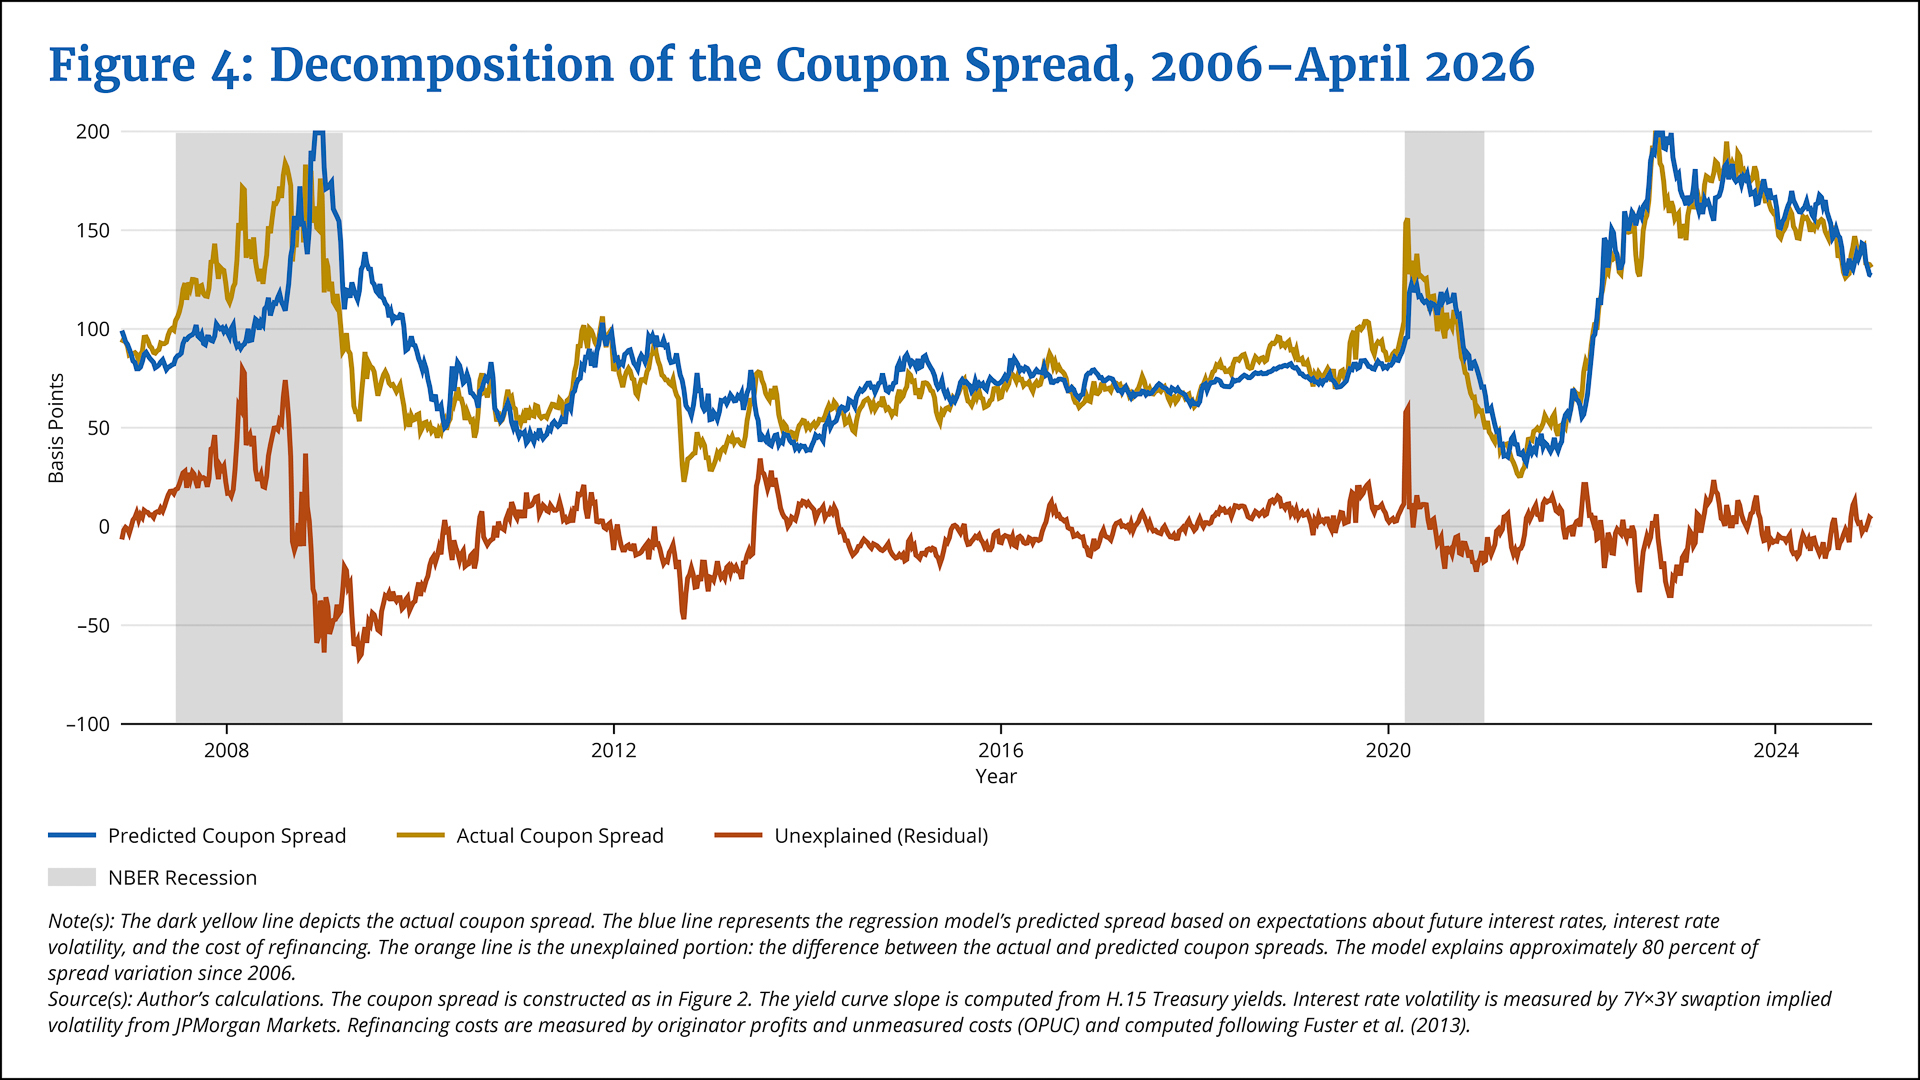
Figure 4 shows the results of the regression analysis. The dark yellow line depicts the actual coupon spread; the blue line represents the regression model’s predicted spread based on the aforementioned three factors; and the orange line is the unexplained portion (or, residual)—the difference between the actual and predicted spreads.3 In normal times, the spreads are very similar; the portion of the actual spread that is not explained by the three factors is typically within plus or minus 20 basis points. Large differences between the actual and predicted spreads appear only during crisis periods—the 2007–2009 financial crisis and the COVID-19 pandemic—when market dislocations temporarily increased the actual coupon spread beyond what these factors would predict.
Coupon Spread Variation in Recent Years and Implications for Monetary Policy
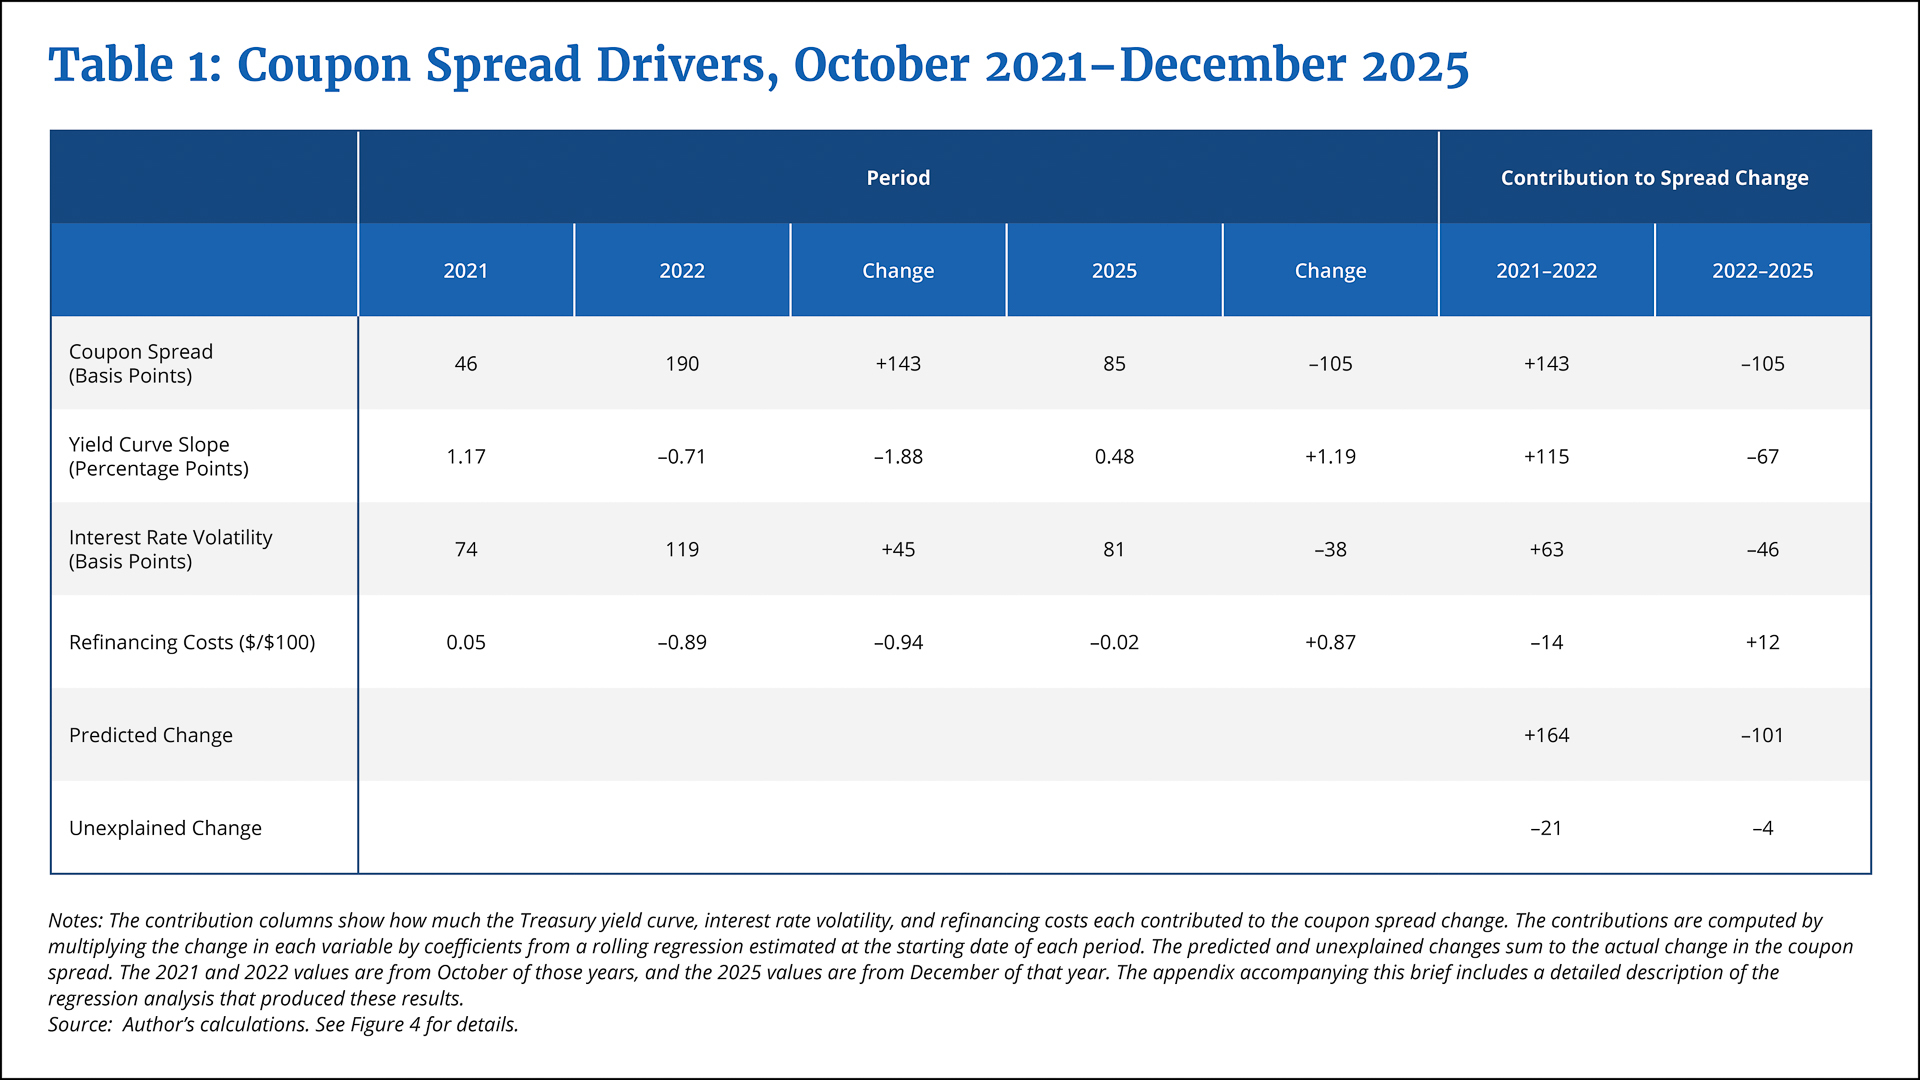
The dynamics of the coupon spread in the monetary policy tightening cycle that started at the end of 2021 is particularly instructive. Table 1 shows the evolution of the key variables—the Treasury yield curve, interest rate volatility, and refinancing costs—from October 2021 to October 2022 and from October 2022 through December 2025, along with a breakdown of coupon spread changes over these two periods. In October 2021, the Treasury yield curve was steep (the difference between 10-year and two-year Treasury yields was 1.17 percentage points), interest rate volatility was low (74 basis points), and the coupon spread stood at just 46 basis points. Markets believed that the probability of a reduction in rates was low, so borrowers were unlikely to find a better deal later, and the prepayment option had little value.
Then the Fed began tightening monetary policy (raising interest rates). By October 2022, the yield curve had inverted sharply—falling by 1.88 percentage points to −0.71 percentage point—and interest rate volatility had jumped by 45 basis points to 119 basis points as markets struggled to gauge where the Fed rate hikes would stop. The coupon spread more than quadrupled to 190 basis points, an increase of 143 basis points.
Federal Reserve Bank of Boston
How much of this increase came from each driver? The regression analysis (the last two columns in Table 1) shows that given the big swings in the three factors, a large increase in the coupon spread was to be expected. The model predicts an increase of 164 basis points, slightly overshooting the actual increase of 143 basis points.4
Conditions started normalizing in 2022, and by the end of 2025, the yield curve had steepened by 1.19 percentage points back to 0.48 percentage point, and volatility fell by 38 basis points to 81 basis points. As a result, the coupon spread decreased by 105 basis points to 85 basis points. As the last column of Table 1 shows, my model predicts a 101 basis point decrease in the coupon spread, leaving −4 basis points of the change in the spread unexplained. Throughout both segments of the sample period (before and after October 2022), the regression model’s predicted coupon spread closely tracks the actual coupon spread.
One implication of these findings is that monetary policy can have large effects on the coupon spread even if the Fed does not purchase mortgage-backed securities, as it did during the Global Financial Crisis and the COVID-19 pandemic. While policy discussions often focus on the Fed’s direct intervention in the mortgage market,5 conventional monetary policy—that is, raising or lowering interest rates—through its effects on the yield curve and interest rate volatility, is still important.
Endnotes
- I describe in detail how I estimate the benchmark coupon in the appendix accompanying this brief.
- Swaption implied volatility reflects the market’s expectations for future volatility in swap rates. A swap rate is the fixed interest rate that one party in a swap agreement received or pays for a floating rate over a specified period. The fixed rate remains constant throughout the swap’s duration, while the floating rate resets periodically based on market indexes. A swap enables the parties involved to hedge against interest rate volatility.
- The unexplained portion is similar in principle to the option-adjusted spread (OAS) widely used by practitioners. Both aim to strip the value of the prepayment option out of the mortgage spread. The difference is methodological: OAS relies on a proprietary prepayment model to value the option directly, while this approach uses a regression on observable factors that drive the option’s value. See the appendix for a more detailed discussion.
- See the appendix for details on the model used to predict each of the three factors’ contribution to changes in the coupon spread.
- See the appendix for a discussion on how the Fed’s direct intervention in the mortgage market has affected mortgage spreads in recent years.
References
Fuster, Andreas, Laurie Goodman, David Lucca, Laurel Madar, Linsey Molloy, and Paul Willen. 2013. “The Rising Gap between Primary and Secondary Mortgage Rates.” Economic Policy Review, Federal Reserve Bank of New York 19(2): 17–39.
Gürkaynak, Refet S., Brian Sack, and Jonathan H. Wright. 2007. “The U.S. Treasury Yield Curve: 1961 to the Present.” Journal of Monetary Economics 54(8): 2291–2304.

 About the Authors
Paul S. Willen,
Federal Reserve Bank of Boston
Paul S. Willen is a principal economist and policy advisor in the Federal Reserve Bank of Boston Research Department.
Email: Paul.Willen@bos.frb.org
Resources
Site Topics
Keywords
- mortgage rates ,
- mortgage spread ,
- Treasury yields ,
- prepayment option ,
- mortgage-backed services ,
- yield curve
JEL Codes
- E43 ,
- G21
Citation
Willen, Paul S. 2026. “Why Mortgage Rates Exceed Treasury Yields.” Federal Reserve Bank of Boston Current Policy Perspectives 26-3.