New England Economic Conditions through April 14, 2026 


Key Takeaways
- Payroll employment in New England declined by 0.3 percent in January 2026 compared with one year earlier, and year-over-year payroll employment growth in the region for December 2025 was revised downward. US payroll employment growth for January 2026 was slightly positive.
- Household employment measures for New England offered additional evidence of labor market weakening, as the unemployment rate rose 0.5 percentage point in January 2026 from one year earlier, and both the labor force participation rate and the employment-to-population ratio declined over the same period.
- • A large surge in gasoline prices in March from the previous month contributed to an increase in overall inflation rates in both New England and the United States. Year-over-year inflation reached 2.9 percent in New England in March, up from 1.2 percent in February.
- Construction activity in the region showed mixed results, as nonbuilding construction was down sharply in February 2026 from one year earlier, while both residential and nonresidential building construction increased at a brisk pace.
Payroll Employment
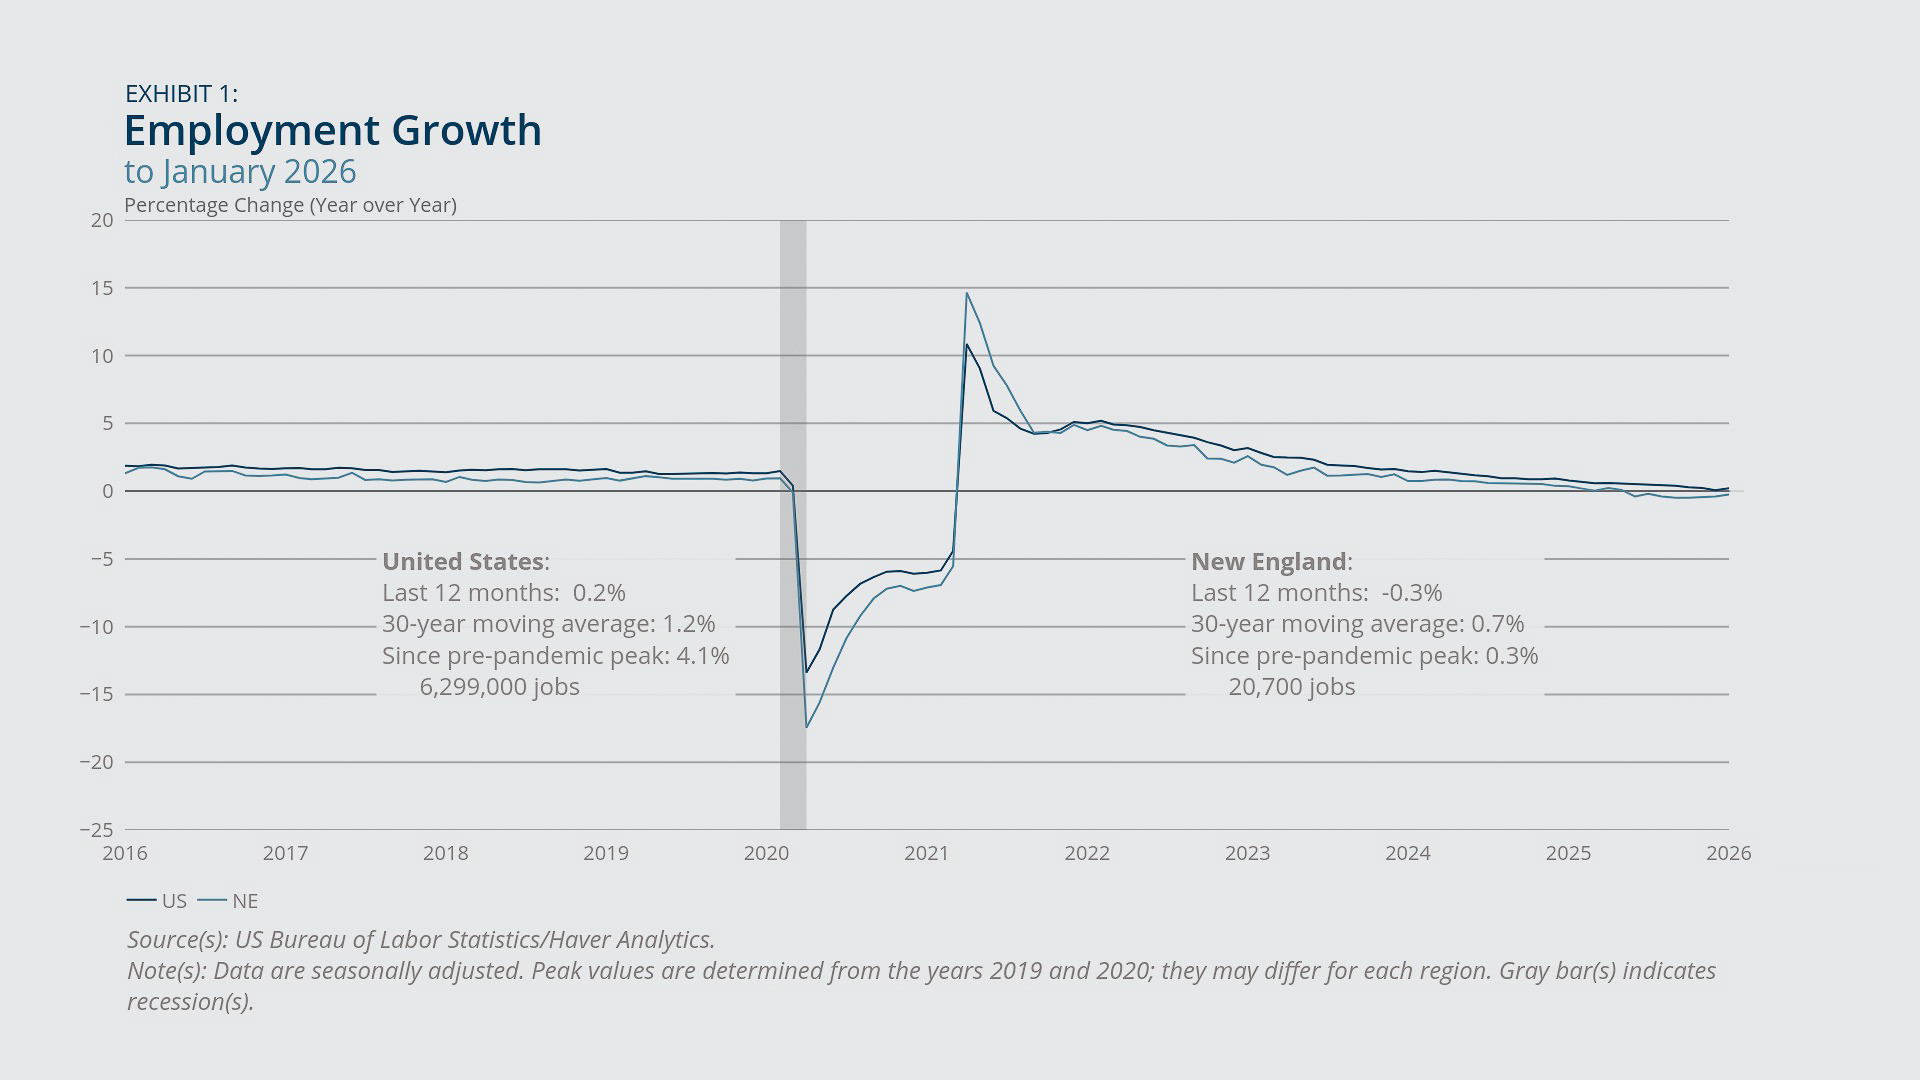
- Payroll employment in New England declined modestly in January 2026 from a year earlier, while US employment rose by a very small percentage for the same period. Those rates fell well short of their respective long-run averages. See Exhibit 1.
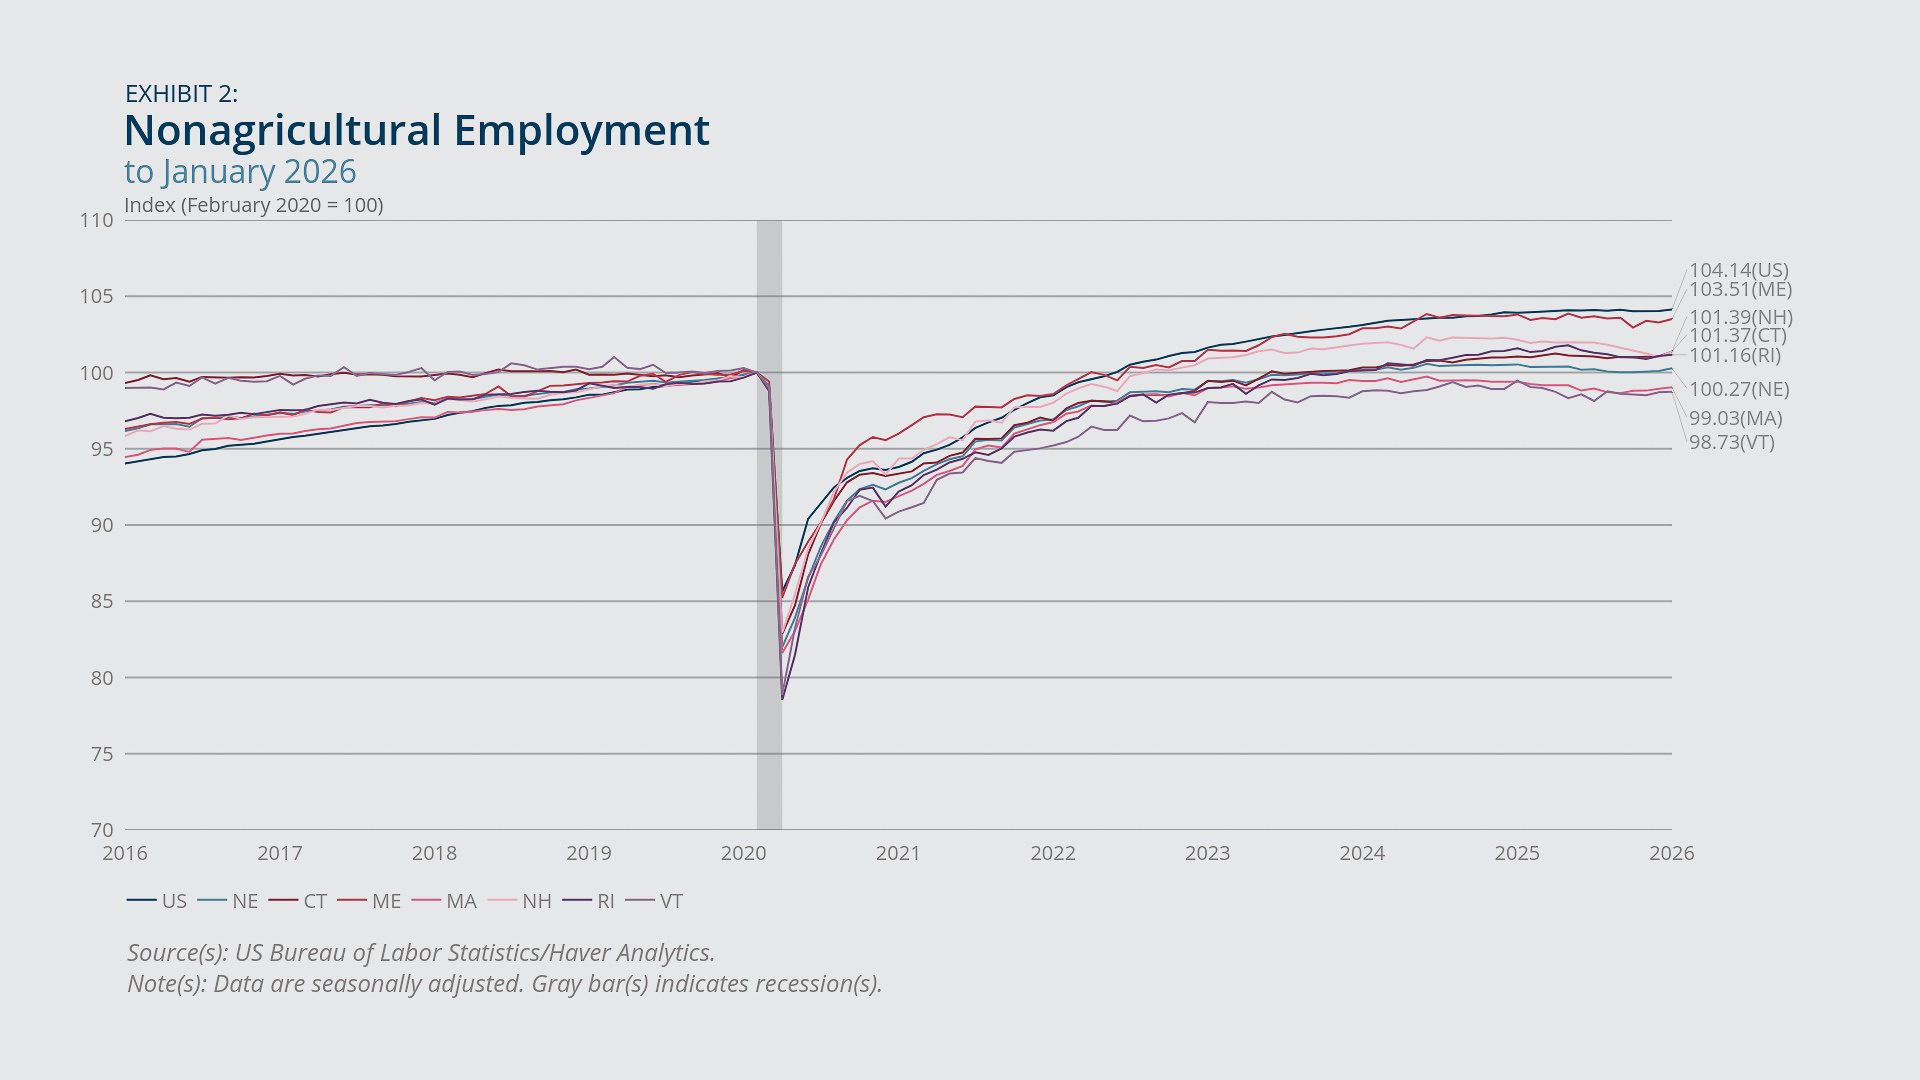
- New England’s payroll employment level for January 2026 exceeds its pre-pandemic peak by roughly 20,700 jobs, reflecting a net decline in employment of nearly 23,000 jobs compared with June 2024. The regional employment decline since that date was driven mostly by Massachusetts. See Exhibit 2.
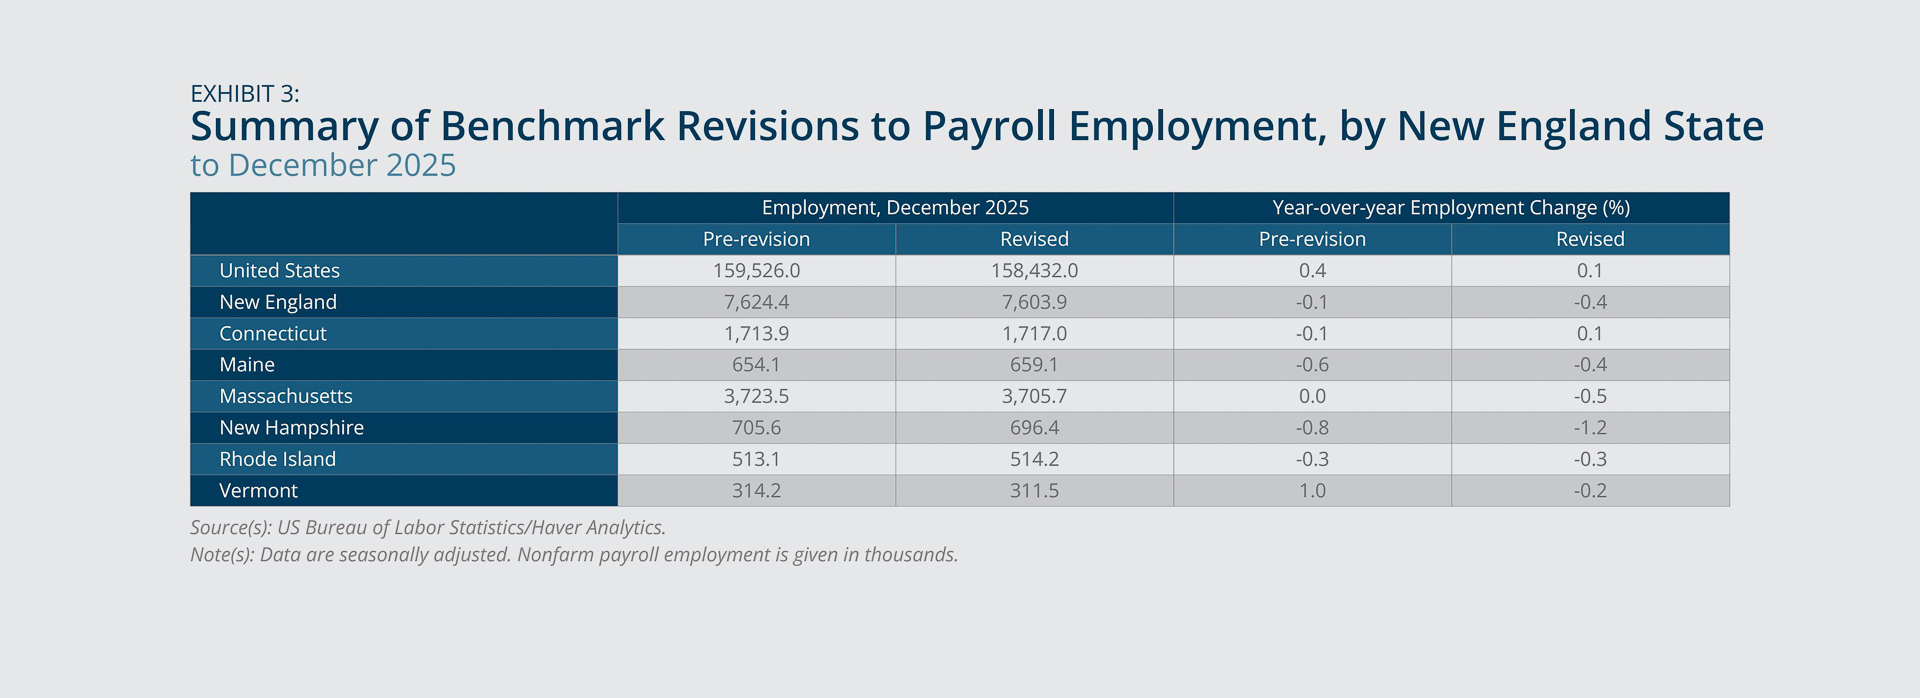
- The US employment level for December 2025 experienced a large downward revision as a result of the recent benchmarking process by the US Bureau of Labor Statistics. The corresponding revision for New England was also negative but was less pronounced than the US revision. The United States and New England experienced similar downward revisions to their respective year-over-year employment growth rates for December 2025. See Exhibit 3.
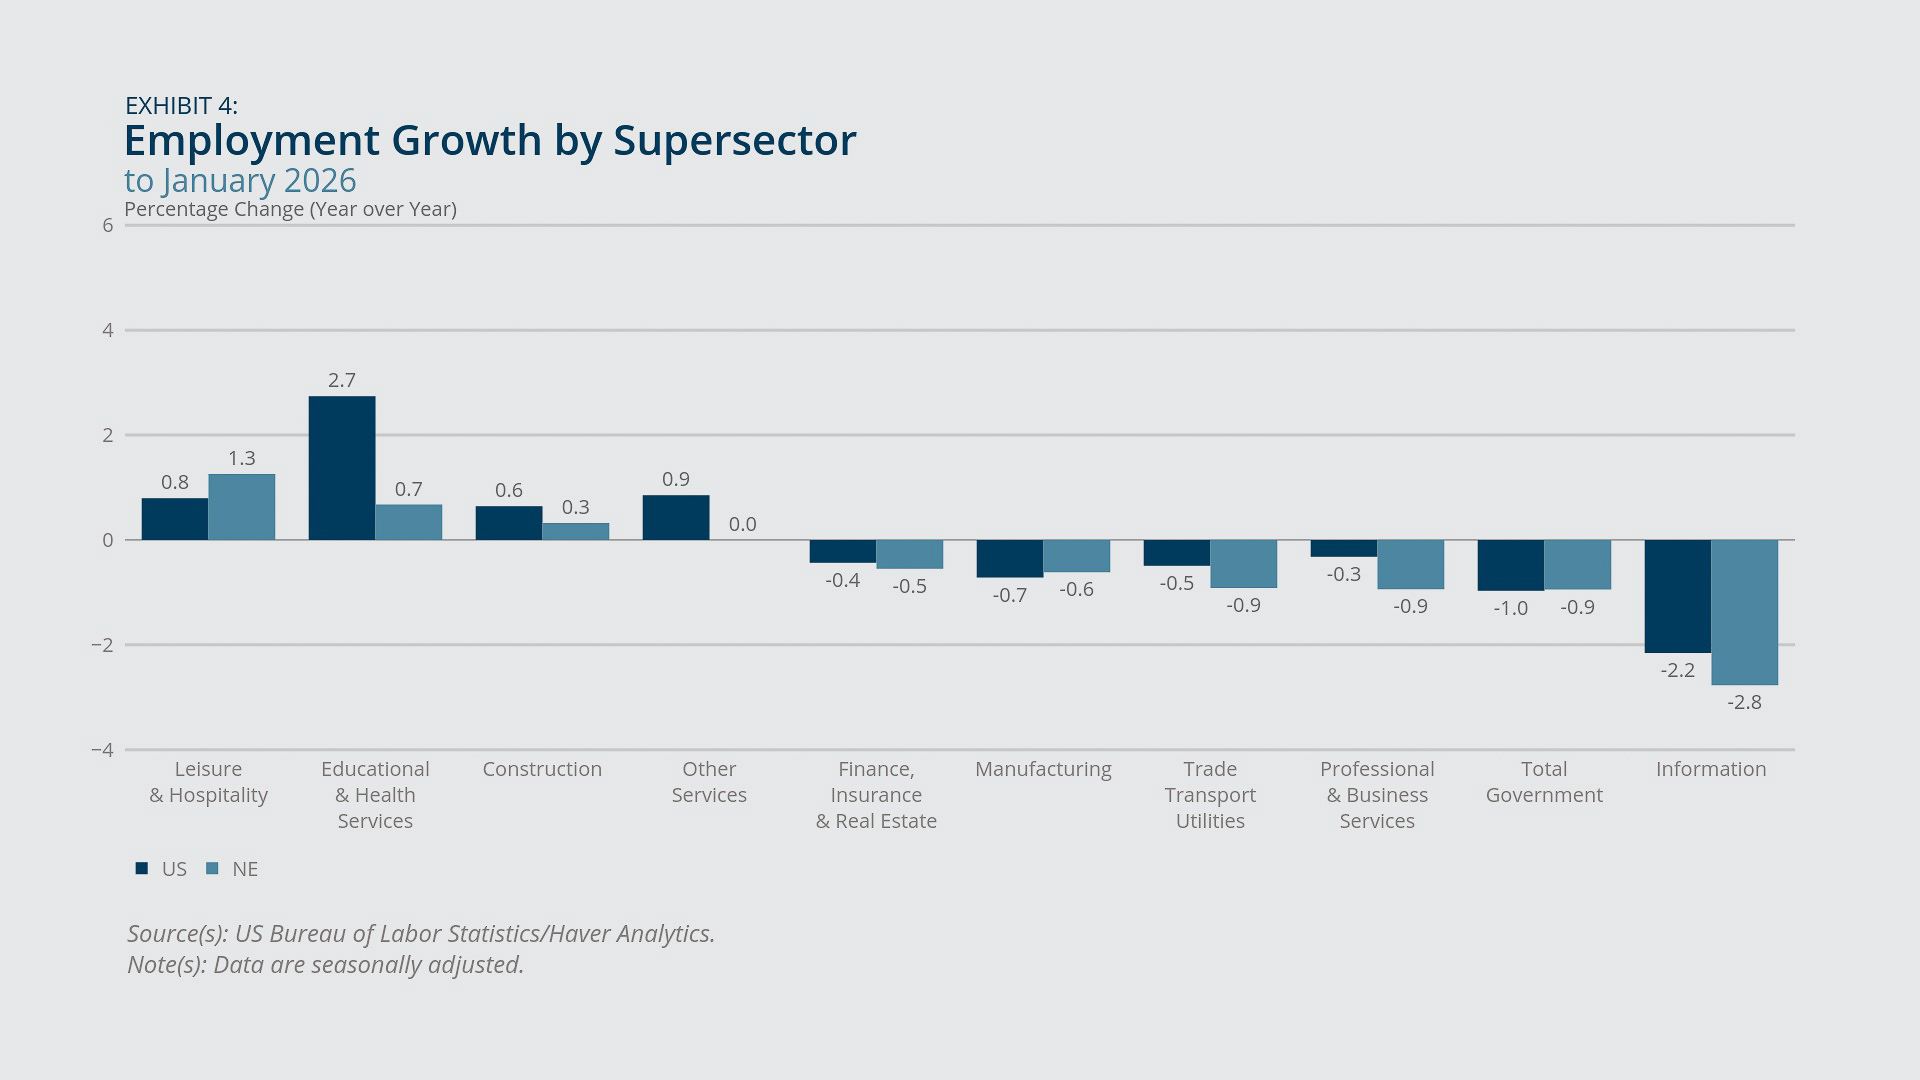
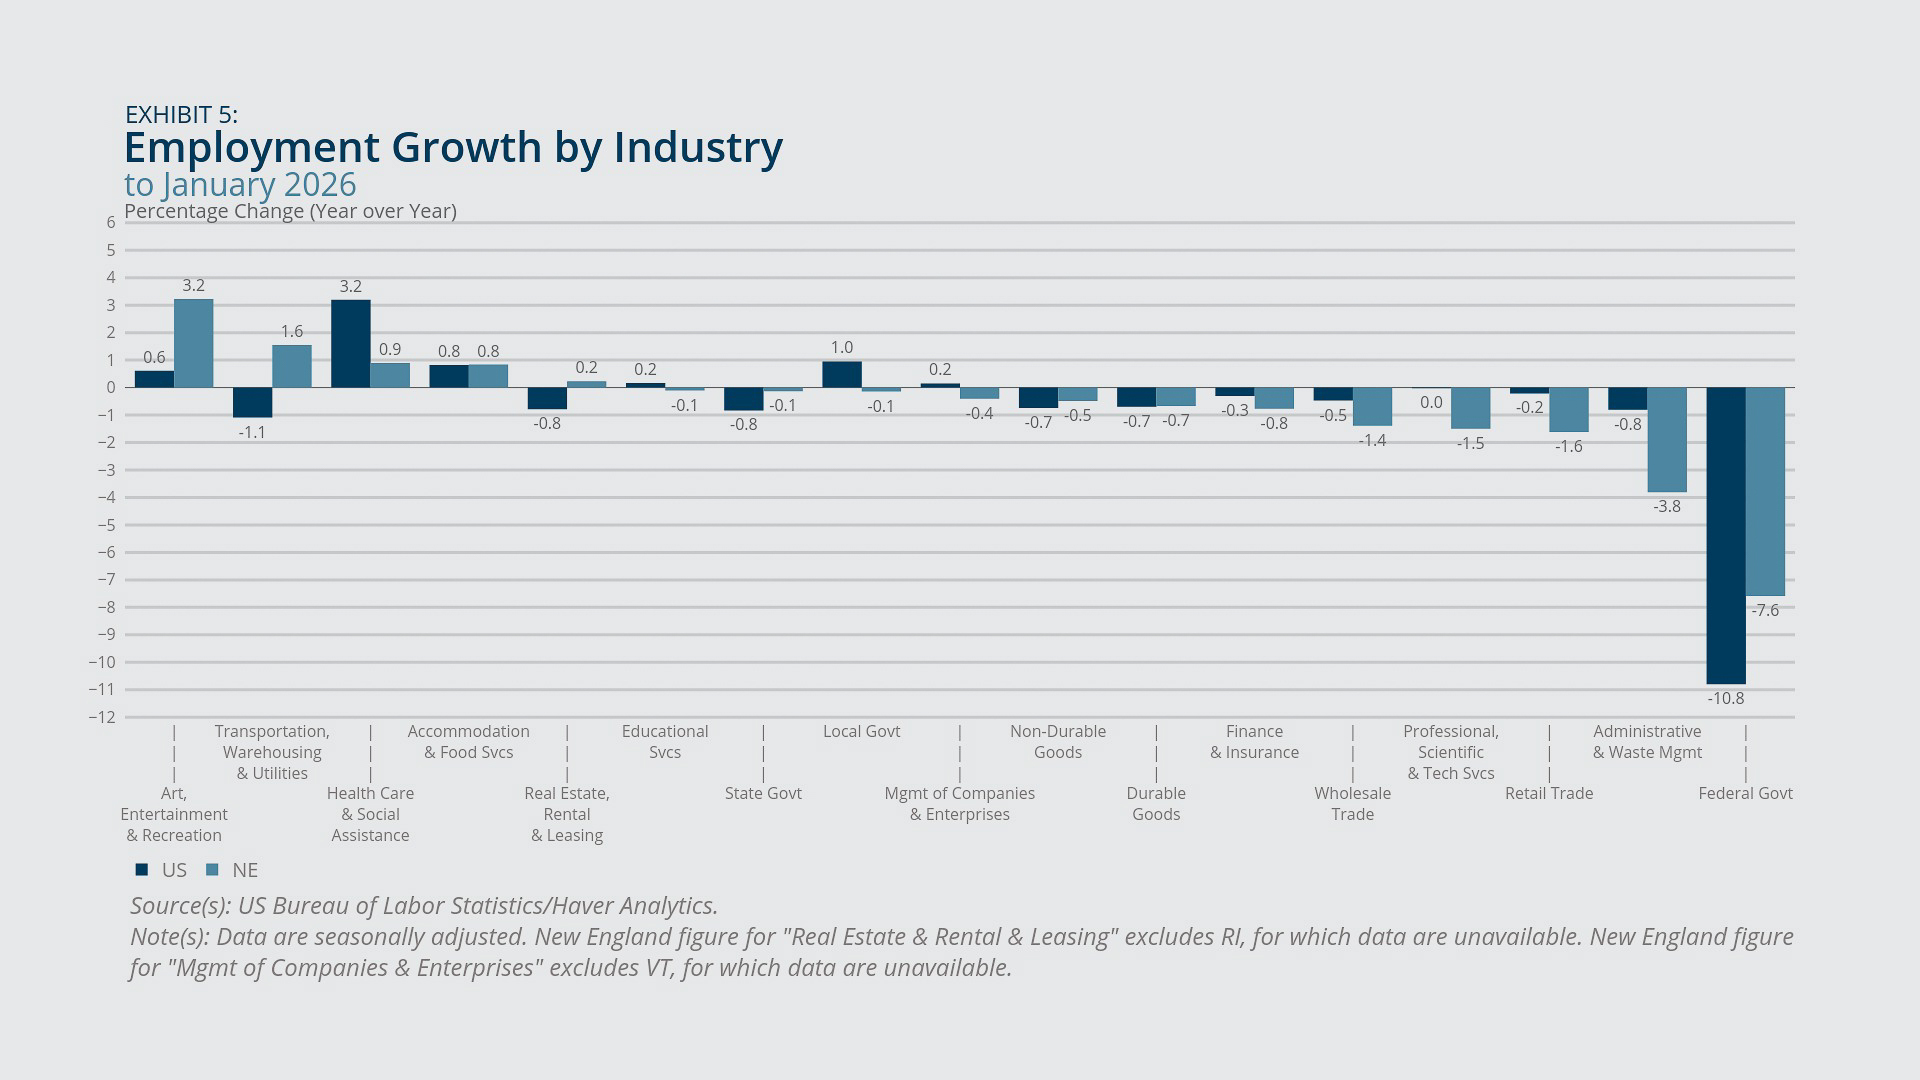
- Among sectors in New England, leisure and hospitality showed the strongest employment growth in January 2026 from one year earlier, and information showed the weakest. The region’s educational and health services sector experienced positive job growth that nonetheless lagged behind the US sector’s growth. See Exhibit 4.
New England registered a –0.3 percent decline in payroll employment in January 2026 compared with one year earlier, and the United States experienced employment growth of 0.1 percent (Exhibit 1). 1, 2 Those rates are roughly unchanged from December 2025 and are both low in historical terms. For the same period, each New England state except Connecticut experienced an employment decline. According to the US Bureau of Labor Statistics (BLS), however, none of the employment changes in individual New England states from January 2025 through January 2026 was statistically significant.
Despite showing a decline from the previous year, New England employment in January 2026 increased from the previous month by 17,000 jobs, following seven months of stagnant employment levels. However, no individual New England state experienced a statistically significant employment change in January 2026 from the previous month, as margins of error on single-month changes at the state level tend to be large.
As of January 2026, payroll employment in New England exceeded its pre-pandemic peak by slightly less than 0.3 percent, or 20,700 jobs. See Exhibit 2. That represents a decline of nearly 23,000 jobs compared with June 2024, when the region reached its peak post-pandemic employment level. Among the New England states, Maine continued to show the largest cumulative employment increase over February 2020, while both Massachusetts and Vermont had yet to recover their respective pre-pandemic employment levels. The region’s overall job losses since June 2024 reflect a large decline (more than 26,000 jobs) in Massachusetts, as well as smaller declines in New Hampshire and Vermont and net job gains in the other New England states.
Exhibit 3 shows recent revisions by the BLS to December 2025 employment levels and year-over-year growth rates for the United States, New England, and the region’s individual states. New England’s employment growth rate was revised downward to –0.4 percent from –0.1 percent, and its employment level was revised downward by 20,500 jobs, or –0.2 percent. US employment growth was revised downward to 0.1 percent from 0.4 percent, and the employment level was revised downward by 1,094,000, or –0.6 percent, the largest percentage revision since 2009. New Hampshire, Massachusetts, and Vermont experienced downward revisions to their respective December 2025 employment levels and growth rates, while Connecticut, Maine, and Rhode Island experienced upward revisions (or no change) to their respective December 2025 employment levels and growth rates. Comparing revisions to December 2025 employment levels among New England states shows that Massachusetts saw the largest downward revision in absolute terms (–17,800 jobs) and New Hampshire experienced the largest negative adjustment in percentage terms (–1.3 percent). Vermont showed the largest downward revision to the December 2025 year-over-year employment growth rate. It declined from 1.0 percent to –0.2 percent.
Similarly to the United States, New England experienced job growth (in January 2026 from a year earlier) in relatively few sectors (or industries), as most sectors (or industries) experienced flat or declining employment over that time period (Exhibits 4 and 5). With only a few exceptions, job growth rates by sector (or industry) in New England for January 2026 were lower than the corresponding rates for the United States. In particular, job growth in New England’s educational and health services sector fell well short of the comparable figure for the United States, reflecting a combination of much weaker job growth (compared with the United States) in the health care and social assistance industry and somewhat weaker growth (involving modest job losses in New England) in the educational services industry. Both the United States and New England registered large losses in federal government jobs in January 2026 from one year earlier, though the percentage decline was somewhat less dramatic in New England (–7.6 percent) than in the United States (–10.8 percent). The decline in these jobs reflects a combination of several US policy actions aimed at reducing the size of the federal workforce, including the 2025 US federal deferred resignation program (DRP), which induced a large number of separations that became effective December 31, 2025.3
New England also experienced considerable job losses in private white collar sectors, including finance, insurance, and real estate; professional and business services; and information. Within the professional and business services sector, jobs in scientific and technical services showed an especially steep decline (Exhibit 5). These sectors have been losing jobs for a while, both in the region and nationwide. Employment in New England’s professional and business services sector peaked in March 2023 and, as of January 2026, was down 2.6 percent from that peak. Employment in that same sector nationally peaked in May 2023 and, as of January 2026, was down nearly 2 percent. Information sector employment peaked around January 2023 in both New England and the United States and was down nearly 9 percent in the region and 8 percent nationwide as of January 2026. The labor economist Gad Levanon, in his ongoing Substack column Labor Matters, argues that declining white collar employment represents a national, structural phenomenon driven by productivity growth in these sectors that might be attributed to the adoption of AI and related technologies.4

Federal Reserve Bank of Boston
Federal Reserve Bank of Boston
Federal Reserve Bank of Boston
Federal Reserve Bank of Boston
Federal Reserve Bank of Boston
Household Employment
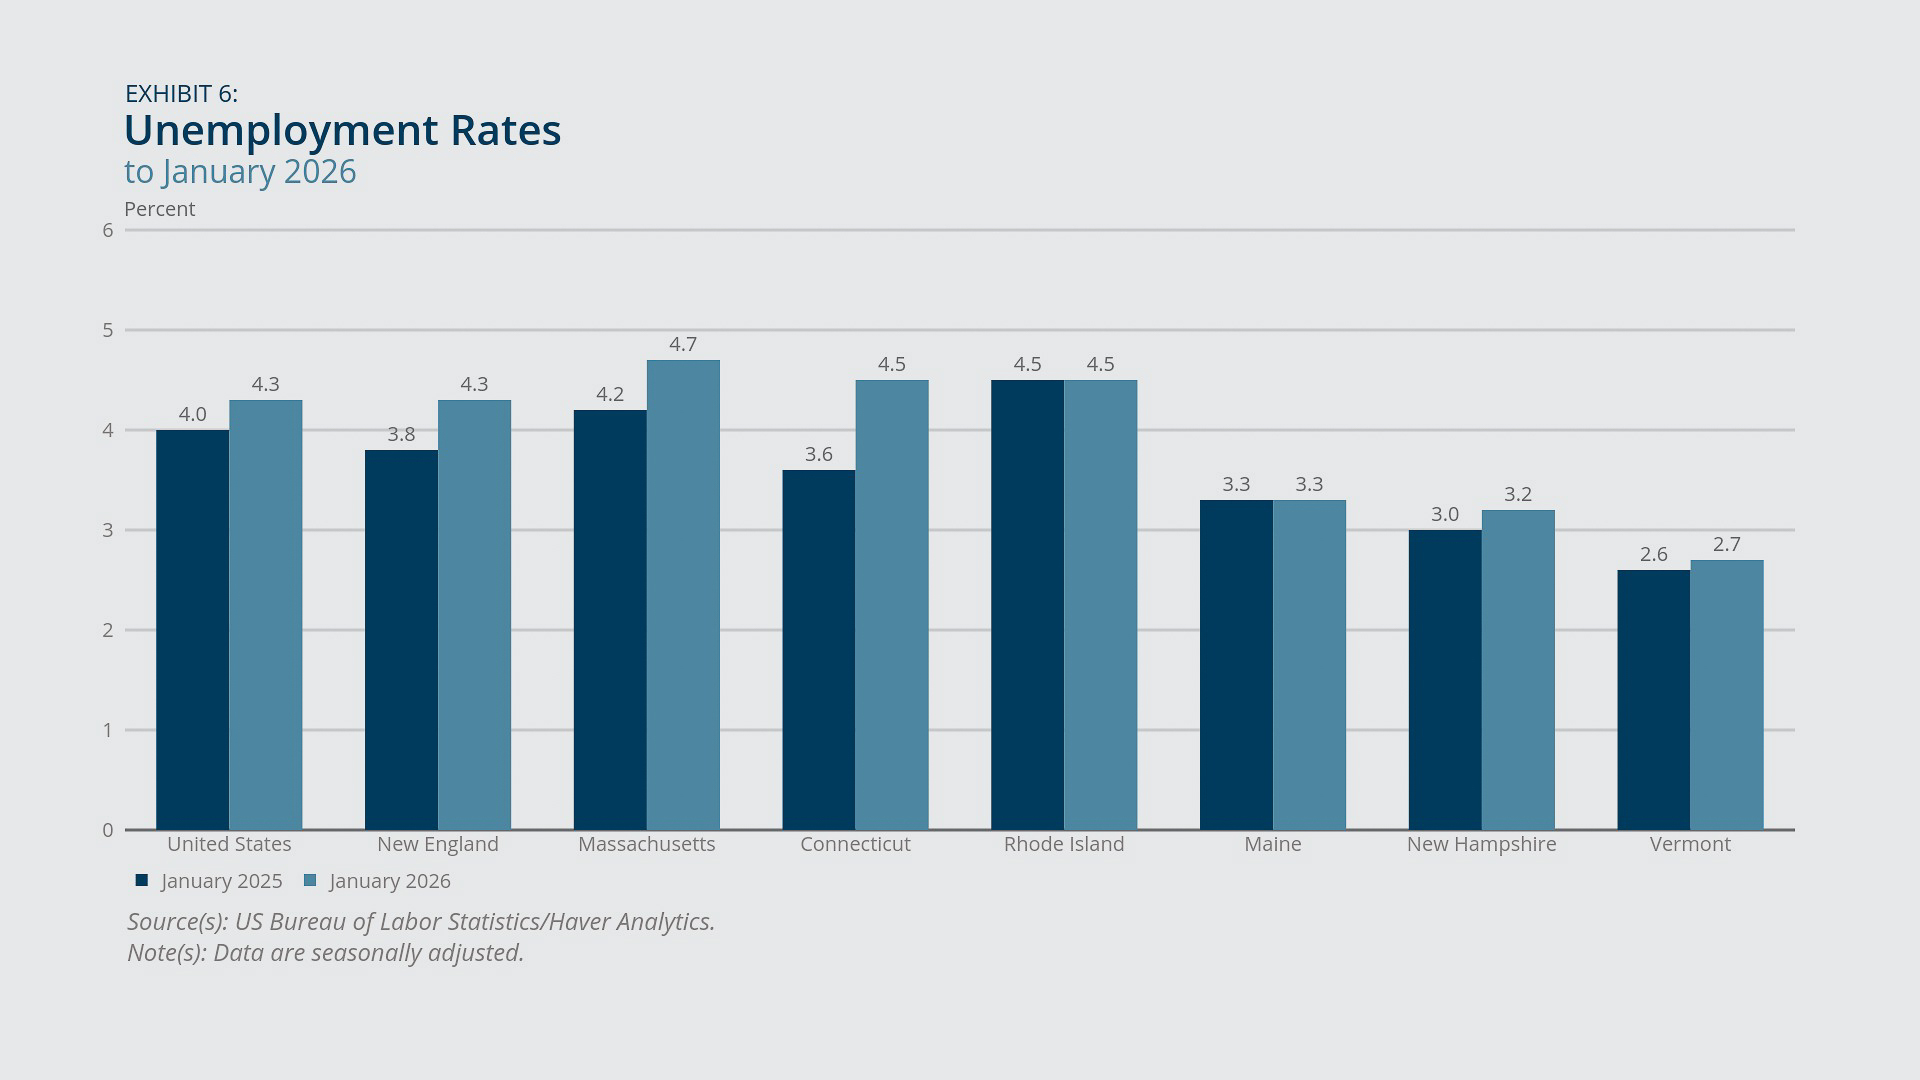
- The unemployment rate in New England reached 4.3 percent in January 2026, the same as the US unemployment rate for that month. One year earlier, New England’s unemployment rate, at 3.8 percent, was slightly lower than the US rate of 4.0 percent. See Exhibit 6.
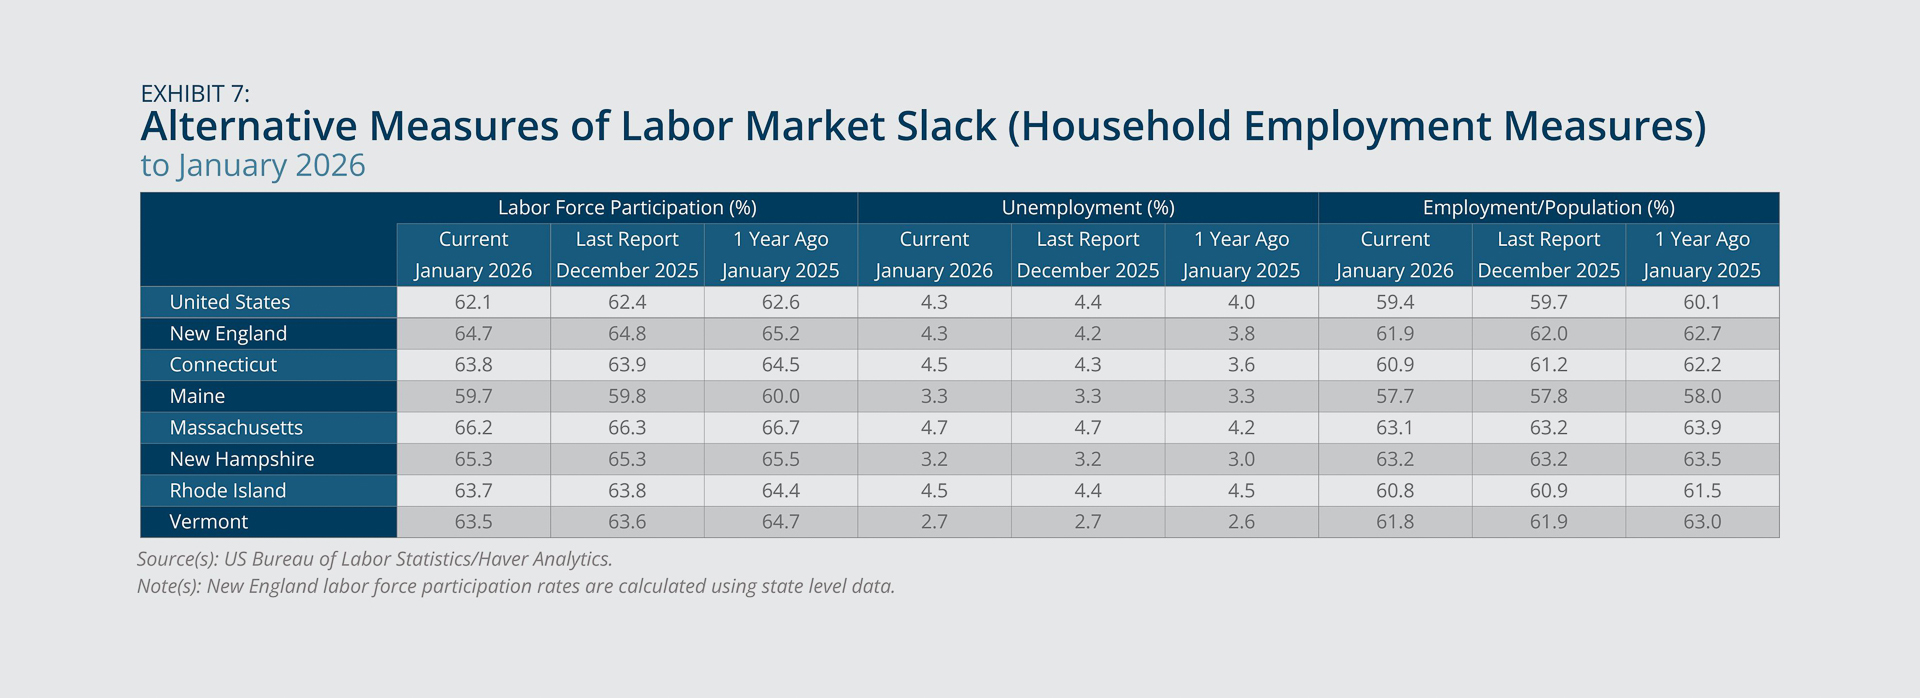
- New England’s labor force participation rate and its employment-to-population ratio both declined in January 2026 from the previous January. These same measures (over the same period) also declined—to varying degrees—in each New England state and in the United States as a whole. See Exhibit 7.
- Taken together, the household employment measures indicate that both labor demand and labor supply receded in the 12 months ending with January 2026, in the New England states and nationwide.
As shown in Exhibit 6, the unemployment increase in New England from January 2025 to January 2026 was driven mostly by Connecticut and Massachusetts. Connecticut experienced a large, statistically significant increase in unemployment over that period; Massachusetts saw a more moderate (but still significant) increase; Rhode Island registered no change in its unemployment rate; and the remaining states showed increases that were small and statistically insignificant.5 Unemployment rate changes from December 2025 to January 2026 for individual New England states were not statistically significant.
As unemployment increased in New England in January 2026 from one year earlier, labor force participation fell 0.5 percentage points for the same period. See Exhibit 7. Participation rates fell in each New England state. The declines ranged from 0.2 percentage points in New Hampshire to 1.2 percentage points in Vermont. Labor force participation retreated 0.5 percentage point in the United States as well, although New England’s rate still exceeded the US rate by 2.6 percentage points as of January 2026. Employment-to-population ratios were down in January 2026 from one year earlier in the United States (–0.7 percentage point), New England (–0.8 percentage point), and each New England state, with especially large changes in Vermont (–1.2 ppt) and Connecticut (–1.3 ppt).
Taken together, the household employment measures suggest a labor market in which both labor demand and labor supply receded from one year earlier, in the region and nationwide. A study published by the Federal Reserve Bank of San Franscisco cites reduced international immigration as a key factor holding back labor supply in the United States starting in the first half of 2025.6 It is safe to assume this has constrained labor supply in New England recently as well, given the long-standing importance of international immigration for New England’s labor force. The same study finds that reduced labor force participation rates in the native-born population, holding population age composition fixed, also contributed to slower labor-force growth in 2025 in the United States, indicating a potential cyclical downturn in labor supply. The latter development is worth probing at the regional level, as it suggests that falling labor force participation in New England may reflect more than just expected effects of population aging and reduced international immigration.
Federal Reserve Bank of Boston
Federal Reserve Bank of Boston
Inflation
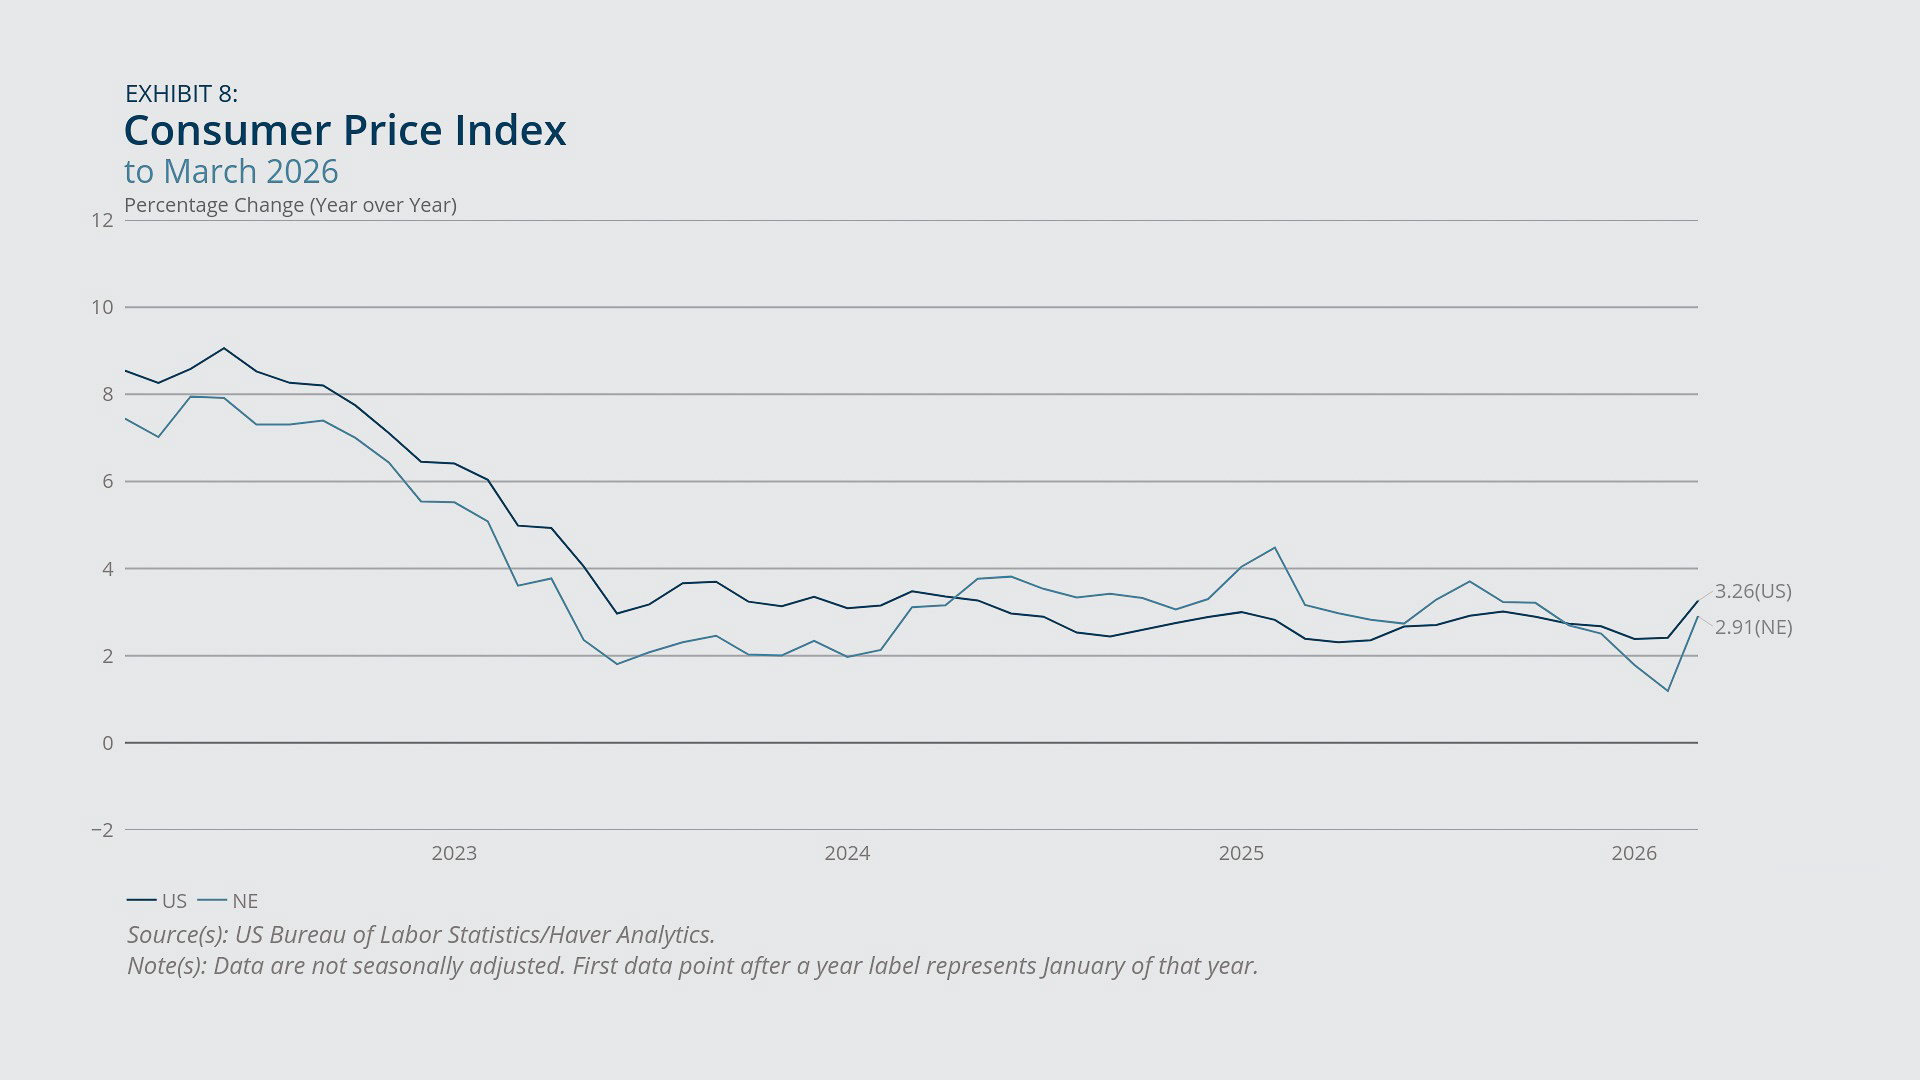
- Consumer prices surged in March from the previous month in both New England and the United States, pushing year-over-year inflation rates considerably higher. See Exhibit 8.
- In both New England and the United States, most of the recent surge in inflation owes to the spike in gas prices that followed from the conflict in the Middle East.
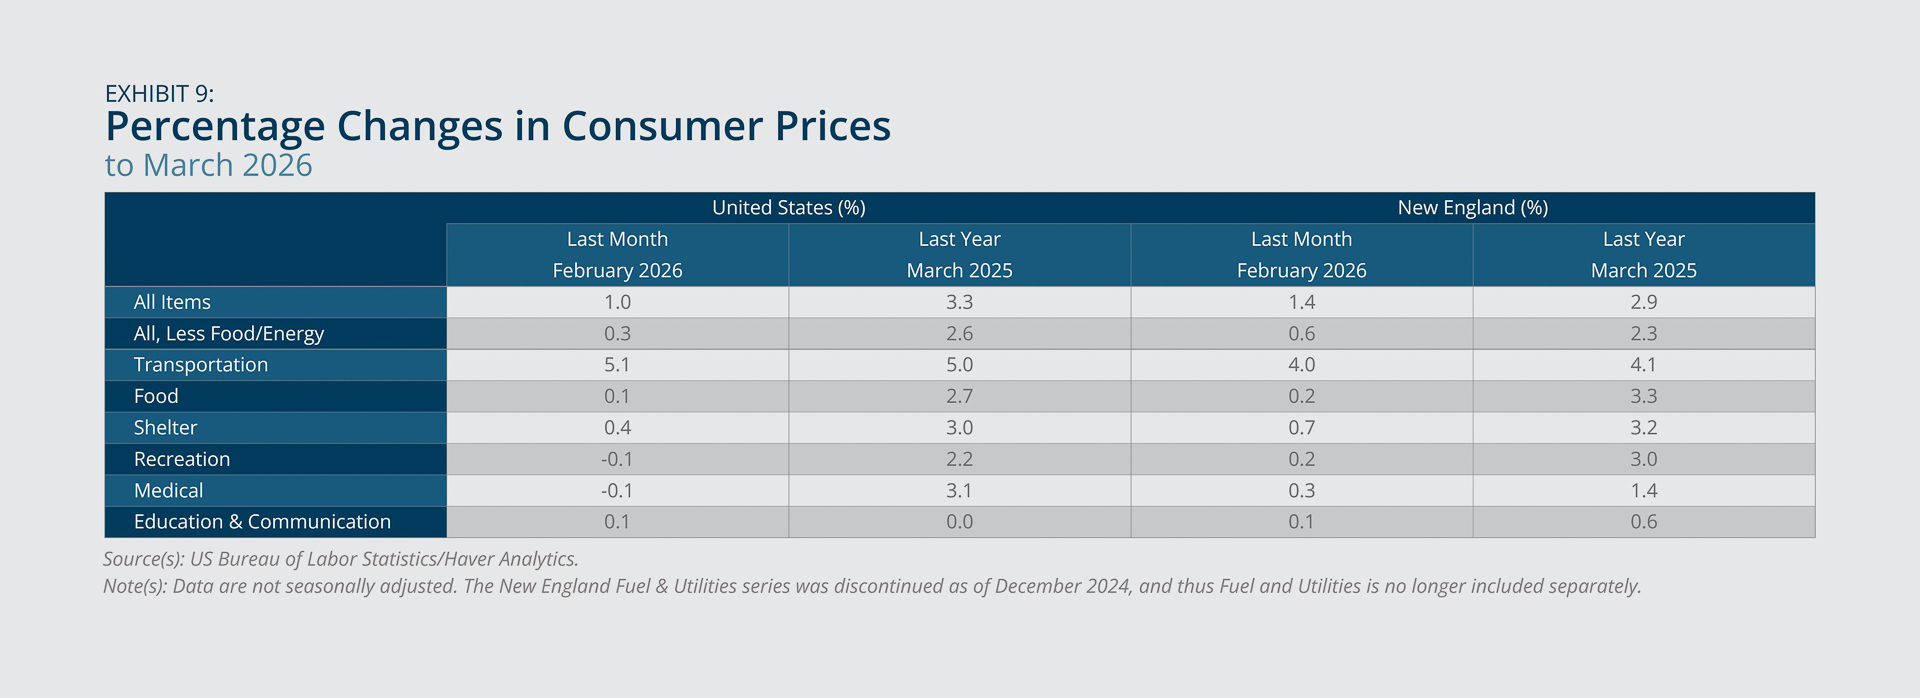
- However, the region experienced an above-average increase in core prices from February to March, suggesting a rise in inflationary pressures beyond just food and energy. See Exhibit 9.
All values refer to data that are not seasonally adjusted.7 Following two months of mild inflation rates (below 2 percent on a year-over-year basis) in New England, the consumer price index (CPI) rose 1.4 percent in March 2026 from the previous month and 2.9 percent from March 2025 (Exhibits 8 and 9). Also in March 2026, the US CPI rose 1 percent over the month and 3.3 percent over the year (same exhibits). According to the Bureau of Labor Statistics, “…a 21.2 percent increase in the index for gasoline…accounted for nearly three-quarters of the monthly all-items increase.”8 In Exhibit 9, the gasoline price increase shows up in the form of very large single-month increases in the transportation component, which includes but is not limited to gasoline.
For both New England and the United States, the rise in core prices (all items excluding food and energy) in March was milder than the rise in the all-items CPI, considering either the one-month change or the year-over-year change. Nonetheless, core prices increased at a comparatively rapid rate in March (from February) in New England versus in the United States overall, as the shelter, recreation, and medical components all rose faster in the region. These data may suggest an increase in inflationary pressures in New England beyond just food and energy, but because these are single-month changes that are not seasonally adjusted, it is too soon to discern a clear trend.
Federal Reserve Bank of Boston
Federal Reserve Bank of Boston
Construction
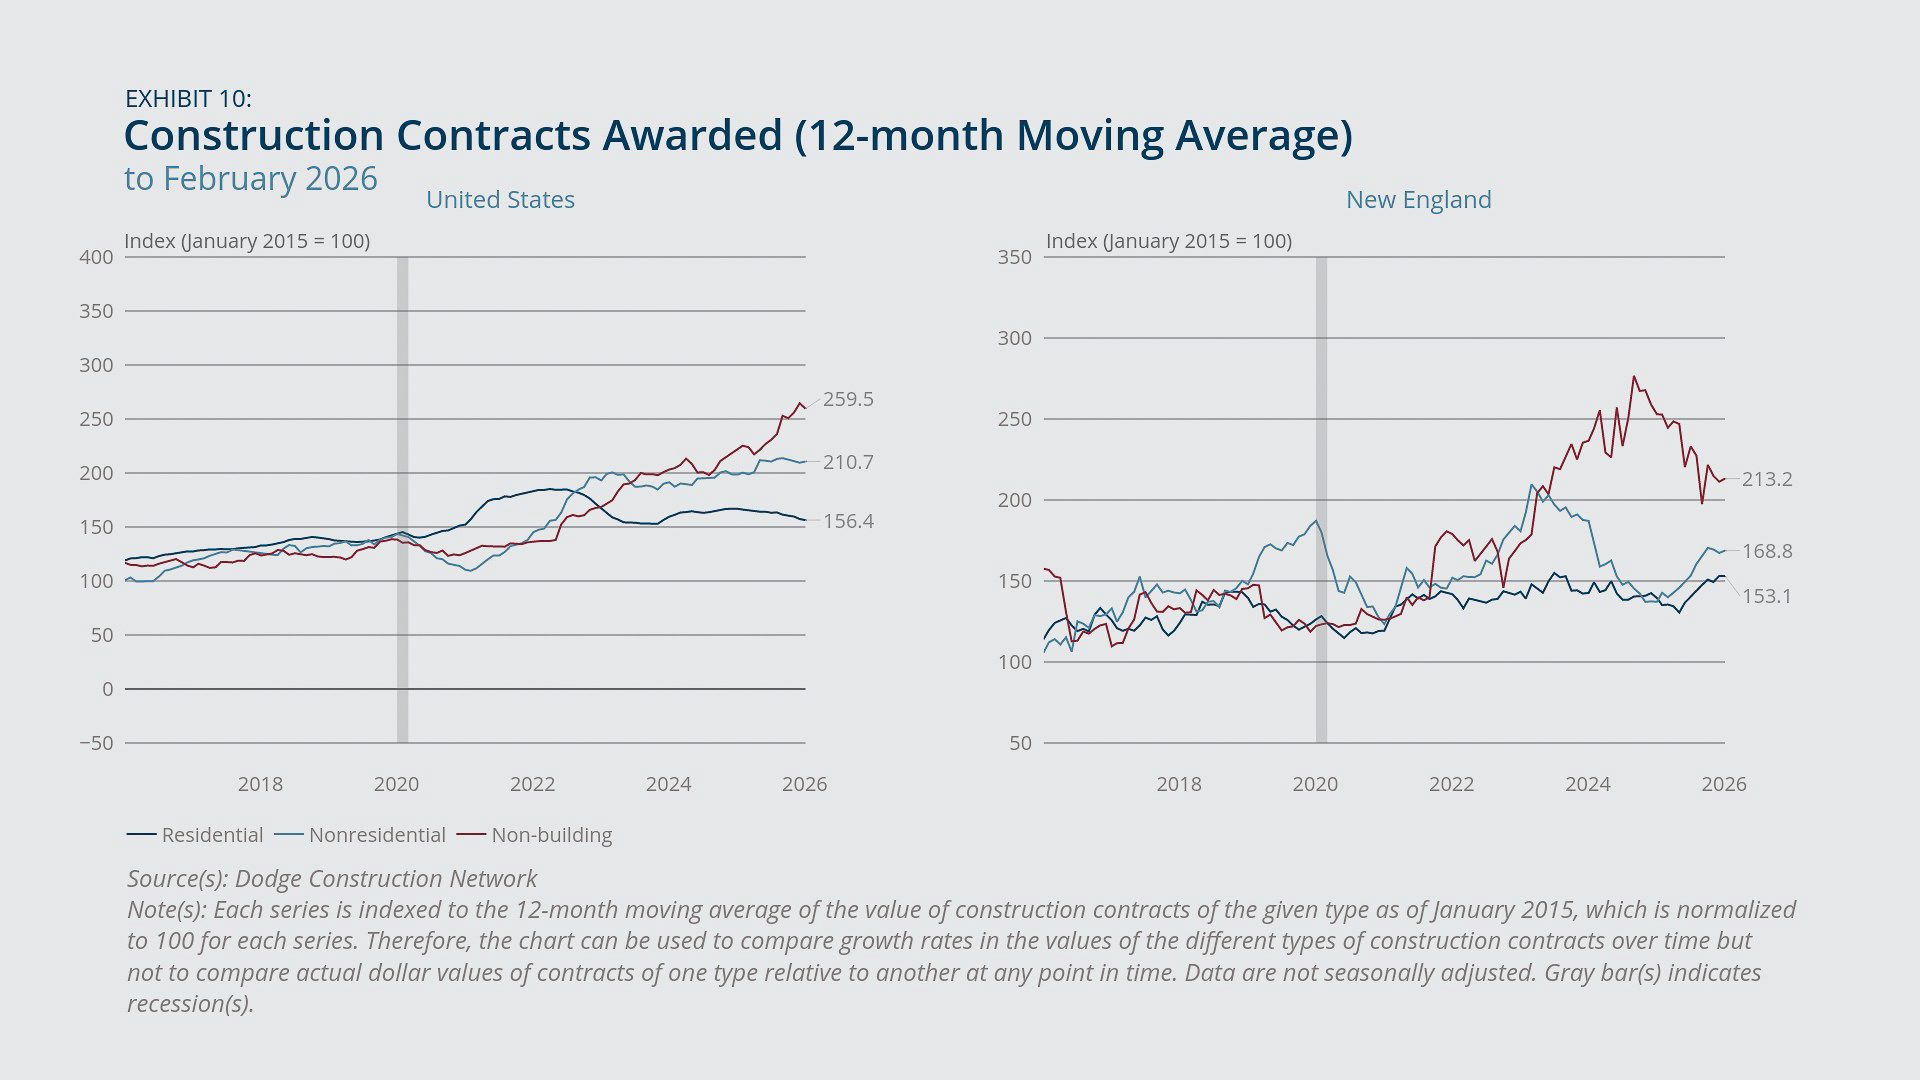
- Based on indexed values of construction contracts awarded through February 2026 (Exhibit 10), nonbuilding construction activity has seen much greater cumulative growth since 2015 compared with construction of either residential or nonresidential buildings, both regionally and nationally. However, since October 2024 nonbuilding construction has receded sharply in New England while continuing to rise rapidly in the United States.
- From February 2025 to February 2026, nonresidential construction activity (measured as the value of contracts) showed very strong growth in New England (about 23 percent) and solid growth in the United States (roughly 6 percent), while residential construction experienced 10 percent year-over-year growth in the region and a 6 percent decline nationally.
Recent trends in the value of nonbuilding construction contracts differ markedly between the United States and New England. Nationally, nonbuilding construction, which refers to infrastructure projects such as bridges, airports, highways, and utility systems, experienced robust year-over-year growth of roughly 17 percent in February 2026. See Exhibit 10. By contrast, New England saw a sharp decline (nearly 16 percent) in the value of nonbuilding construction contracts for the same period, continuing a decline in the region that began after the category peaked in October 2024. This divergence may be related to the region's disproportionate exposure to offshore wind projects, which dwarf conventional infrastructure spending.9 The offshore wind sector experienced a wave of cancellations and restructurings in 2025, potentially creating an investment vacuum in New England's nonbuilding pipeline that would not register at the national level.10
By contrast, nonresidential and residential building construction in the region have trended upward since February 2025 and June 2025, respectively, and each showed stronger year-over-year growth than the United States through February 2026. At the national level, it is estimated that construction of data centers accounted for 42 percent of the growth in nonresidential building construction in 2025.11 Although the New England region does not appear to be leading the nation in terms of data center construction,12 the April 2026 Beige Book report from the Federal Reserve Bank of Boston notes that “…activity in the [nonresidential construction] sector was largely limited to data centers and government projects.”13 Westfield, Massachusetts, announced a planned $4 billion data center in August 2025 that was incentivized by state tax breaks.14 However, that project has yet to break ground and would not have contributed to observed construction contracts in 2025. Furthermore, the project’s future is considered uncertain in light of the withdrawal of the project’s original developer and the emergence of political opposition from some interest groups.15
Federal Reserve Bank of Boston
Endnotes
- Except when indicated otherwise, all state payroll employment data in this report, including historical data, reflect the annual benchmark revisions to state-level data, released by the US Bureau of Labor Statistics (BLS) on April 8, 2026. US payroll employment data reflect the national benchmark revisions released on February 11, 2026.
- The most recent State Employment and Unemployment report from the BLS includes data through January 2026. National employment and unemployment data from the BLS are currently available through March 2026, but US outcomes are shown only through January 2026 to match regional data availability.
- See “2025 US federal deferred resignation program,” Wikipedia.com, https://en.wikipedia.org/wiki/2025_U.S._federal_deferred_resignation_program, accessed April 13, 2026.
- See Gad Levanon, “I Think Technology Is Already Displacing Workers,” Labor Matters, April 8, 2026. https://substack.com/home/post/p-193582660
- All household employment data in this report—at the state, regional, or national level—reflect recent revisions by the BLS that incorporate new population controls, among other changes.
- See Leila Bengali, Ingrid Chen, Addie New-Schmidt, and Nicolas Petrosky-Nadeau, “The Recent Slowdown in Labor Supply and Demand,” Federal Reserve Bank of San Franscisco Economic Letter 2026-02, January 12, 2026. https://www.frbsf.org/research-and-insights/publications/economic-letter/2026/01/recent-slowdown-in-labor-supply-and-demand/
- Seasonally adjusted CPI data are not available for New England. For the United States, the monthly price changes are uniformly slightly smaller after seasonal adjustment. See “Consumer Price Index News Release,” US Bureau of Labor Statistics, April 10, 2026. https://www.bls.gov/news.release/cpi.htm
- See “Consumer Price Index News Release,” US Bureau of Labor Statistics, April 10, 2026. https://www.bls.gov/news.release/cpi.htm
- Individual offshore wind farms such as Vineyard Wind ($4 billion), Revolution Wind ($5 billion), and New England Wind 1 and 2 ($8 billion) each exceed what the region's six states collectively spend on highway and bridge construction in a typical year. See, for example, “New England Is the Epicenter of U.S. Offshore Wind Energy, Taking the Lead in Shaping a New American Energy Industry,” https://us.orsted.com/starboard-wind, accessed April 13, 2026.
- See Kelsey Tamborrino and Benjamin Storrow, “Trump administration halts offshore wind projects from Virginia to New England, in major blow to clean power,” Politico.com, December 22, 2025. https://www.politico.com/news/2025/12/22/interior-pauses-construction-of-all-offshore-wind-projects-citing-national-security-concerns-00702593
- See Michael Guckes, “Seeing Nonresidential Building Growth and Data Centers Clearly,” ConstructConnect News, March 6, 2026. https://news.constructconnect.com/seeing-nonresidential-building-growth-and-data-centers-clearly
- See Michael Guckes, “February 2026 Data Center Report: After Record Growth, the Outlook for the Year Ahead,” ConstructConnect News, February 3, 2026. https://news.constructconnect.com/february-2026-data-center-report-after-record-growth-the-outlook-for-the-year-ahead
- See Beige Book—April 2026, Board of Governors of the Federal Reserve System, https://www.federalreserve.gov/monetarypolicy/beigebook202604-boston.htm
- See Carrie Healy, “Westfield Planning $4B Data Center with Help from State Tax breaks,” New England Public Media, August 26, 2025. https://www.nepm.org/regional-news/2025-08-26/westfield-planning-4m-data-center-with-help-from-state-tax-breaks
- See Jonathan Gerhardson, “AI Hallucination? Proposed Westfield Data Center Appears Abandoned by Developers,” The Shoestring, December 30, 2025. https://theshoestring.org/2025/12/30/ai-hallucination-proposed-westfield-data-center-appears-abandoned-by-developers/#:~:text=A%20representative%20for%20the%20Secretary,%2C%20local%2C%20and%20federal%20approvals

 About the Authors
Mary A. Burke,
Federal Reserve Bank of Boston
Mary A. Burke is a principal economist and policy advisor with the New England Public Policy Center in the Federal Reserve Bank of Boston Research Department.
Email: Mary.Burke@bos.frb.org
Annie Liu,
Federal Reserve Bank of Boston
Annie Liu is a senior research assistant with the New England Public Policy Center in the Federal Reserve Bank of Boston Research Department.
Acknowledgments
Kelly Jackson, a senior data analyst in the Federal Reserve Bank of Boston Research Department, prepared the exhibits for this memo.
Resources
Keywords
- Regional economy ,
- Economic Conditions ,
- New England