New England Economic Conditions through June 2, 2026 


Key Takeaways
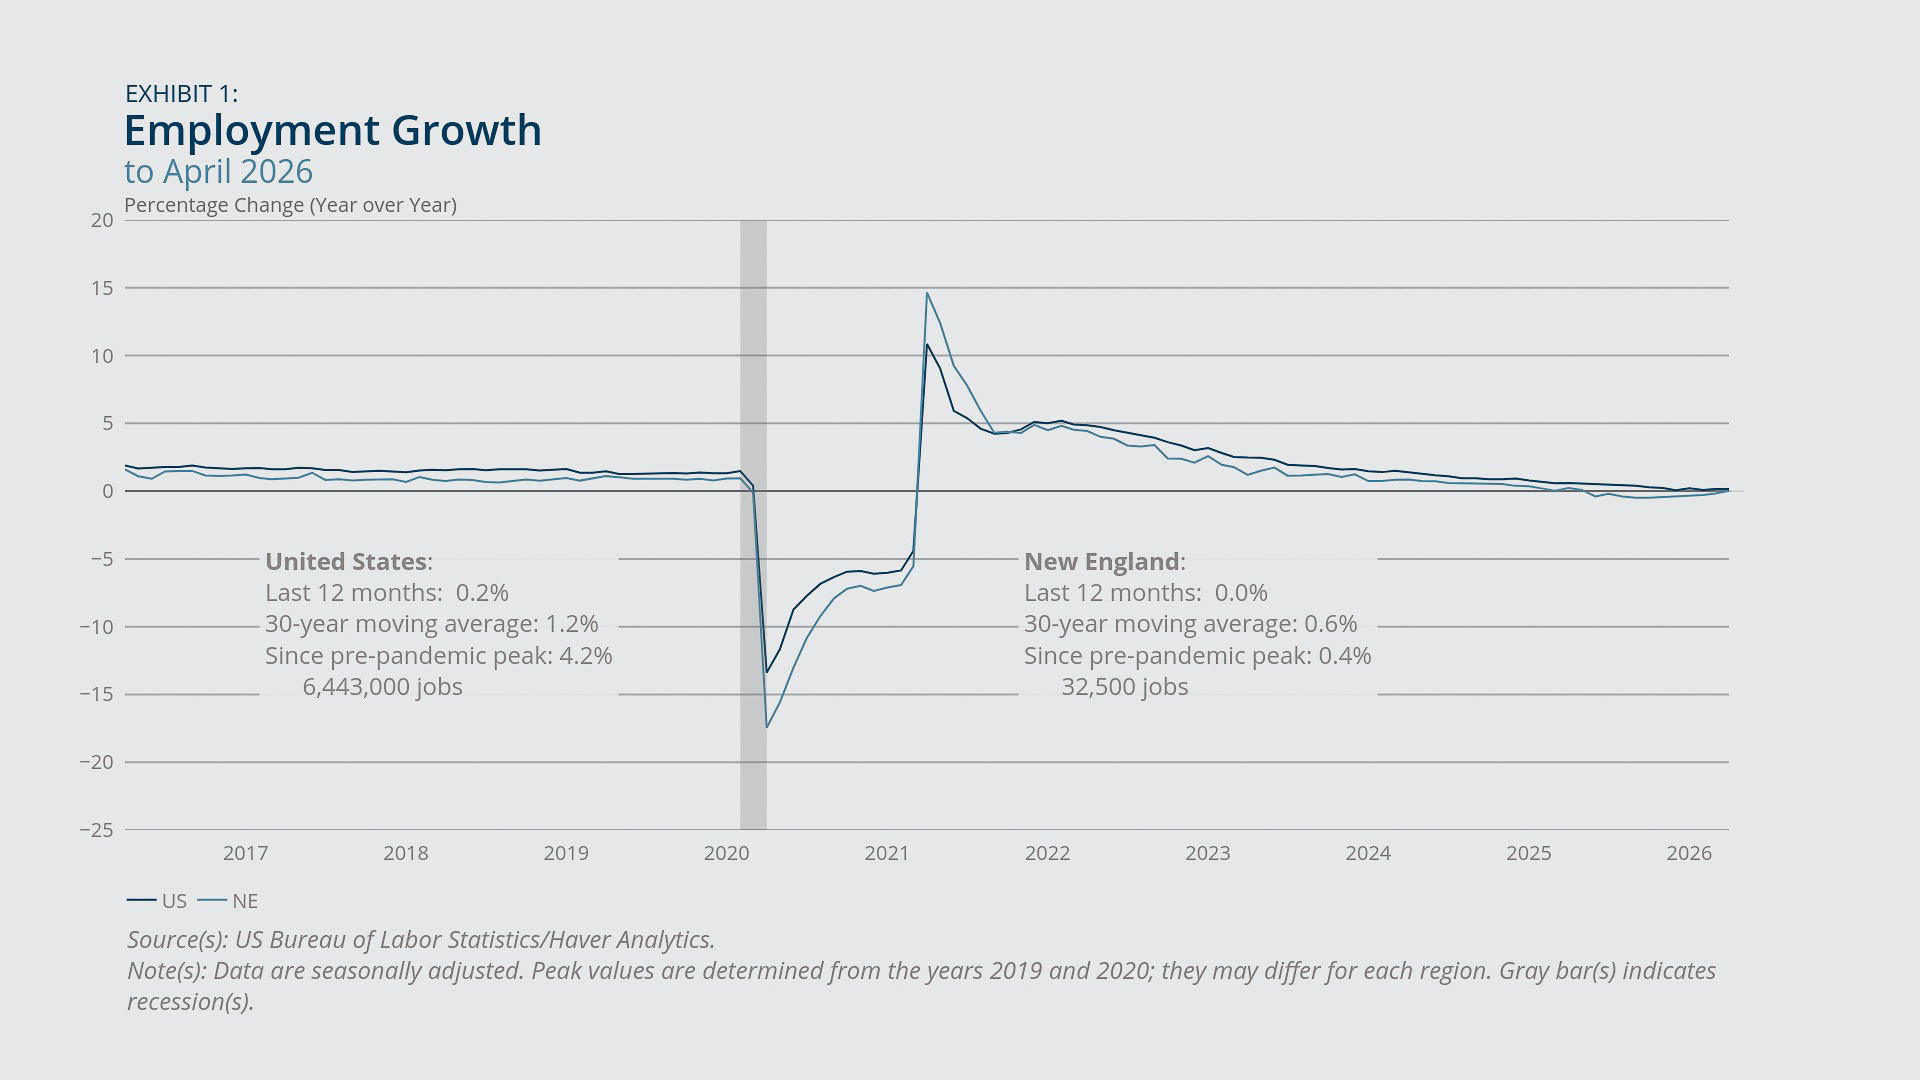
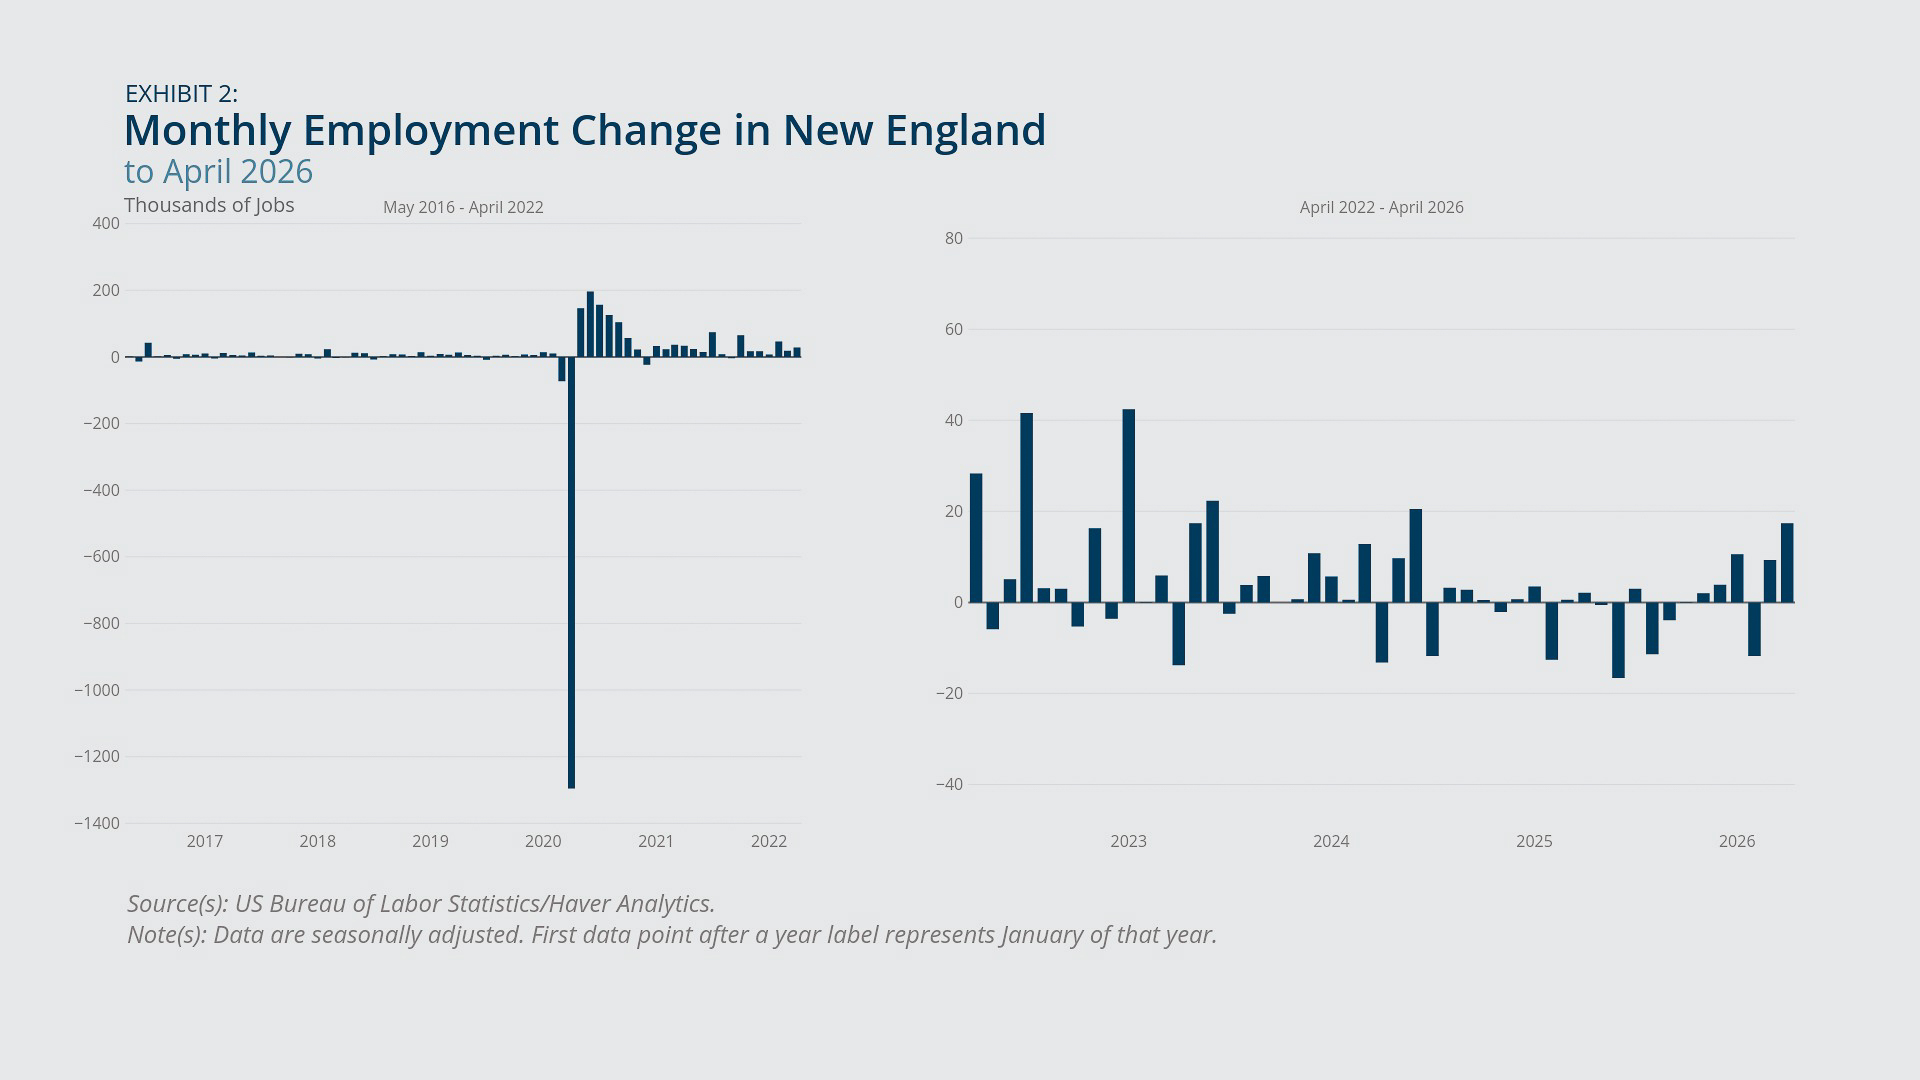
- New England added 17,400 jobs in April 2026 from the previous month but experienced zero net employment growth compared with the previous April. US payroll employment increased by 115,000 jobs in April compared with March and grew by 0.2 percent on a year-over-year basis.
- New England’s unemployment rate rose 0.4 percentage point in April 2026 from one year earlier, mostly because of a large unemployment rate increase in Connecticut. At 4.4 percent in April, the region’s unemployment rate nonetheless remained moderate and only slightly higher than the corresponding national rate of 4.3 percent.
- Private-industry wages and salaries in New England, adjusted for inflation, rose 0.5 percent in the fourth quarter of 2026 compared with four quarters prior, whereas the corresponding growth rate for the United States was just 0.1 percent. Furthermore, the value for New England represented an improvement from its year-earlier reading of –0.1 percent. .
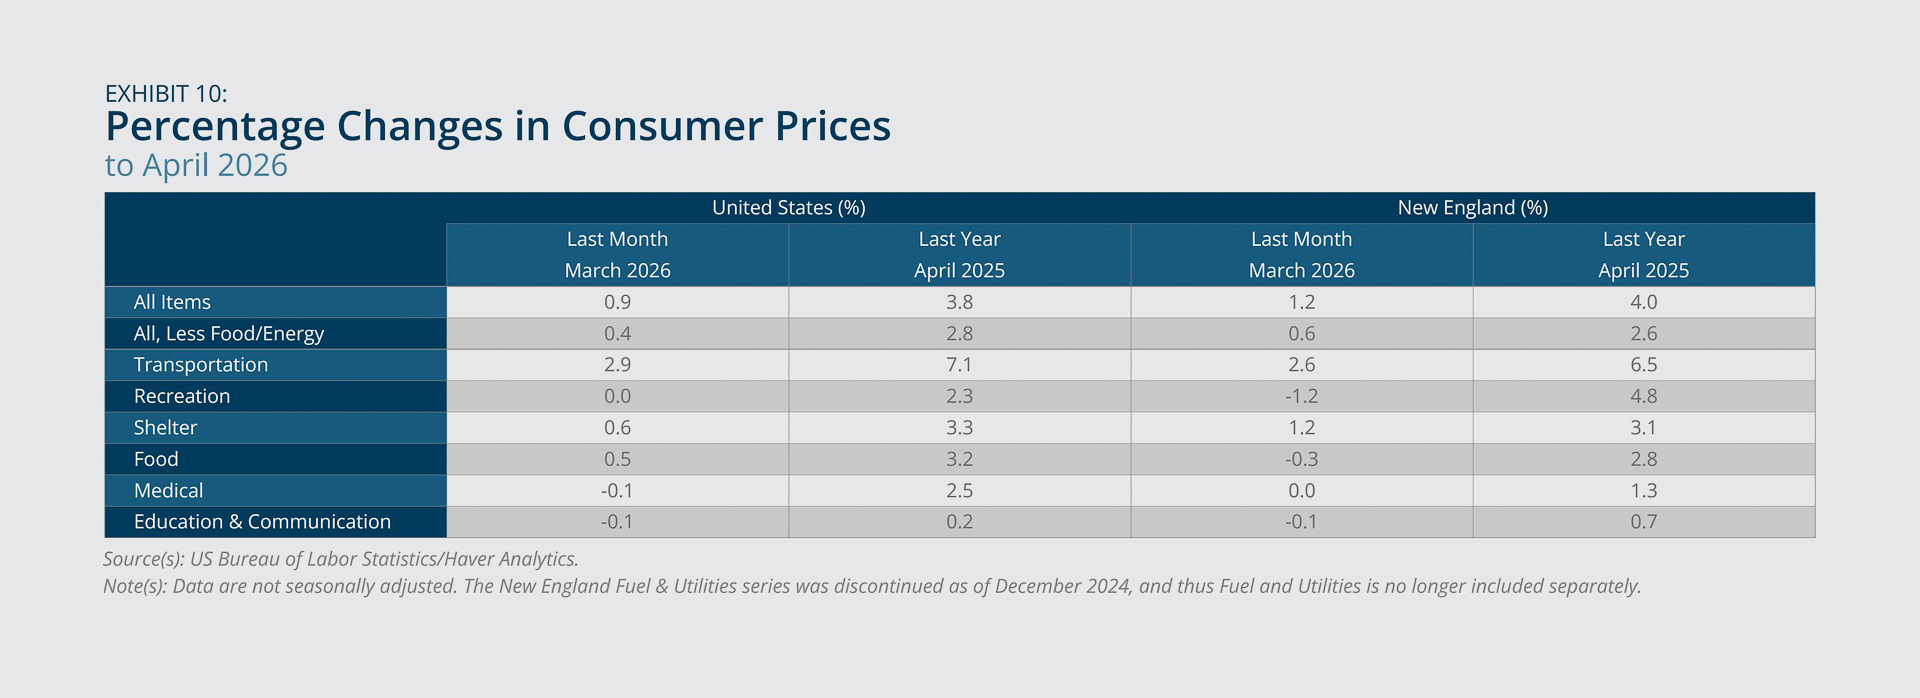
- Transportation prices rose further in April, both regionally and nationally, contributing to a 4 percent year-over-year inflation rate for New England and a 3.8 percent rate for the United States. Inflation rates excluding food and energy prices remained relatively moderate at 2.6 percent for the region and 2.8 percent for the nation on average.
- In New England and nationwide, the housing market softened further, as house-price growth continued to slow, and foreclosure rates reached their highest levels since 2019.
Sign up for new research and data on the New England economy.
Payroll Employment
- Payroll employment in New England was unchanged in April 2026 compared with April 2025. See Exhibit 1.
- US payroll employment increased a scant 0.2 percent in the 12 months ending with April 2026, supported by a gain of 115,000 jobs in April alone.
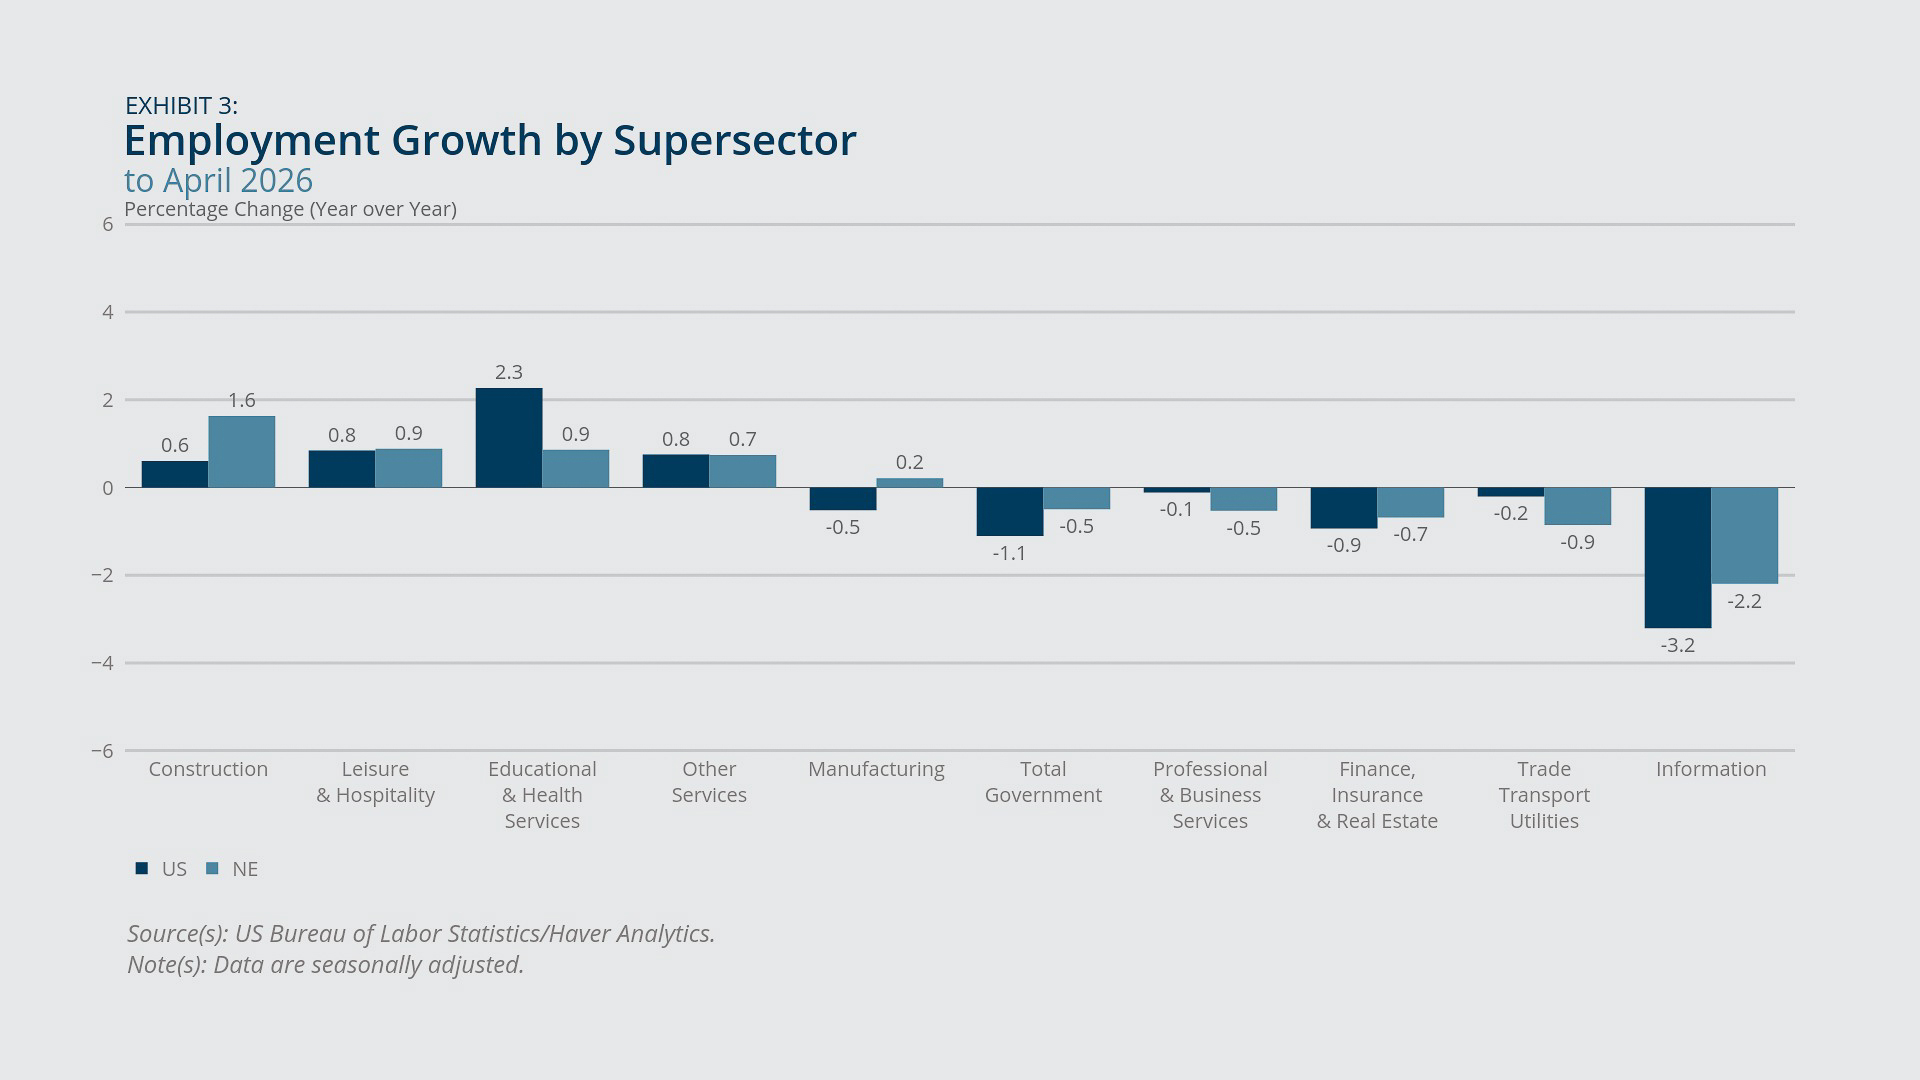
- Half of New England’s 10 supersectors experienced at least slight job growth (year-over-year) in April, and the other half saw modest to moderate job losses. See Exhibit 3.
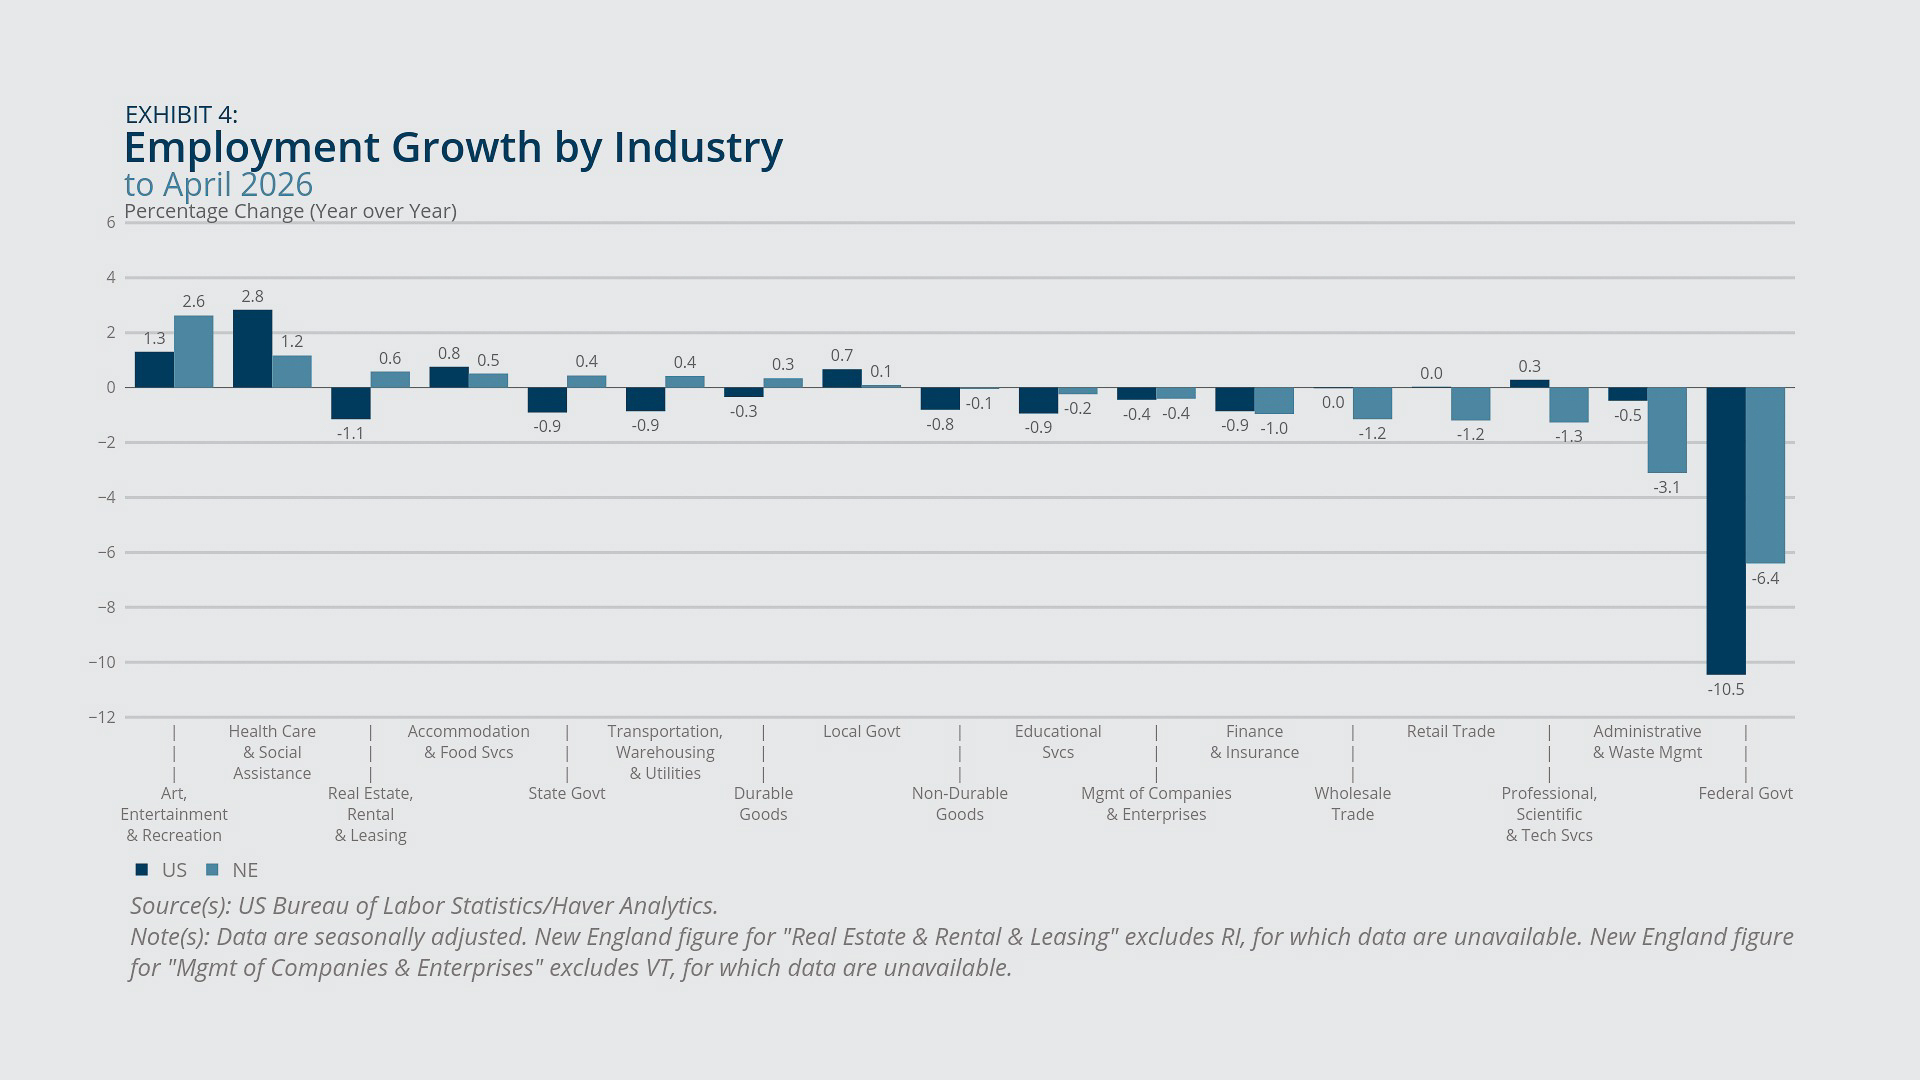
- New England’s health-care and social-assistance industry experienced modest year-over-year job growth that nonetheless fell short of the corresponding growth rate for the United States, extending a persistent pattern of recent years. See Exhibit 4.
New England’s zero employment growth rate for April 2026 (Exhibit 1) represents an improvement from the small negative growth rates of the preceding 10 months, and the region appears to have added more than 31,000 jobs on net in the six months ending with April 2026, including a monthly gain of 17,400 jobs in April alone (Exhibit 2). However, given the sampling errors, it is too soon to say with a high degree of confidence that the payroll employment situation in New England is improving.1 Based on anecdotal reports from employers around New England, the latest (May 2026) Beige Book report from the Boston Fed says, “Employment was mostly unchanged, as selective layoffs largely offset a pickup in hiring.”2
The flat picture for total employment in New England obscures considerable heterogeneity across supersectors (Exhibit 3). Five supersectors in the region showed positive employment growth rates in April 2026 from one year earlier, ranging from slight (manufacturing, up 0.2 percent) to moderate (construction, up 1.6 percent), while the other five experienced net job losses that ranged from modest (–0.5 percent each for government and professional and business services) to substantial (–2.2 percent for information). New England experienced stronger employment growth (or less pronounced job losses) than the United States in several supersectors, including construction, manufacturing, government, and information.
Among industries in New England, the art, entertainment, and recreation industry had the highest job growth rate (2.6 percent), and federal government had the lowest (–6.4 percent). See Exhibit 4. At the national level, the health-care and social-assistance industry led in terms of job growth (2.8 percent), and federal government fared the worst (–10.5 percent). Health-care and social-assistance employment rose in New England as well (1.2 percent) but lagged considerably relative to the United States.
New England has experienced relatively weak employment growth in the health-care and social-assistance industry throughout most of the post-pandemic recovery period, reflecting factors on both the demand side and the supply side. Providers in Rhode Island report facing intense financial pressures from rising costs, which, combined with Medicaid reimbursement rates that are among the lowest in the nation, are contributing to recent layoffs.3 According to a Massachusetts report on the state’s health-care workforce, labor shortages continue to hold back employment growth in the industry, even though hospital job vacancies in the state are down 28 percent from their post-pandemic (2022) peak.4 Separately, Massachusetts experienced layoffs in mental health services following reductions in federal funding to the state’s Medicaid program and the implementation of state-level austerity measures.5
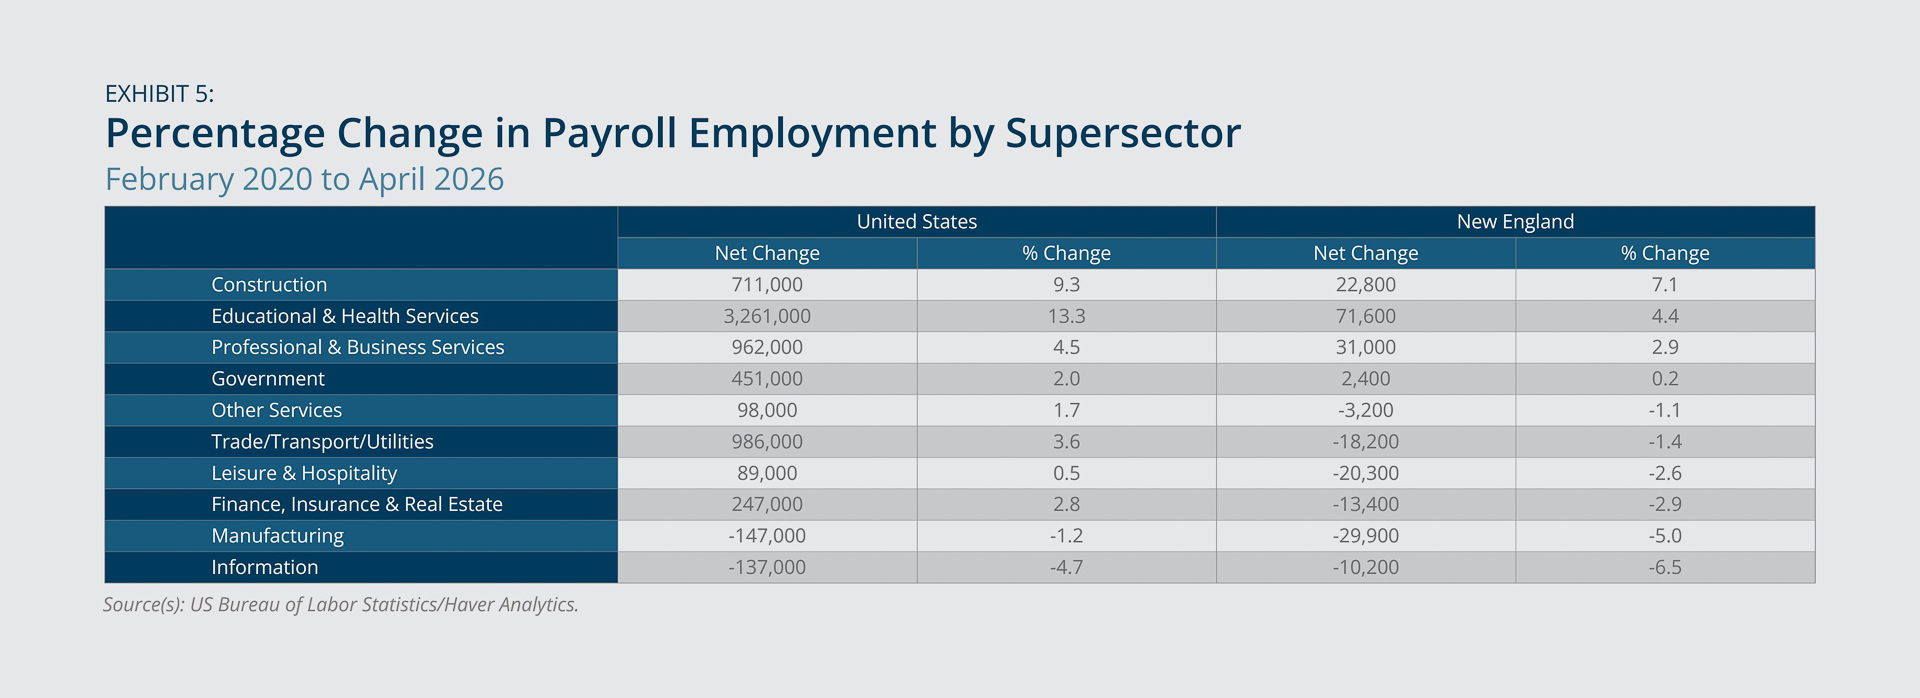
Exhibit 5 shows net employment growth since February 2020 (through April 2026) by supersector. For New England, construction leads on this measure, and educational and health services places second; nationwide, those positions are reversed, and the United States shows much greater net employment growth in the educational and health services sector compared with New England. Although not shown, most of that discrepancy owes to weak relative job growth in New England in the health-care and social-assistance industry since February 2020, with a smaller contribution from jobs in the educational services industry.
As of April 2026, all six New England states were showing considerable gains in construction employment relative to February 2020, with Maine, New Hampshire, and Rhode Island experiencing increases of 15 percent, 13 percent, and 10 percent, respectively. Construction employment in Massachusetts was on the decline from late 2023 through mid-2025 but has since surged, and as of April, it stood 3.4 percent above its February 2020 level. The recent rebound may reflect the Healey administration's target of building 222,000 new housing units by 2035 through initiatives such as the Affordable Homes Act, signed in August 2024. The aggressive policy push has reportedly translated into robust hiring, though state officials note this still falls short of what's needed to meet production goals for new housing.6

Federal Reserve Bank of Boston
Federal Reserve Bank of Boston
Federal Reserve Bank of Boston
Federal Reserve Bank of Boston
Federal Reserve Bank of Boston
Household Employment
- New England’s unemployment rate, at 4.4 percent in April 2026, remained moderate, despite rising 0.4 percentage point from its April 2025 level. See Exhibit 6.
- Connecticut registered the largest year-over-year rise in unemployment among all 50 states in April, with a statistically significant increase of 1.2 percentage points.
- Unemployment rates in other New England states (and in the United States overall) saw small and statistically insignificant year-over-year changes.
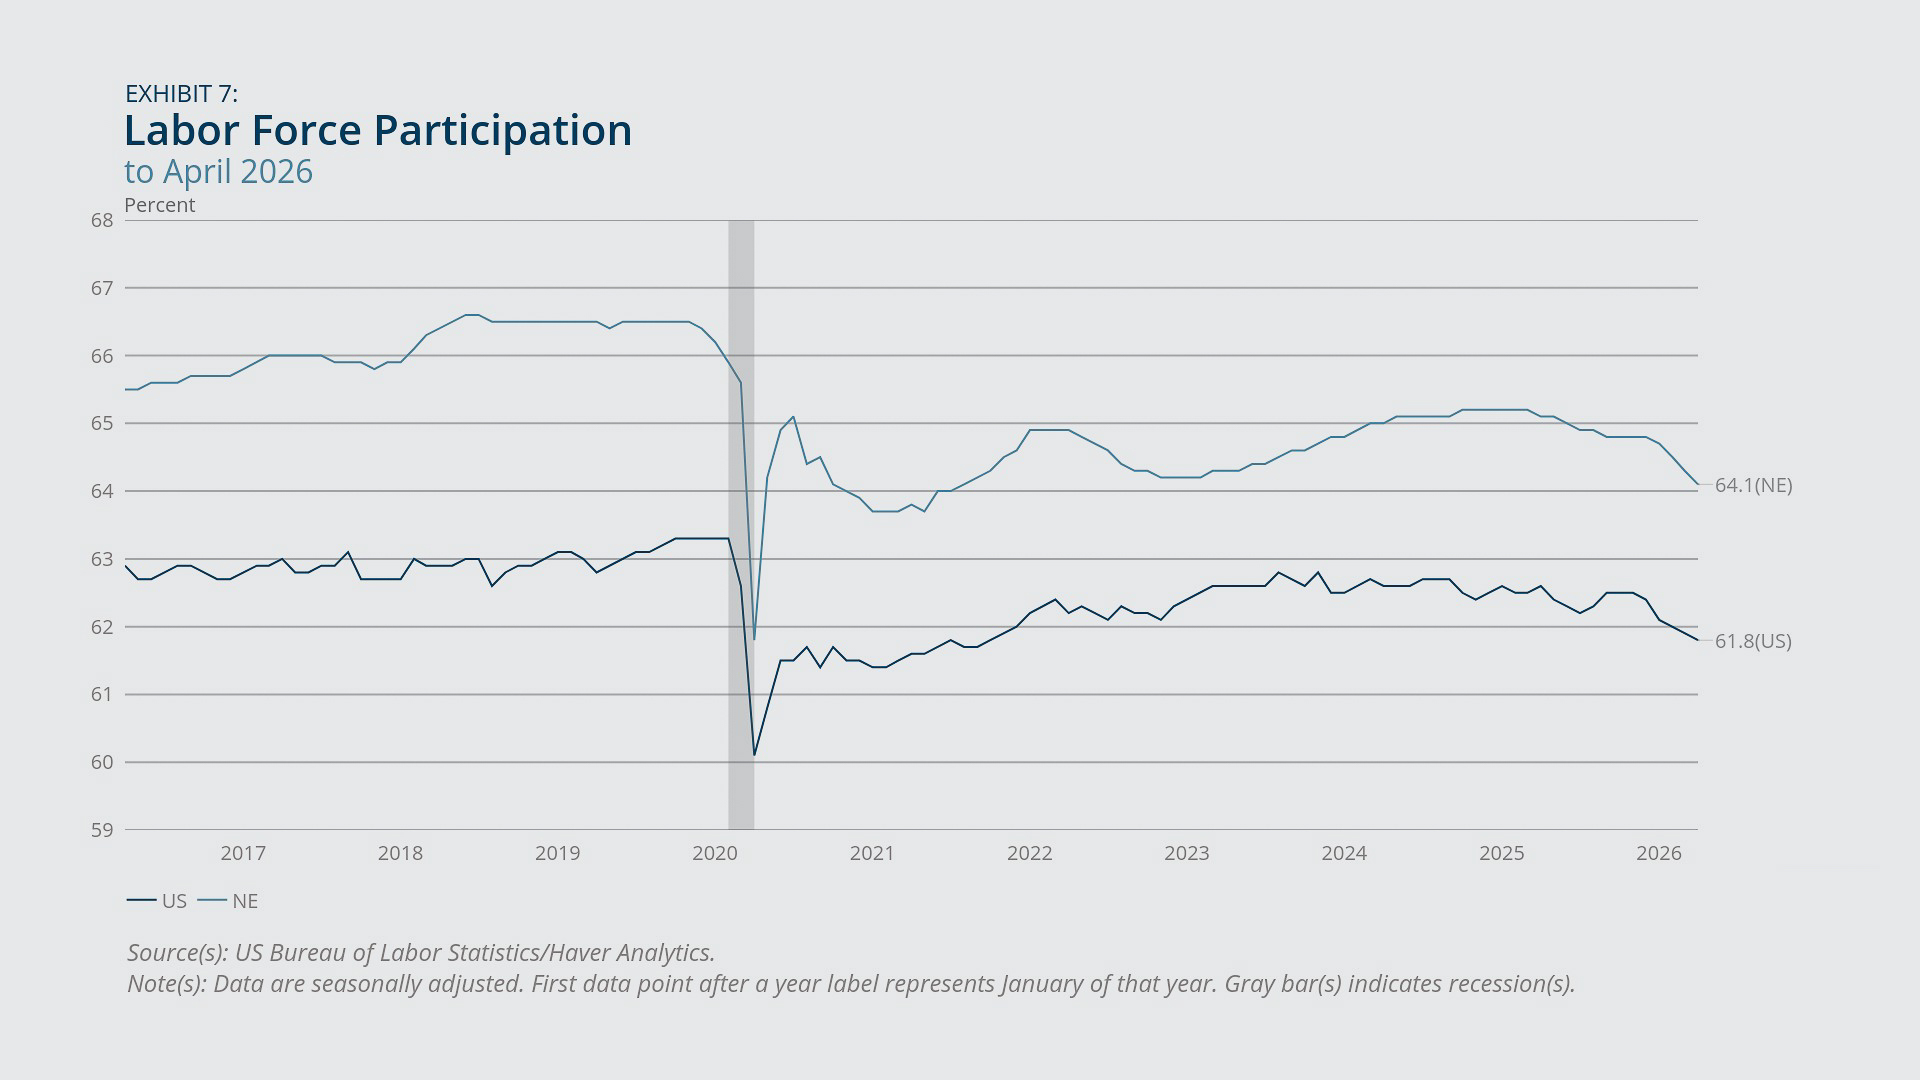
- New England’s labor force participation rate declined by a full percentage point in April from the previous year. The US participation rate in April showed a similar decline (–0.8 percentage point) from one year earlier. See Exhibit 7.
Connecticut’s unemployment rate for April 2026 stands out for being the highest in the region, at 5 percent, but still does not differ significantly (in the statistical sense) from the US rate of 4.3 percent for the same month.7 The latest unemployment rates in Massachusetts (4.7 percent) and Rhode Island (4.5 percent) also exceed the national rate, but not by statistically significant margins. By contrast, Maine, New Hampshire, and Vermont all had unemployment rates significantly lower than the US rate as of April, and rates in each of those states were little changed from April 2025.
Digging deeper into the household employment numbers for Connecticut reveals that from April 2025 to April 2026 the state experienced both a rise in the number of unemployed individuals and a decline in the absolute size of its labor force (the sum of employed and unemployed). Those facts suggest that (1) some formerly employed people became unemployed; (2) labor force exits were driven by retirement and/or outmigration of formerly employed individuals, more so than by the exit of discouraged, formerly unemployed workers; and/or (3) any workers entering the labor market for the first time were more likely to be unemployed compared with those who exited the labor market. An article in the Connecticut Mirror from January 2026 offers support for the first two factors,8 and the third point aligns with the recent national trend of rising unemployment rates among recent college graduates.
New England’s labor force participation rate declined by a relatively small margin (–0.3 percentage point) from April 2025 through December 2025, but since then (through April 2026), it has fallen an additional 0.7 percentage point (Exhibit 7). Similarly, the US participation rate declined 0.2 percentage point in the eight months ending in December 2025 and then declined a further 0.6 percentage point just since December. The latest readings are the lowest since August 2021 (New England) and October 2021 (US), respectively. Participation rates were down on a year-over-year basis in April in all New England states. Similar patterns hold for participation rates among prime-age (aged 25 to 54) individuals (not shown), suggesting population aging alone can’t explain the decline in overall participation.
Federal Reserve Bank of Boston
Federal Reserve Bank of Boston
Wages and Prices
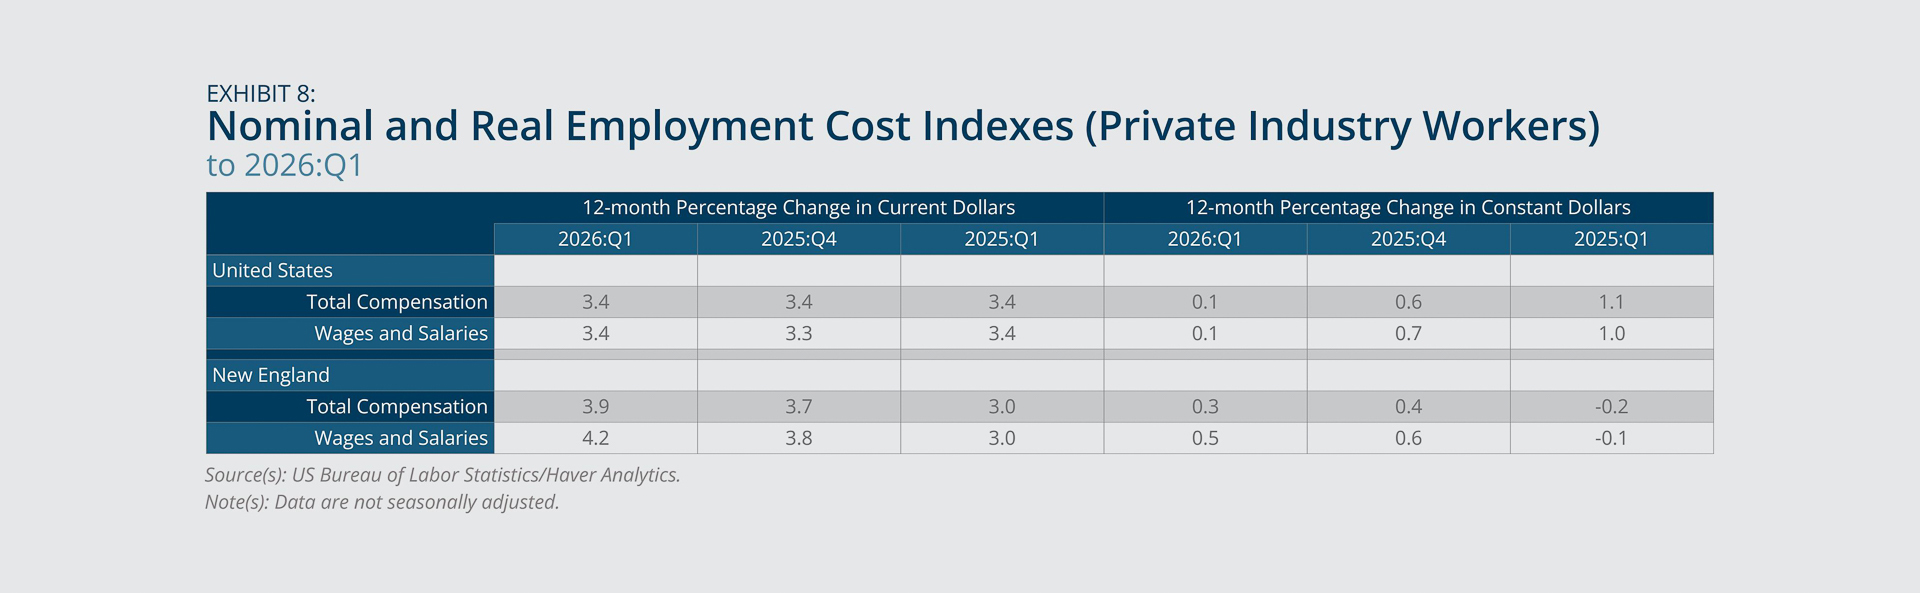
- Based on employment cost indexes of private industry workers, total compensation rose at an above-average rate in New England in the four quarters ending in the first quarter of 2026, considering either nominal (current dollar) or real (constant dollar) compensation. See Exhibit 8.
- Similarly, private industry wages and salaries in New England experienced four-quarter growth rates above the US average, whether in nominal or real terms.
- In New England, four-quarter growth rates in both nominal and real wages and salaries (and total compensation) increased from one year earlier, while growth rates were unchanged for the United States overall.
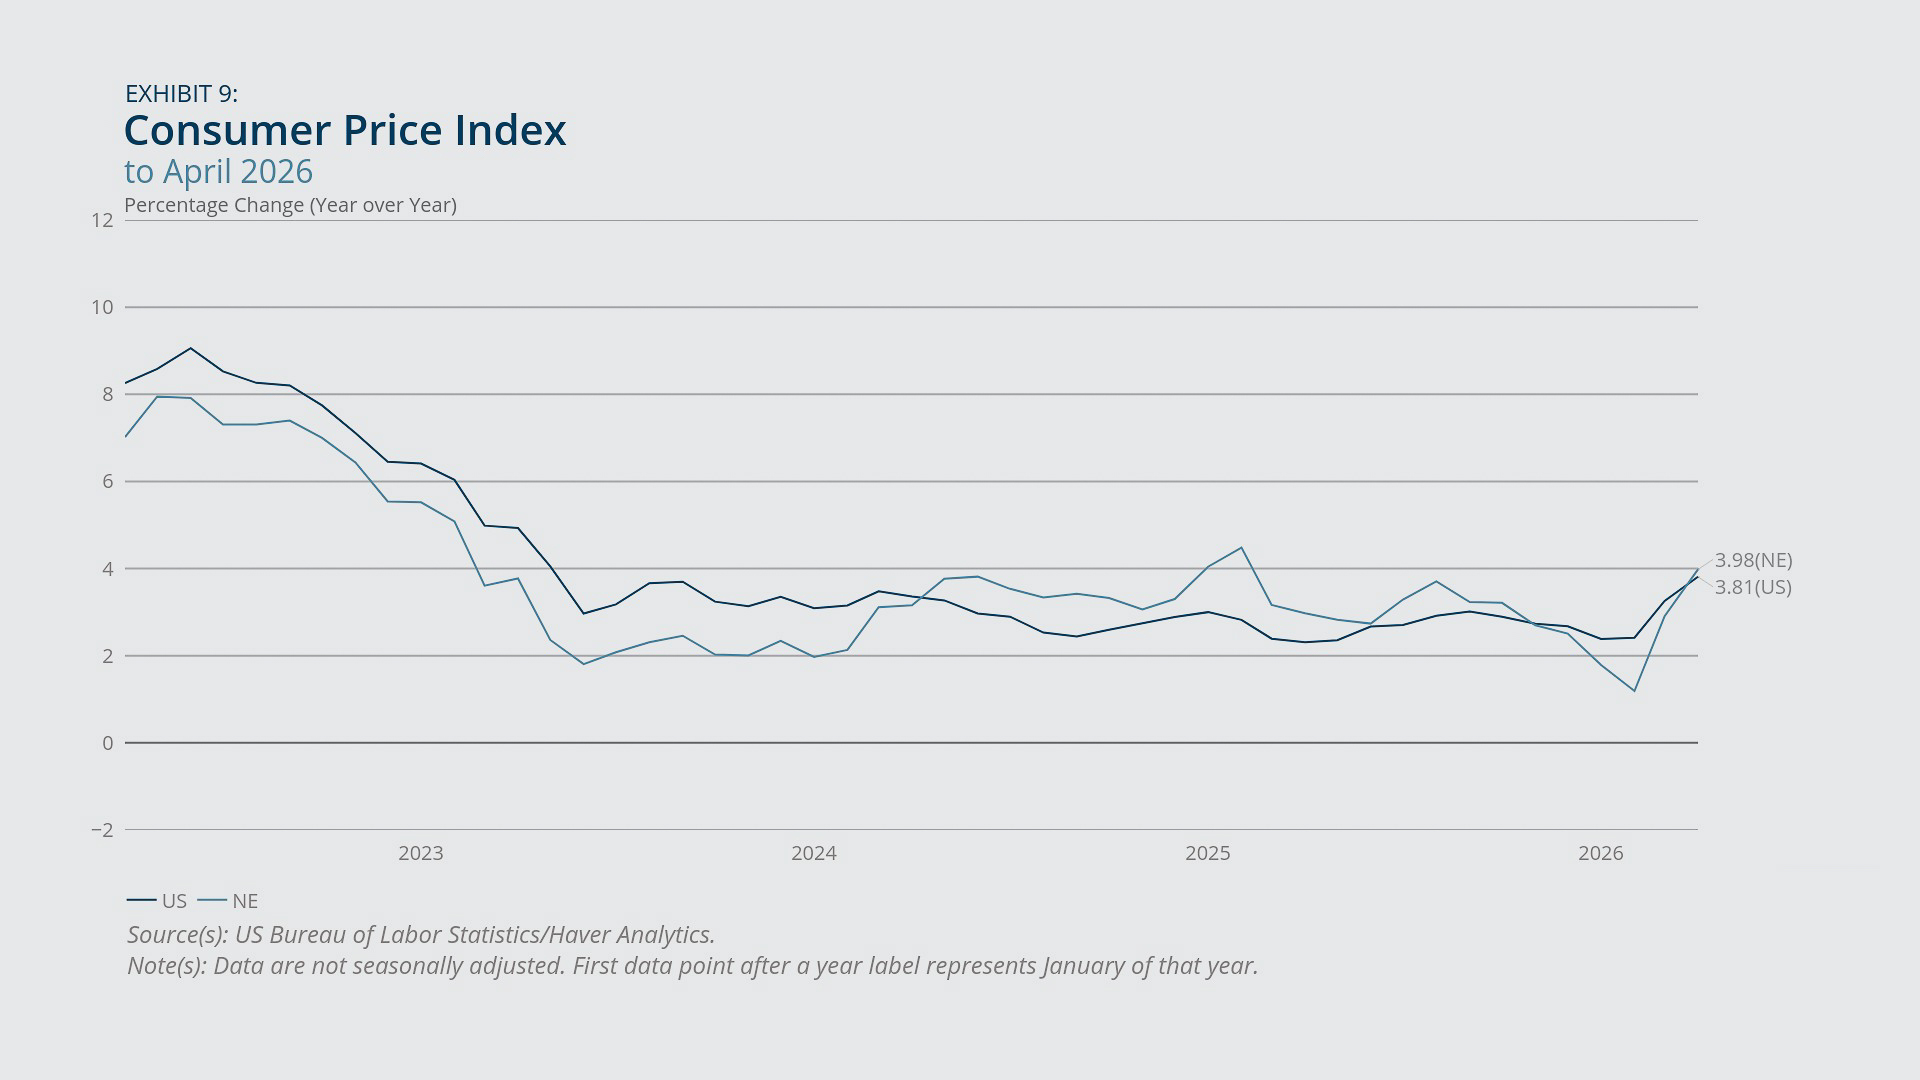
- The consumer price index surged again in April, both regionally and nationally, primarily owing to further increases in energy prices. See Exhibits 9 and 10.
In New England, growth in nominal wages and salaries (Exhibit 8) accelerated from a 3 percent year-over-year pace observed in the first quarter or 2025 to a 4.2 percent pace in the first quarter of 2026, whereas the corresponding numbers for the United States were stable at 3.4 percent across those two readings. Growth in real wages and salaries (and real total compensation) also improved in the region in 2026:Q1, compared with 2025:Q1, despite moderating slightly compared with 2025:Q4. By contrast, the United States experienced a slowdown in real wage and salary growth (and real total compensation growth) in 2026:Q1 compared with 2025:Q1.
Consumer price inflation in New England, measured as the year-over-year growth rate in the all-items consumer price index (CPI) for the region, reached nearly 4 percent in April, the highest value since February 2025 and more than a full percentage point over the previous month’s rate of 2.9 percent (Exhibit 9). US consumer price inflation also rose further in April, to 3.8 percent, the highest US reading since May 2023. Core inflation rates (which exclude food and energy) stayed more moderate than overall inflation, both regionally and nationally, as the rise in overall inflation has been driven mostly by rapid increases in energy prices linked to the conflict in the Middle East (Exhibit 10). For the region, April’s core inflation rate of 2.6 percent (year-over-year) was unchanged from the previous month, suggesting price pressures excluding food and energy were relatively stable, if still elevated. The outsized impact of energy prices shows up (both nationally and in the region) in the large year-over-year increase in the transportation component of the CPI, even though April’s one-month increase in that component (either regionally or nationally) was more moderate than the extreme transportation price increase seen in March. For the second straight month, New England experienced above-average inflation (on a year-over-year basis) in the recreation component and below-average inflation in medical-care costs.
Federal Reserve Bank of Boston
Federal Reserve Bank of Boston
Federal Reserve Bank of Boston
Housing Market Indicators
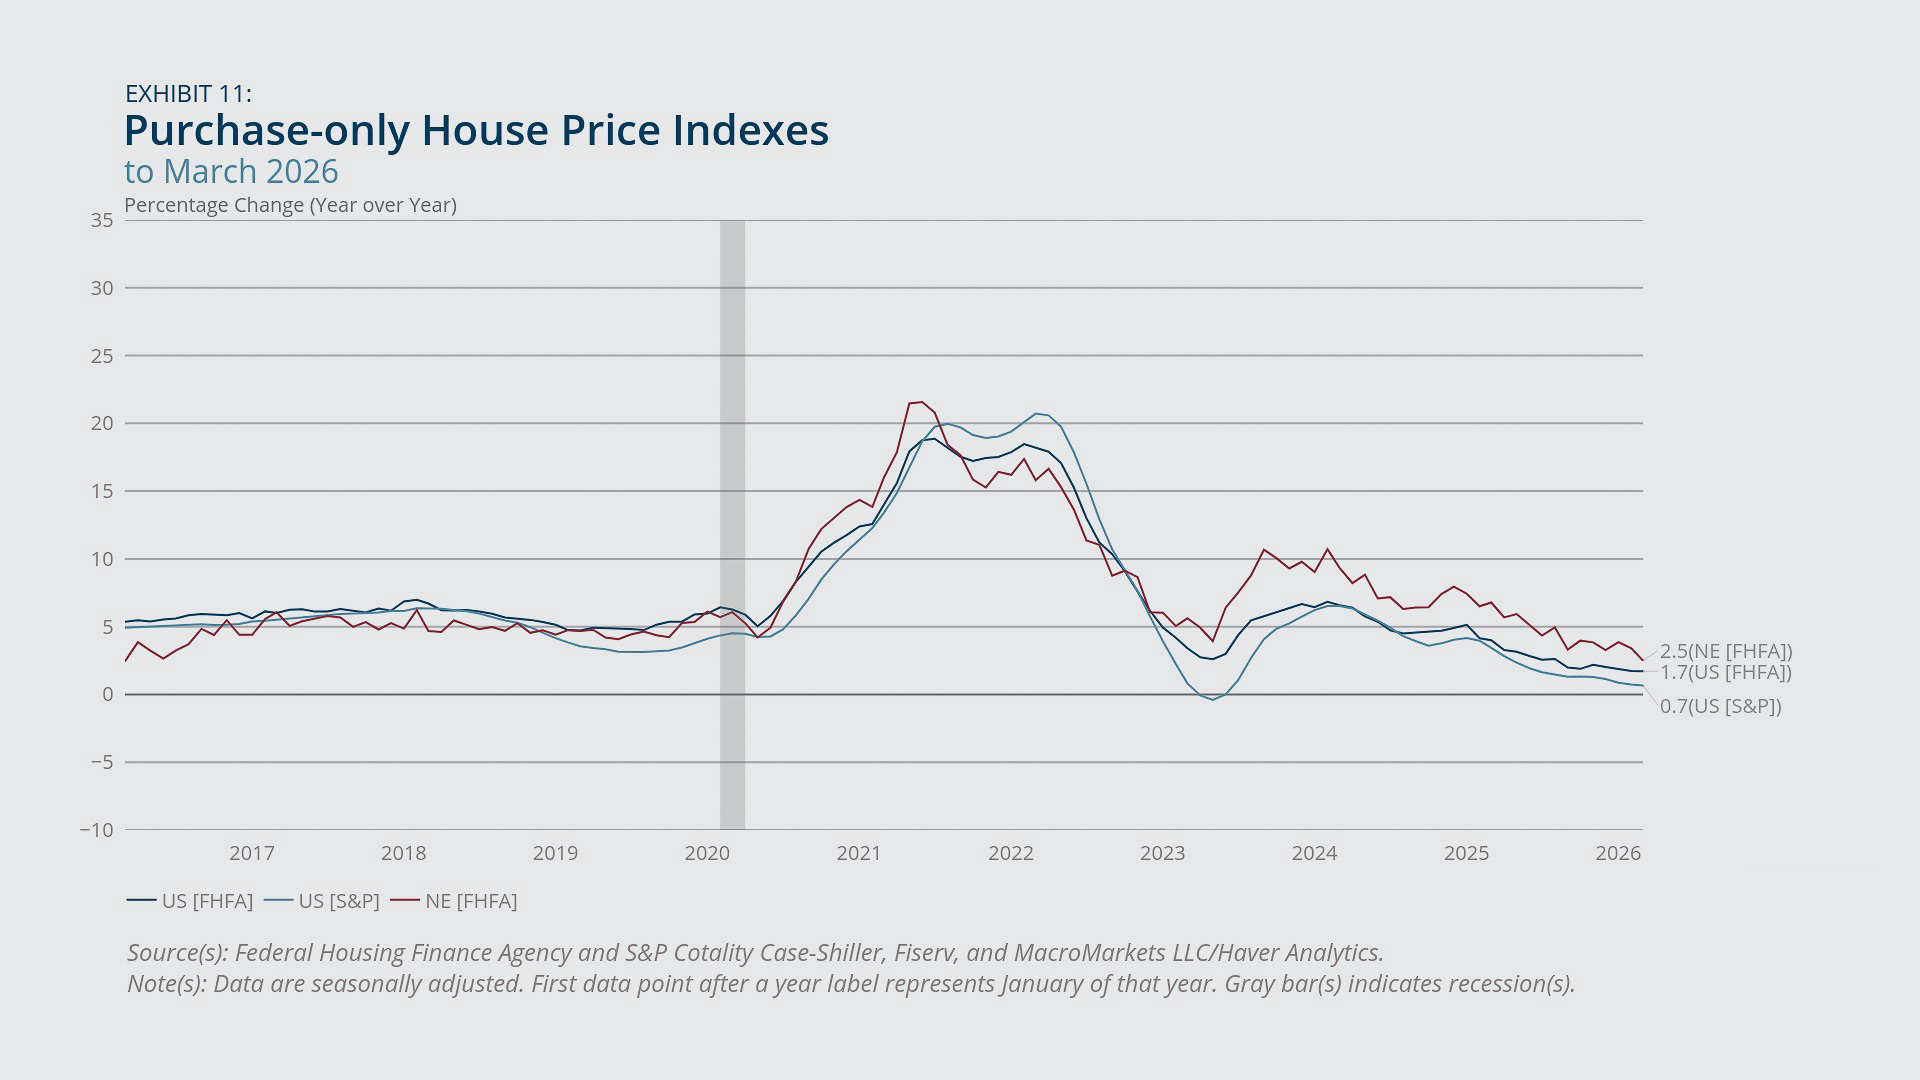
- House-price growth moderated further in New England and nationwide, with New England’s year-over-year growth rate falling to its lowest level since March 2016. See Exhibit 11.
- House-price growth in New England stayed above the US average, even though both series have exhibited downward trends since early 2024.
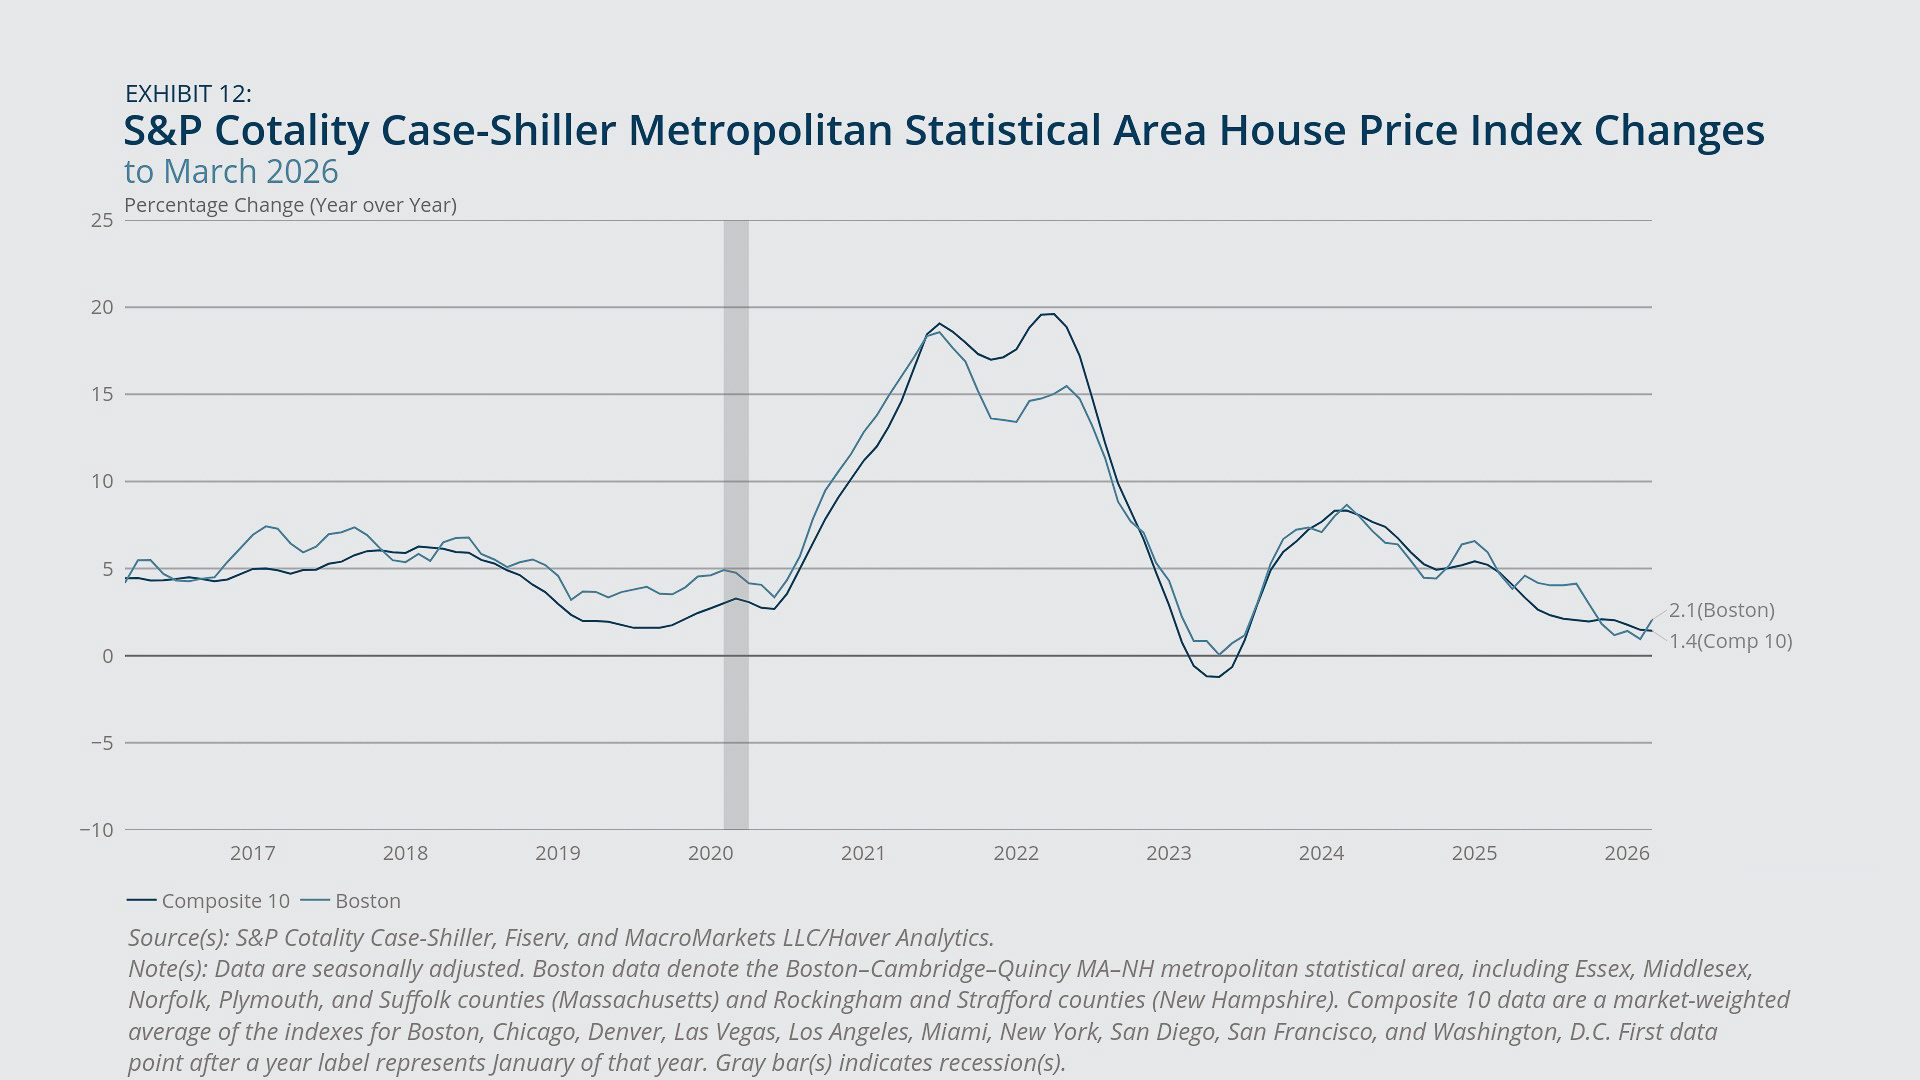
- House-price growth in Boston in March (from a year earlier) exceeded the average growth rate of the Composite 10 cities (which include Boston), although both Boston and the Composite 10 have experienced significant moderation in house-price growth since early 2024. See Exhibit 12.
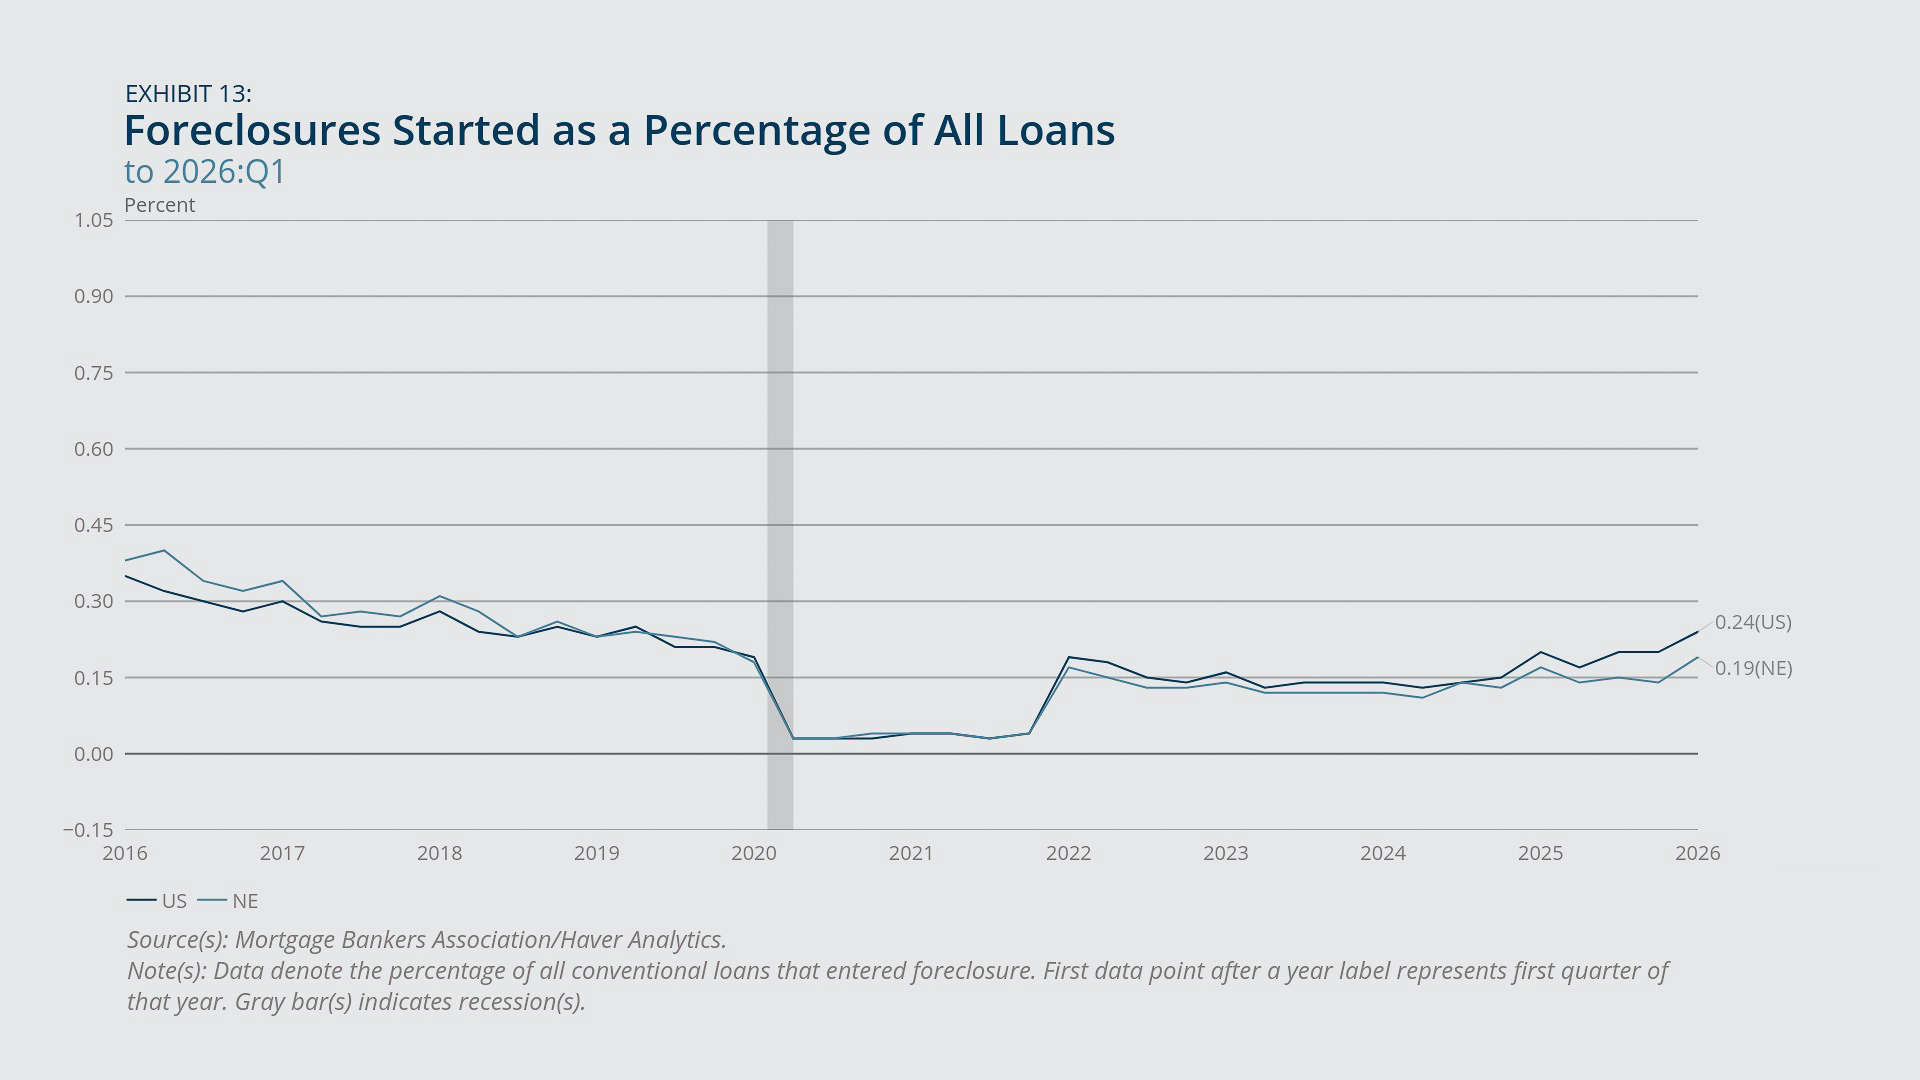
- Foreclosure initiations rose in the first quarter of 2026 in both New England and the United States, reaching their highest levels since late 2019, but remained low in historical terms. See Exhibit 13.
In New England and nationwide, housing market indicators continued to soften. In the region, house prices were up just 2.5 percent in March 2026 from a year earlier, slower than the previous month’s pace and well below the post-pandemic peak pace of over 10 percent, observed in September 2023 (Exhibit 11). US house-price growth, based on either the Federal Housing Finance Agency (FHFA) purchase-only index or the S&P Cotality Case-Shiller index, has also followed a downward trend since early 2024, and the latest FHFA-based growth rate (1.7 percent) is the lowest since March 2012. Based on the S&P Cotality Case-Shiller index, US house-price growth has lagged the overall inflation rate for the past 10 months (ending in March), suggesting US average home values have been declining in real terms.9 As of March 2026 at least, house-price growth in New England also appears negative in real terms.
Considering house-price growth in metropolitan areas, Boston has tracked the Composite 10 cities index quite closely since at least 2016, and both series have shown moderation in house-price growth since early 2024 (Exhibit 12). As of March 2026, Boston posted year-over-year growth of 2.1 percent, above the 1.4 percent average rate for the cities in the Composite 10 index (which includes Boston). The Composite 10 average obscures considerable variation, as 4 of the 10 cities experienced modest negative house-price growth—Denver had the weakest showing in the top 10, at –1.95 percent—and Chicago had robust growth (6.1 percent) for the same period.10
The latest foreclosure initiation rate for the nation, at 0.24 percent of loans, was the highest since April 2019, and the rate for the region, at 0.19 percent, was the highest since October 2019 (Exhibit 13). According to the Wall Street Journal11 and one New England real estate agent,12 the increase in foreclosures reflects a combination of factors, including the unwinding of various pandemic-era policies promoting leniency for distressed loans, as well as intensifying financial pressure on homeowners from property taxes, insurance, homeowner fees, and resumed student loan payments. Nonetheless, both the regional and national rates remained low by historical standards, and New England’s foreclosure rate stayed below the national average for the sixth straight quarter.
Federal Reserve Bank of Boston
Federal Reserve Bank of Boston
Federal Reserve Bank of Boston
Consumer Confidence
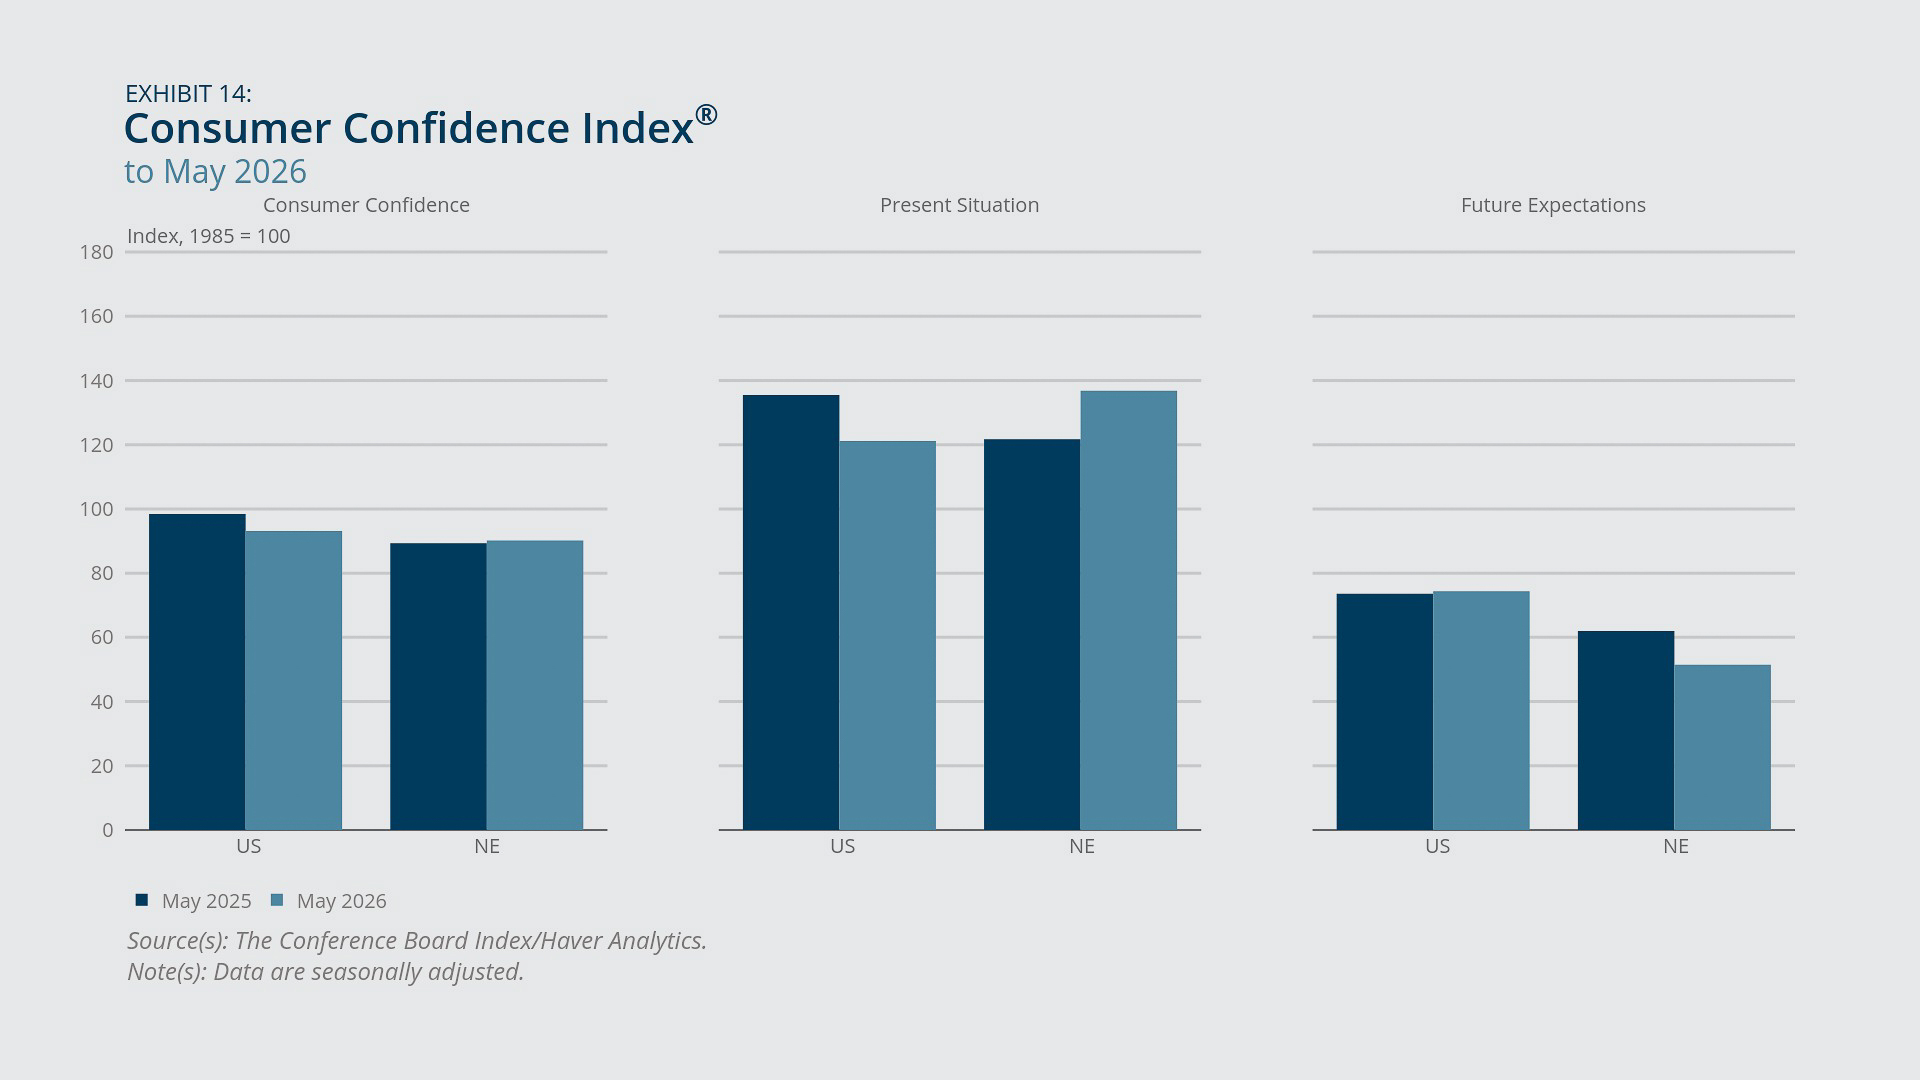
- According to the Conference Board, consumer confidence was stable in New England in May 2026 compared with one year earlier, and down only slightly in the United States. See Exhibit 14.
- In New England, consumer confidence in the present situation improved in May from a year prior, while future expectations weakened. By contrast, nationally, consumer confidence in the present situation deteriorated from one year earlier, and future expectations were stable.
- The latest confidence readings from the Conference Board, for either New England or the United States, remained well above their historical lows, whereas the University of Michigan’s Consumer Sentiment Index reached an all-time low in May.
In May 2026, consumer confidence in New England, based on the Conference Board’s Consumer Confidence Index (CCI), was similar to its level from a year prior, while the corresponding measure of confidence for the nation declined (Exhibit 14). The stable confidence reading for the region may reflect volatility in the measure, as the series’ 12-month moving average in May reached its lowest point since the pandemic period. The two distinct components of consumer confidence showed divergent trends between New England and the nation. Nationally, the decline in overall confidence was driven by diminished assessments of the present situation, while future expectations remained relatively stable. In New England, confidence in the present situation improved as it recovered from a slight dip in February and March, but the future outlook worsened.
It is worth noting that while the Conference Board's CCI declined for the United States in May, it remained well above historical lows. This contrasts sharply with the University of Michigan’s Consumer Sentiment Index (MCSI), which recently hit an all-time low of 44.2. That very low reading for the MCSI likely reflects the fact that the survey underlying the index focuses on household finances and inflation, making it sensitive to large swings in gas prices, whereas the survey underlying the CCI emphasizes labor market conditions.13 The surveys also differ in terms of sample sizes and in how they are administered—online for the CCI and by telephone for the MCSI—underscoring the importance of considering multiple indicators when assessing consumer sentiment.14
Federal Reserve Bank of Boston
Endnotes
- For example, no individual New England state experienced statistically significant changes in payroll employment in April, considering either the change from the preceding month or from the preceding year, and the same statement applies to most of the past 12 months. See “State Employment and Unemployment (Monthly) News Release,” US Bureau of Labor Statistics, May 22, 2026, https://www.bls.gov/news.release/laus.htm.
- See Beige Book—May 2026, Board of Governors of the Federal Reserve System, https://www.federalreserve.gov/monetarypolicy/beigebook202605-boston.htm.
- See “Care New England Announces Workforce Reductions amid Escalating Healthcare Funding Crisis in Rhode Island,” Care New England press release, May 2026, https://www.carenewengland.org/news/care-new-england-announces-workforce-reductions-amid-escalating-healthcare-funding-crisis-in-rhode-island.
- See “On the Mend: Progress and Pain Points for Massachusetts’ Healthcare Workforce," Massachusetts Health and Hospital Association, November 2025, https://www.mhalink.org/wp-content/uploads/2025/11/On-the-Mend-MHA-Workforce-Report-11.2025.pdf.
- See Beth Treffeisen, “Three Mass. Human Service Groups Cut 200 Jobs amid Funding Reductions," Boston.com, May 5, 2026, https://www.boston.com/news/local-news/2026/05/05/three-mass-human-service-groups-cut-200-jobs-amid-funding-reductions/.
- See “Labor Availability and Industry Capacity,” Massachusetts Statewide Housing Needs Assessment, https://www.mass.gov/info-details/labor-availability-and-industry-capacity.
- See State Employment and Unemployment (Monthly) News Release, US Bureau of Labor Statistics, May 22, 2026, https://www.bls.gov/news.release/laus.htm.
- See P.R. Lockhart, “CT Unemployment at 4.2% as 2025 Report Shows Muddled Economic Picture.” Connecticut Mirror, January 26, 2026, https://ctmirror.org/2026/01/26/ct-unemployment-jobs-report-december-2025/.
- See “S&P Cotality Case-Shiller Index Reports Annual Gain in March 2026,” S&P Global Index Announcements, May 26, 2026, https://www.spglobal.com/spdji/en/index-announcements/article/sp-cotality-case-shiller-index-reports-annual-gain-in-march-2026/.
- See “S&P Cotality Case-Shiller Index Reports Annual Gain in March 2026,” S&P Global Index Announcements, May 26, 2026, https://www.spglobal.com/spdji/en/index-announcements/article/sp-cotality-case-shiller-index-reports-annual-gain-in-march-2026/.
- See Nicole Friedman and Veronica Dagher, “High Housing Costs Are Pushing Foreclosures to a Six-Year High,” Wall Street Journal, May 1, 2026, https://www.wsj.com/economy/housing/high-housing-costs-are-pushing-foreclosures-to-a-six-year-high-266c56c0.
- See Chris Doherty, “Why Massachusetts and New Hampshire Foreclosures Are on the Rise in 2025,” Doherty Properties website, https://chrisdoherty.com/why-massachusetts-and-new-hampshire-foreclosures-are-on-the-rise-in-2025.html.
- See Joanne Hsu, “May 2026 Survey Results,” University of Michigan Surveys of Consumers, May 2026, https://data.sca.isr.umich.edu/fetchdoc.php?docid=81238.
- Before May 2021, the CCI was a mail-based survey. See The Conference Board, “Consumer Confidence Survey Technical Note—May 2021,” https://www.conference-board.org/pdf_free/press/TCB_CCS_TechNote_May2021.pdf.

 About the Authors
Mary A. Burke,
Federal Reserve Bank of Boston
Mary A. Burke is a principal economist and policy advisor with the New England Public Policy Center in the Federal Reserve Bank of Boston Research Department.
Email: Mary.Burke@bos.frb.org
Annie Liu,
Federal Reserve Bank of Boston
Annie Liu is a senior research assistant with the New England Public Policy Center in the Federal Reserve Bank of Boston Research Department.
Acknowledgments
Kelly Jackson, a senior data analyst in the Federal Reserve Bank of Boston Research Department, prepared the exhibits for this memo.
Resources
Keywords
- Regional economy ,
- Economic Conditions ,
- New England