New England Economic Conditions through September 1, 2026 


Key Takeaways
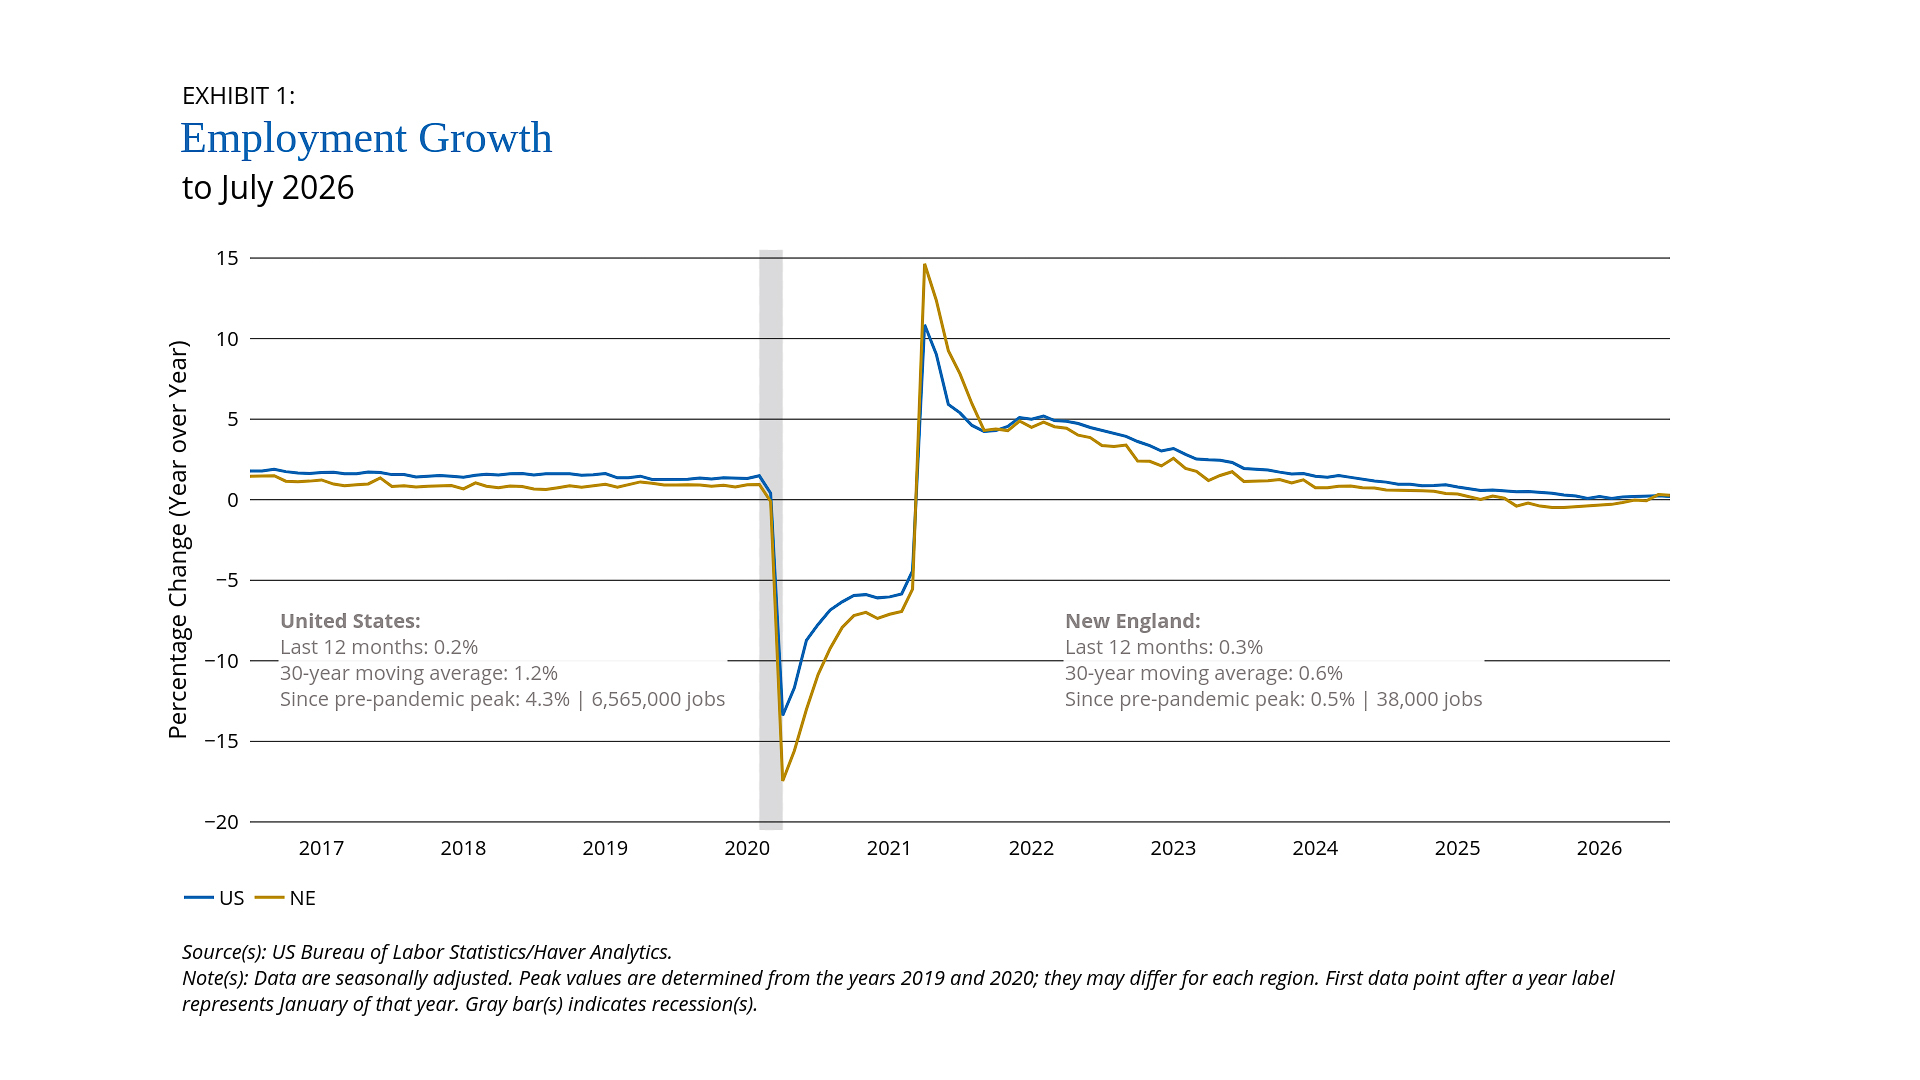
- Labor market conditions in New England have closely tracked those in the rest of the United States in recent months and can be summarized as stable, with slow job growth and low unemployment. New England payroll employment grew 0.3 percent in July 2026 over the preceding year, slightly higher than the national average growth of 0.2 percent. Unemployment in New England was unchanged over the preceding month at 4.2 percent.
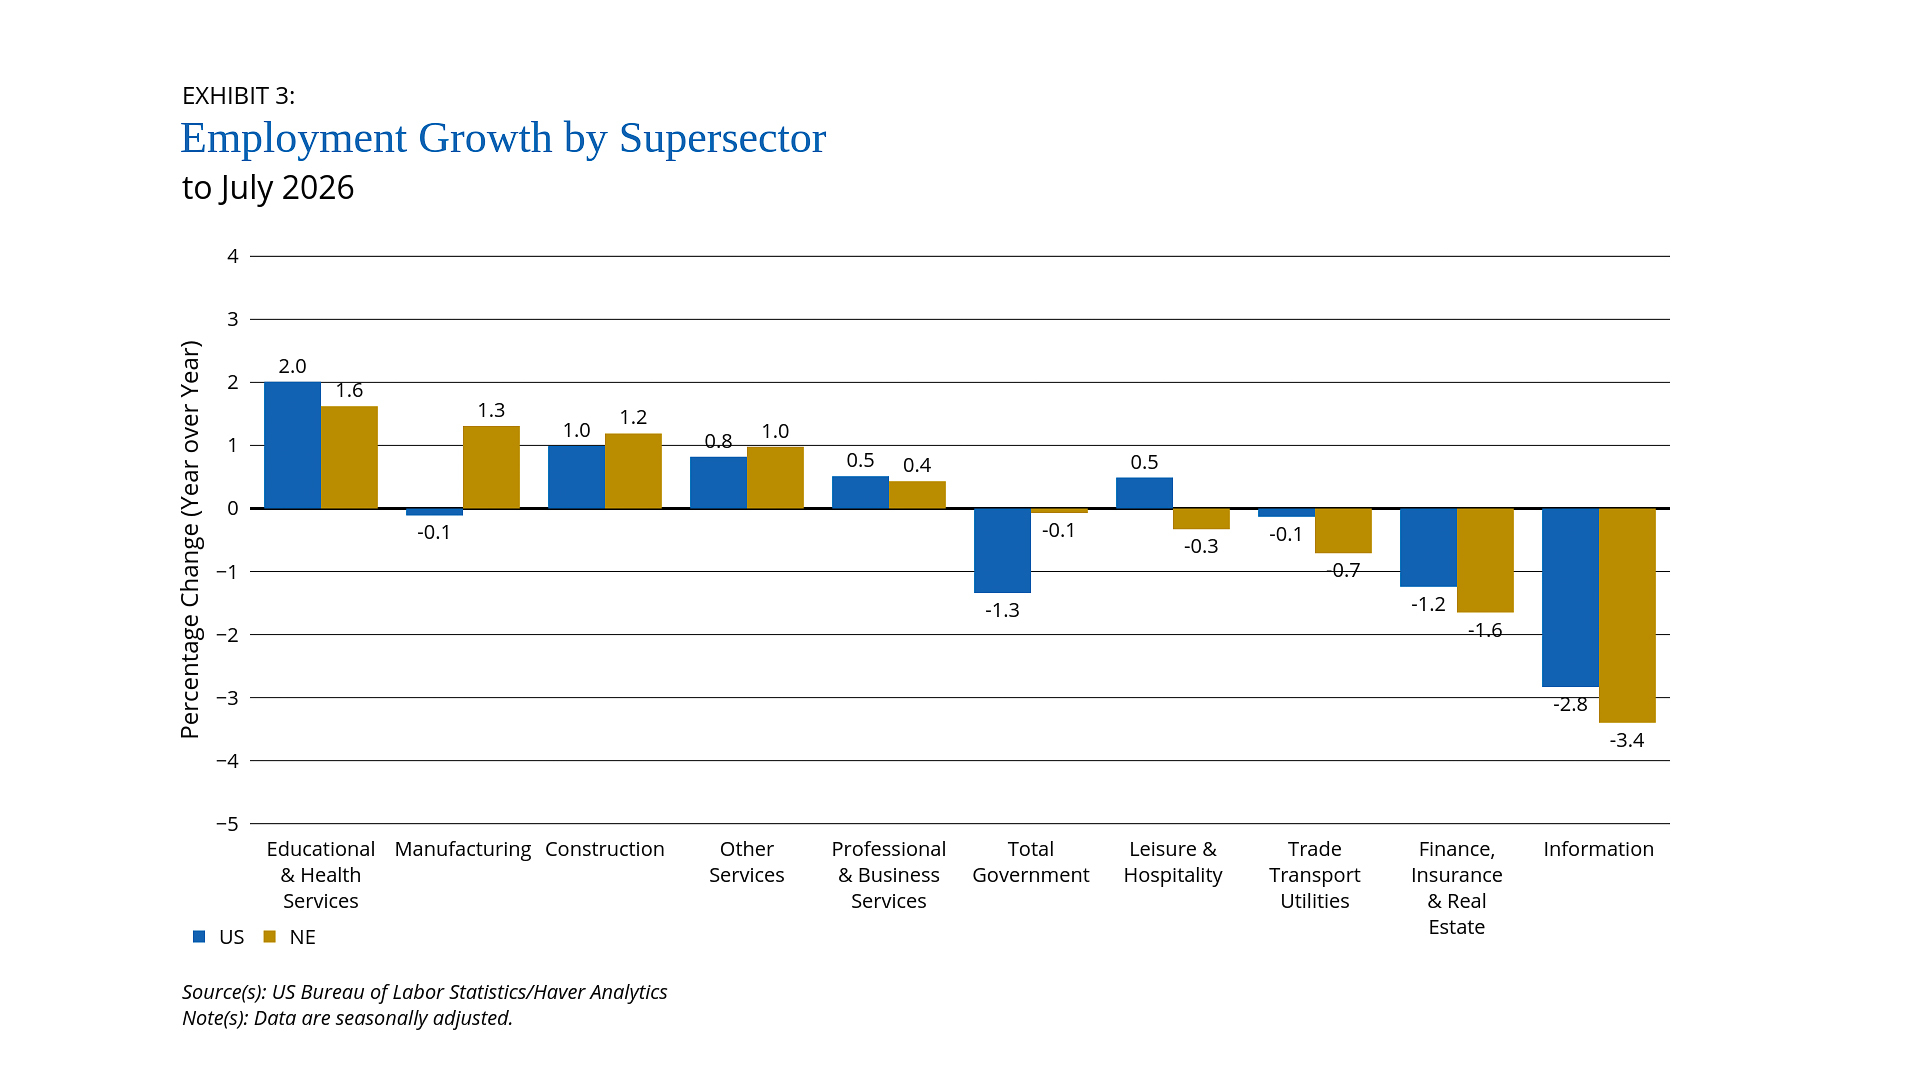
- Underneath the overall low rate of job growth are substantial differences across sectors. Roughly half the supersectors in New England added payroll employment in the last year—with several growing faster than the US average—and the other half lost jobs. The largest year-over-year employment gains in July 2026 were seen in education and health services, where payrolls expanded 1.6 percent. The largest declines were seen in Information, where payrolls shrank 3.4 percent.
- After climbing during the first half of 2026, consumer price inflation has come down—nationally and in New England—over the last two months of data. Consumer prices in New England for July 2026 increased 3.9 percent over the preceding year. The primary driver of growth was the transportation sector, where prices rose 8.0 percent. The sector includes fuel prices, which are directly impacted by the ongoing conflict in the Middle East.
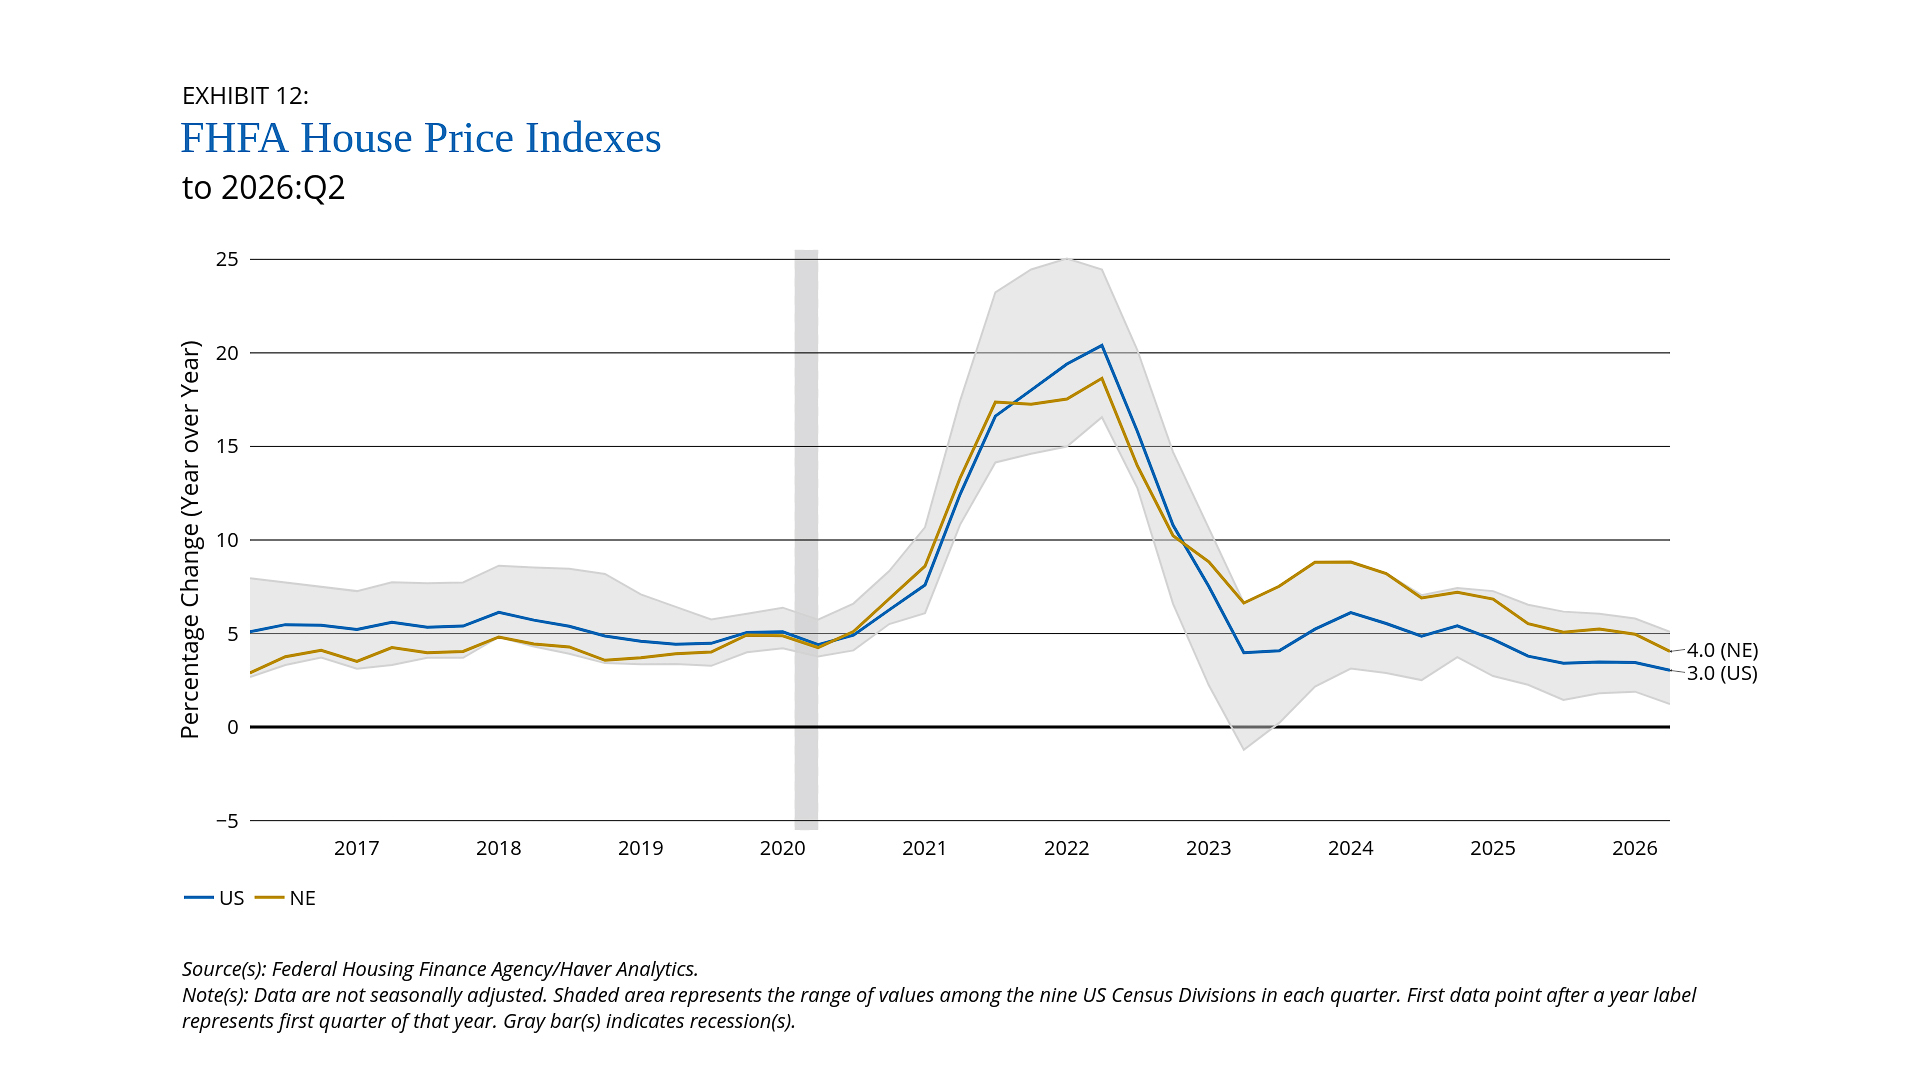
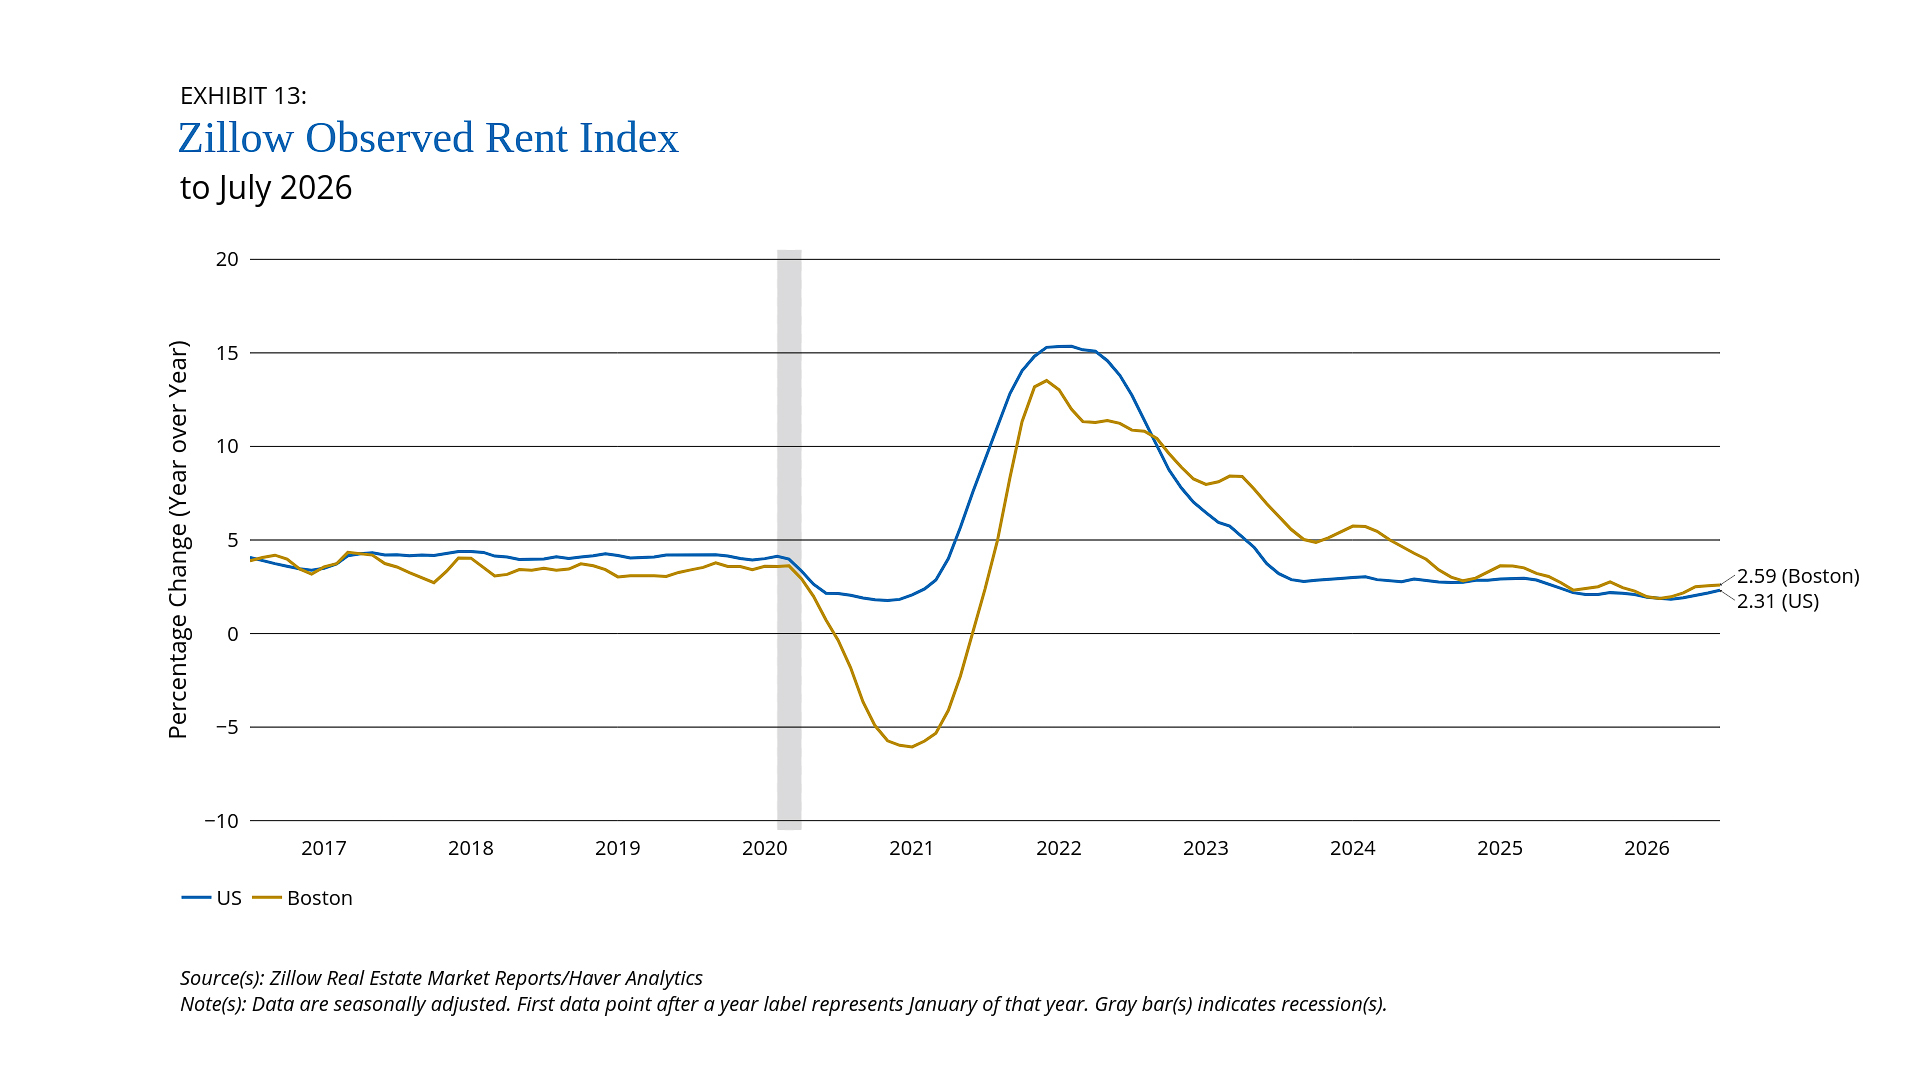
- House-price growth and rental inflation have normalized to—or even below —levels seen before the COVID-19 pandemic. In the second quarter of 2026, the FHFA House Price Index was up 4.0 percent over the preceding year for New England and 3.0 percent nationally. The Zillow listed rent index for July 2026 was up 2.6 percent over the preceding year in Boston and 2.3 percent nationally.
Sign up for new research and data on the New England economy.
Payroll Employment
- Payroll employment grew by 0.3 percent over the year in July, slightly higher than the US rate of 0.2 percent. This marked the second consecutive month of employment growth in New England, following a decline over the preceding 12 months, from June 2025 to May 2026. However, employment growth varied considerably by state, ranging from –0.3 percent in Rhode Island to 0.8 percent in Connecticut.
- Payroll employment growth also varied by supersector. Educational and health services experienced the strongest employment growth, rising 1.6 percent over the preceding year in July, while Information experienced the steepest decline in employment, falling 3.4 percent over the preceding year.
Year-over-year growth for New England payroll employment was 0.3 percent in July, narrowly higher than the US average, which rose 0.2 percent over the same period (Exhibit 1). Although the pace of employment growth was slow—just half the 30-year average rate of employment growth in the region—it represents an improvement relative to the recent past. During the period of June 2025 to May 2026, New England payroll employment declined each month, but the region has posted positive monthly jobs numbers since. After growing more slowly than the national average in every month since October 2021, New England payroll employment grew faster than the national average over the past two months.
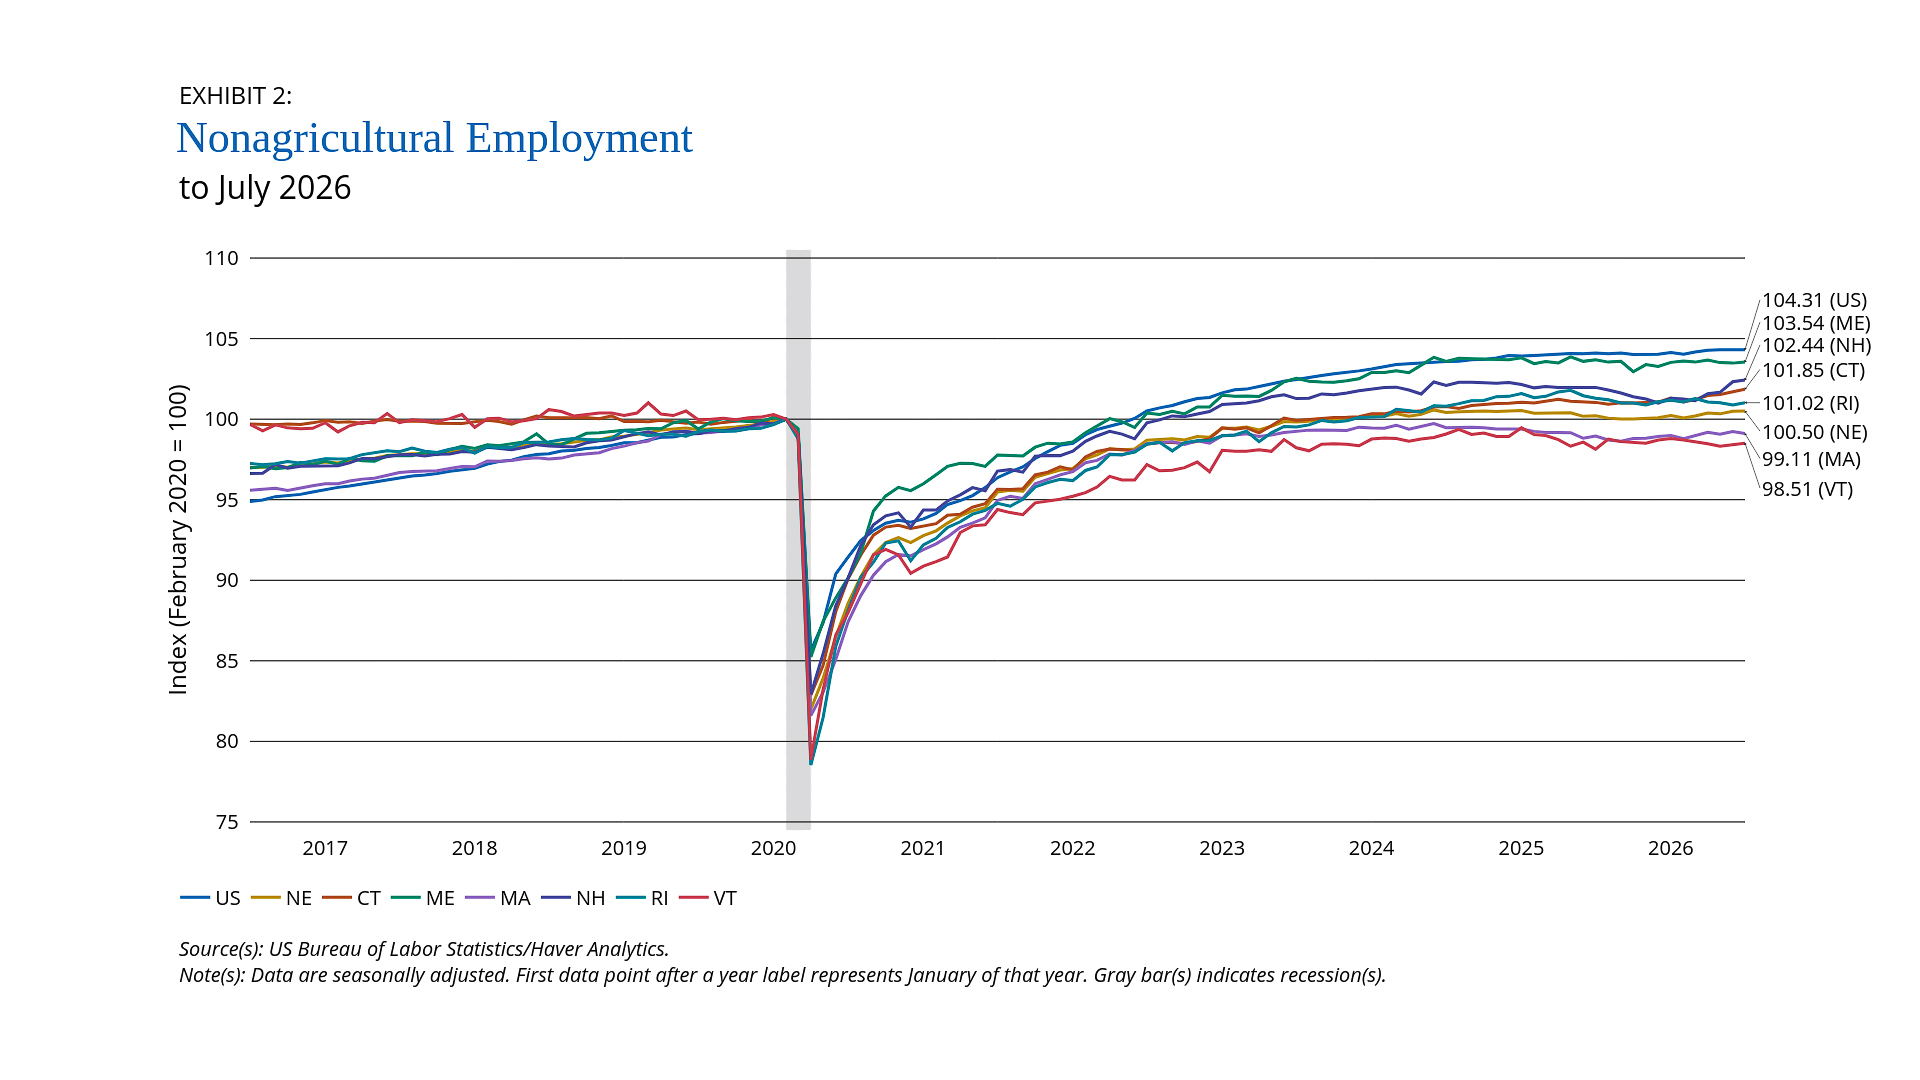
Across the region payroll employment growth has varied considerably by state (Exhibit 2). Employment gains were most pronounced in Connecticut and New Hampshire, with 0.8 percent and 0.5 percent year-over-year employment growth in July 2026, respectively, and flat or negative in the other New England states. Massachusetts and Vermont stand out as the two states in the region that have yet to return to pre-pandemic levels of employment, sitting, respectively, at 0.9 percent and 2.5 percent below February 2020 employment levels.
Five of New England’s 10 supersectors experienced positive year-over-year employment growth in July, including education and health services, manufacturing, construction, other services, and professional and business services (Exhibit 3). Education and health services was the region’s fastest-growing sector, with a rate of 1.6 percent, which was 0.4 percent slower than the national growth rate. Three New England supersectors—manufacturing, construction, and other Services—added jobs at a quicker clip than the national average. New England’s manufacturing employment rose 1.3 percent over the preceding year in July, while manufacturing employment declined 0.1 percent nationally. Information experienced the steepest job losses in July. Employment in that sector was down 3.4 percent in New England and 2.8 percent nationally. Two other New England sectors saw substantial employment declines as well: finance, insurance and real estate (–1.6 percent) and trade, transportation and utilities (–0.7 percent).
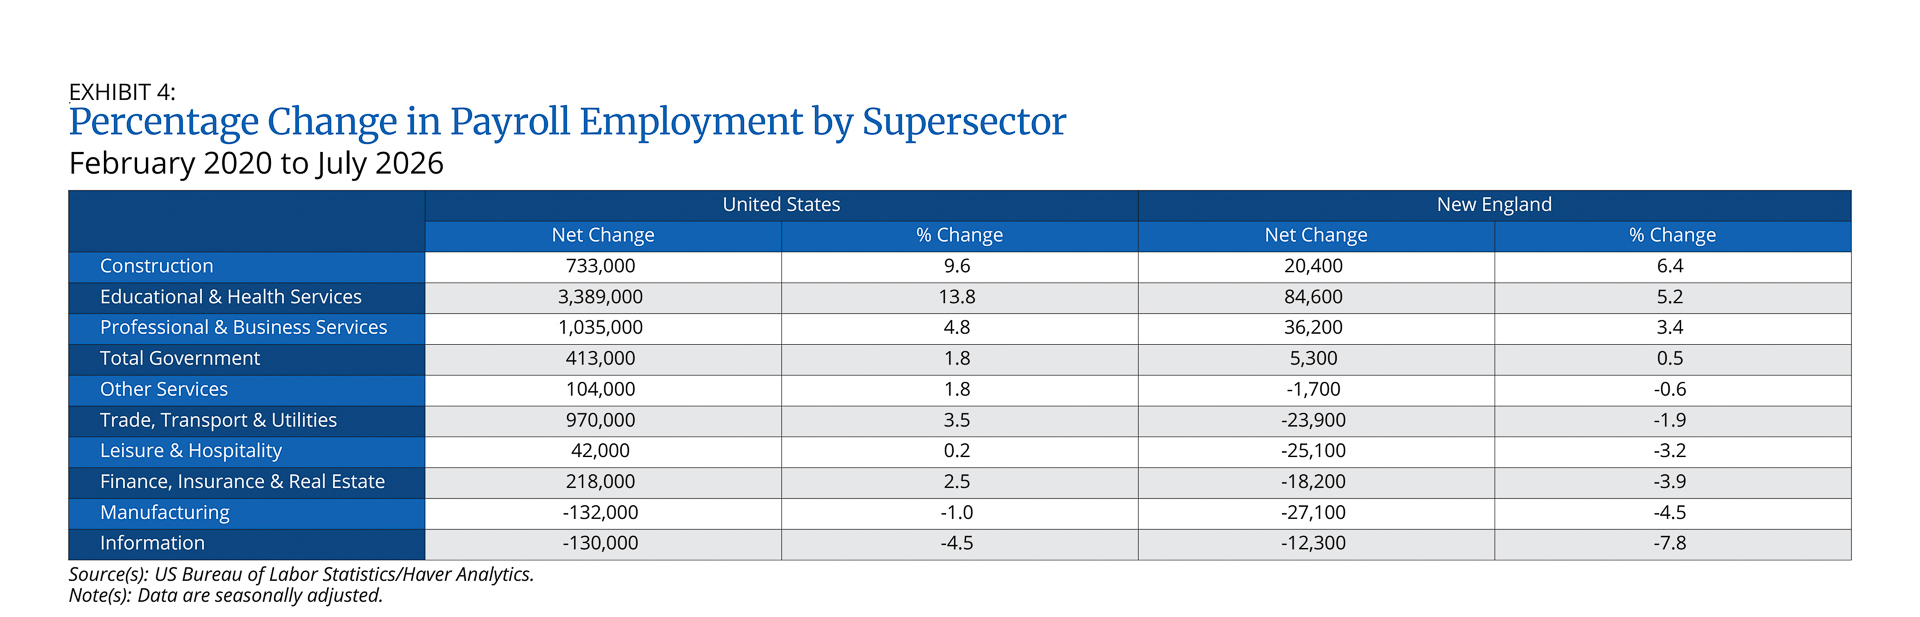
Three New England supersectors have posted relatively large gains compared with pre-pandemic employment levels, and four remain substantially below February 2020 employment (Exhibit 4). Payroll employment levels in construction, education and health services, and professional and business services in New England are each at least 3 percent above pre-pandemic levels, with education and health services alone adding nearly 85,000 jobs. Each of these supersectors has grown more slowly, however, than the national average. Payroll employment in leisure and hospitality; finance, insurance and real estate; manufacturing; and information in New England remains at least 3 percent lower than pre-pandemic levels. Total manufacturing employment for New England for July 2026 remains 27,100 below levels from February 2020.
On August 28, 2026, the Bureau of Labor Statistics released its preliminary benchmark revisions of payroll employment. Nationally, payroll employment estimates for March 2026 were revised down by 79,000 (–0.1 percent).1 While the revision for US employment was much smaller than the previous three years (when downward revisions ranged from 306,000 in 2023 to 911,000 in 2025), the revisions for employment in New England were comparatively large. March 2026 payroll employment for New England was revised down by 26,700, a larger downward revision than in the previous two years and comparable in magnitude to the large downward revision (–30,400) in 2023.2 The variation among the New England states was substantial. Maine and New Hampshire saw small upward revisions to March 2026 payroll employment (100 and 2,000, respectively). The other New England states had employment estimates revised downward, including Rhode Island (–4,000, or –0.8 precent) and Massachusetts (–17,700, or –0.5 precent). The preliminary revisions themselves do not alter current payroll employment estimates but give an indication of the magnitude of the final benchmark revisions to the monthly payroll employment that will be released in March 2027.

Federal Reserve Bank of Boston

Federal Reserve Bank of Boston
Federal Reserve Bank of Boston
Federal Reserve Bank of Boston
Unemployment
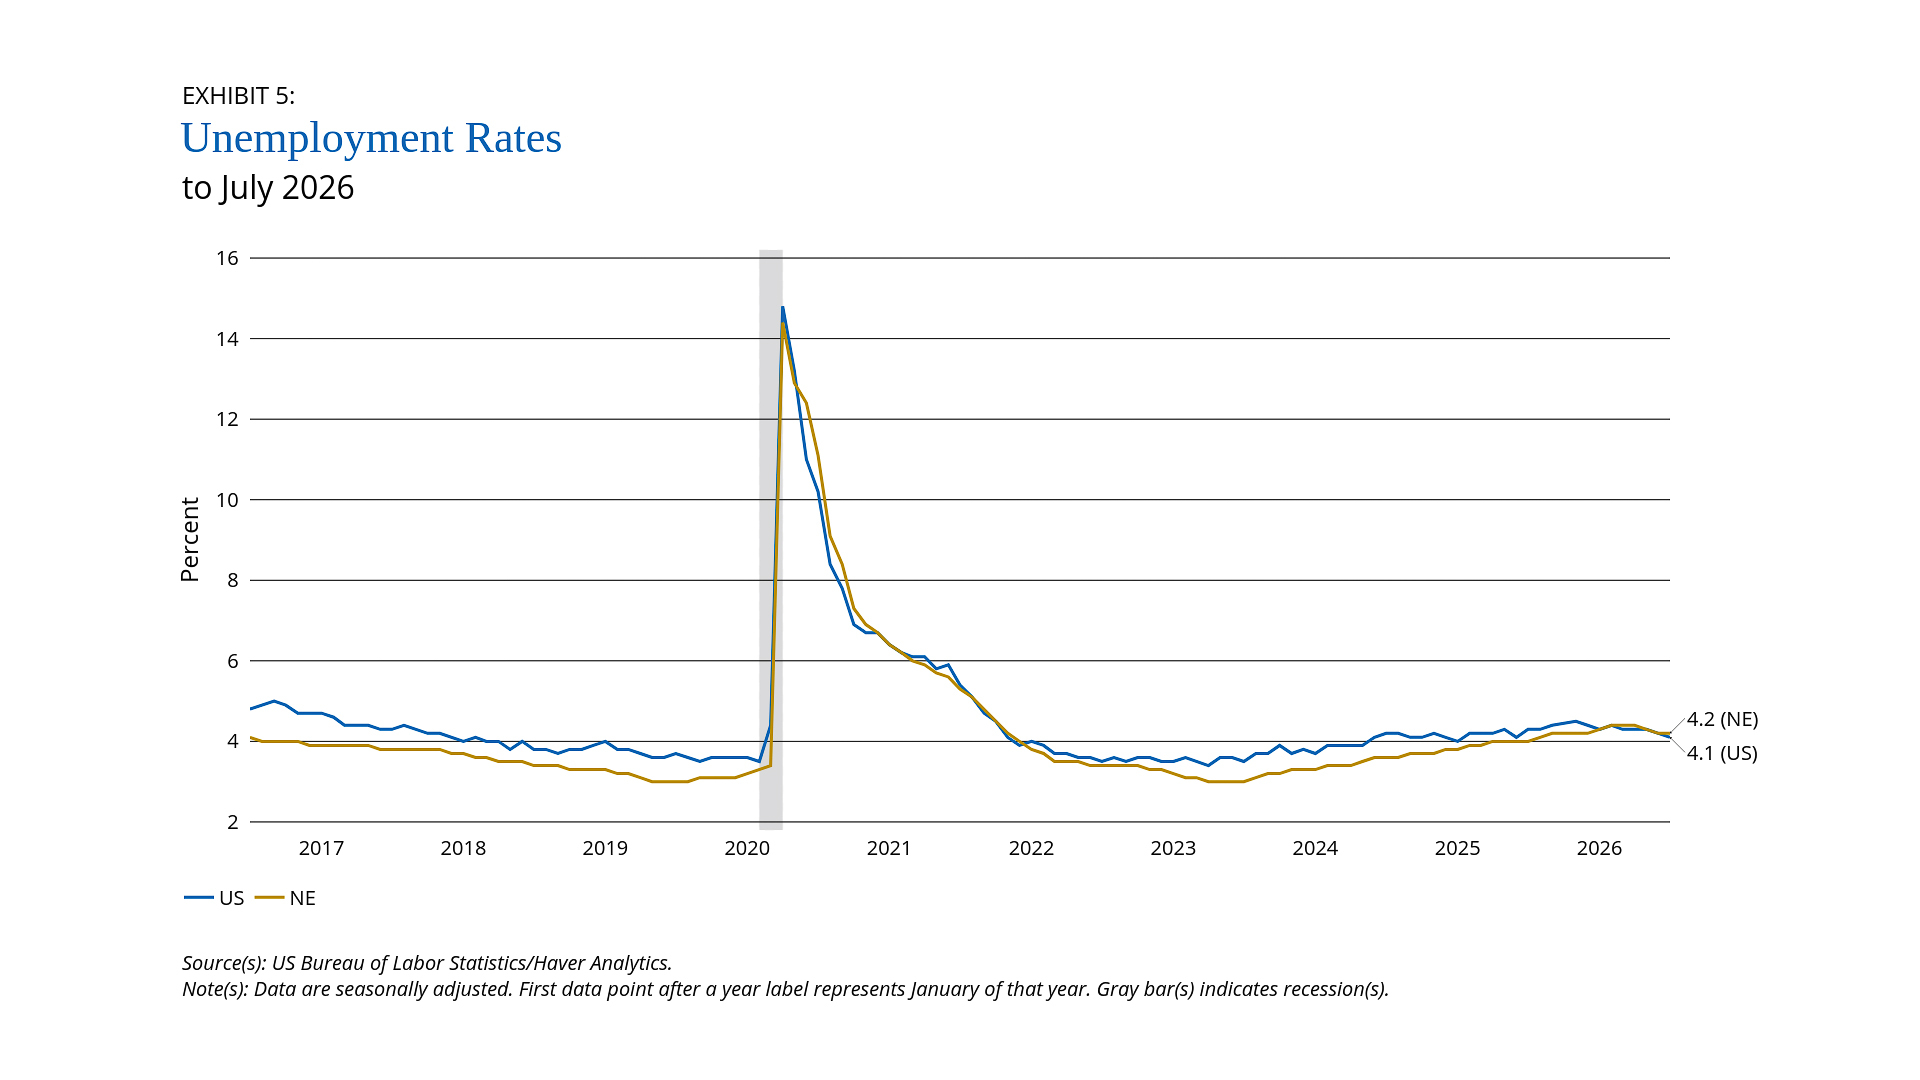
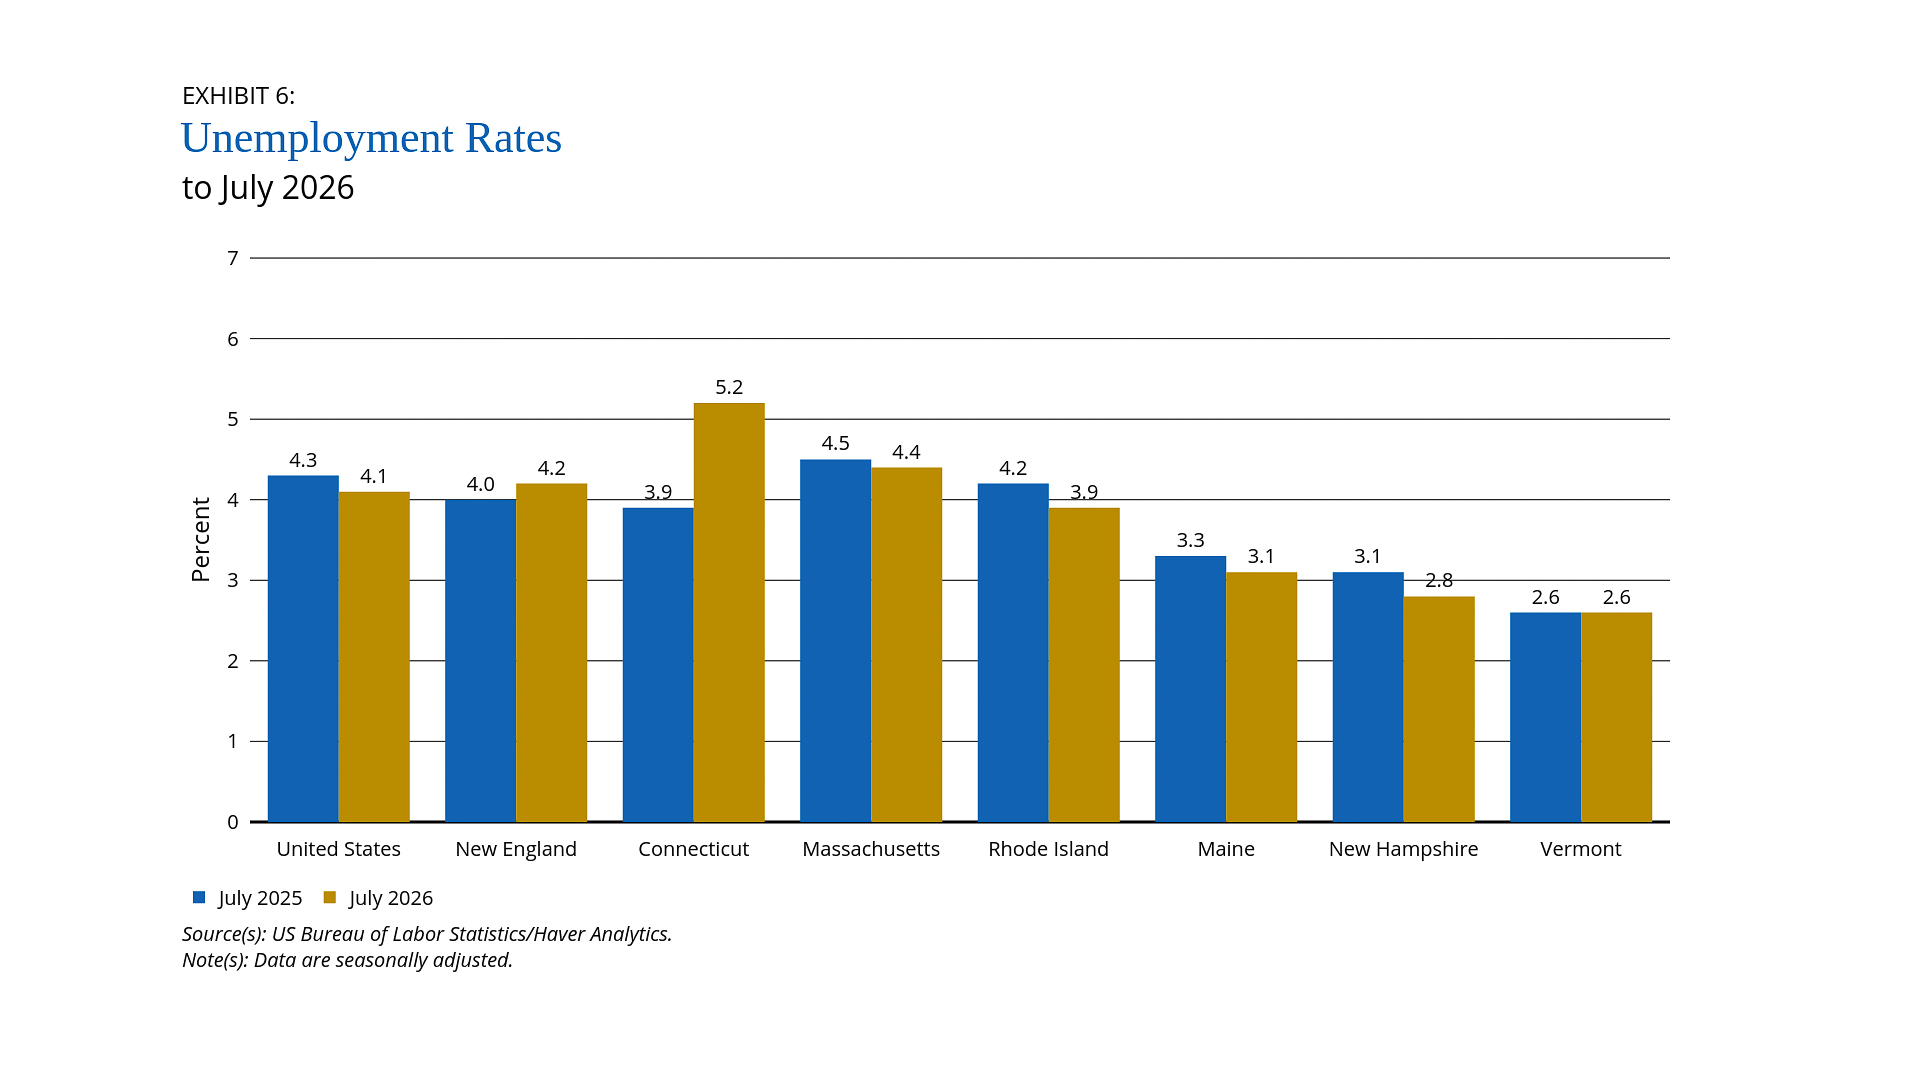
- Unemployment in New England was at 4.2 percent in July, just above the US rate of 4.1 percent. This represents a slight increase over the preceding year for New England (for which unemployment was 4.0 percent) but a slight decline for the United States (for which unemployment was 4.3 percent).
- While most New England states saw only slight changes in unemployment over the year, generally less than 0.3 percentage points in absolute terms, Connecticut experienced a 1.3 percentage point increase since July 2025.
New England’s average unemployment rate was 4.2 percent in July, unchanged from the preceding month and 0.1 percent above the US average of 4.1 percent for the same month (Exhibits 5 and 8). After rising slowly starting in mid-2023, the unemployment rate for New England and the US average rate have drifted down in recent months (since April for New England and since February for the United States).
The unemployment rate and how it changed over the last year have not been uniform across the New England states (Exhibit 6). The July 2026 unemployment rate ranged from 2.6 percent in Vermont to 5.2 percent in Connecticut, and four state rates were below the national rate. For the region as a whole, unemployment was up 0.2 percentage point over July 2025, but it declined year-over-year in four states, held steady in one, and rose sharply in another. Over the last year, unemployment dipped 0.3 percentage point in Rhode Island and New Hampshire, 0.2 percentage point in Maine, and 0.1 percentage point in Massachusetts, and held steady in Vermont. The outlier in New England was Connecticut, where the unemployment rate was up 1.3 percentage points over July 2025. Metropolitan area unemployment data are available only through June 2026, but those data show that unemployment was up uniformly across each of the state’s metro regions.3
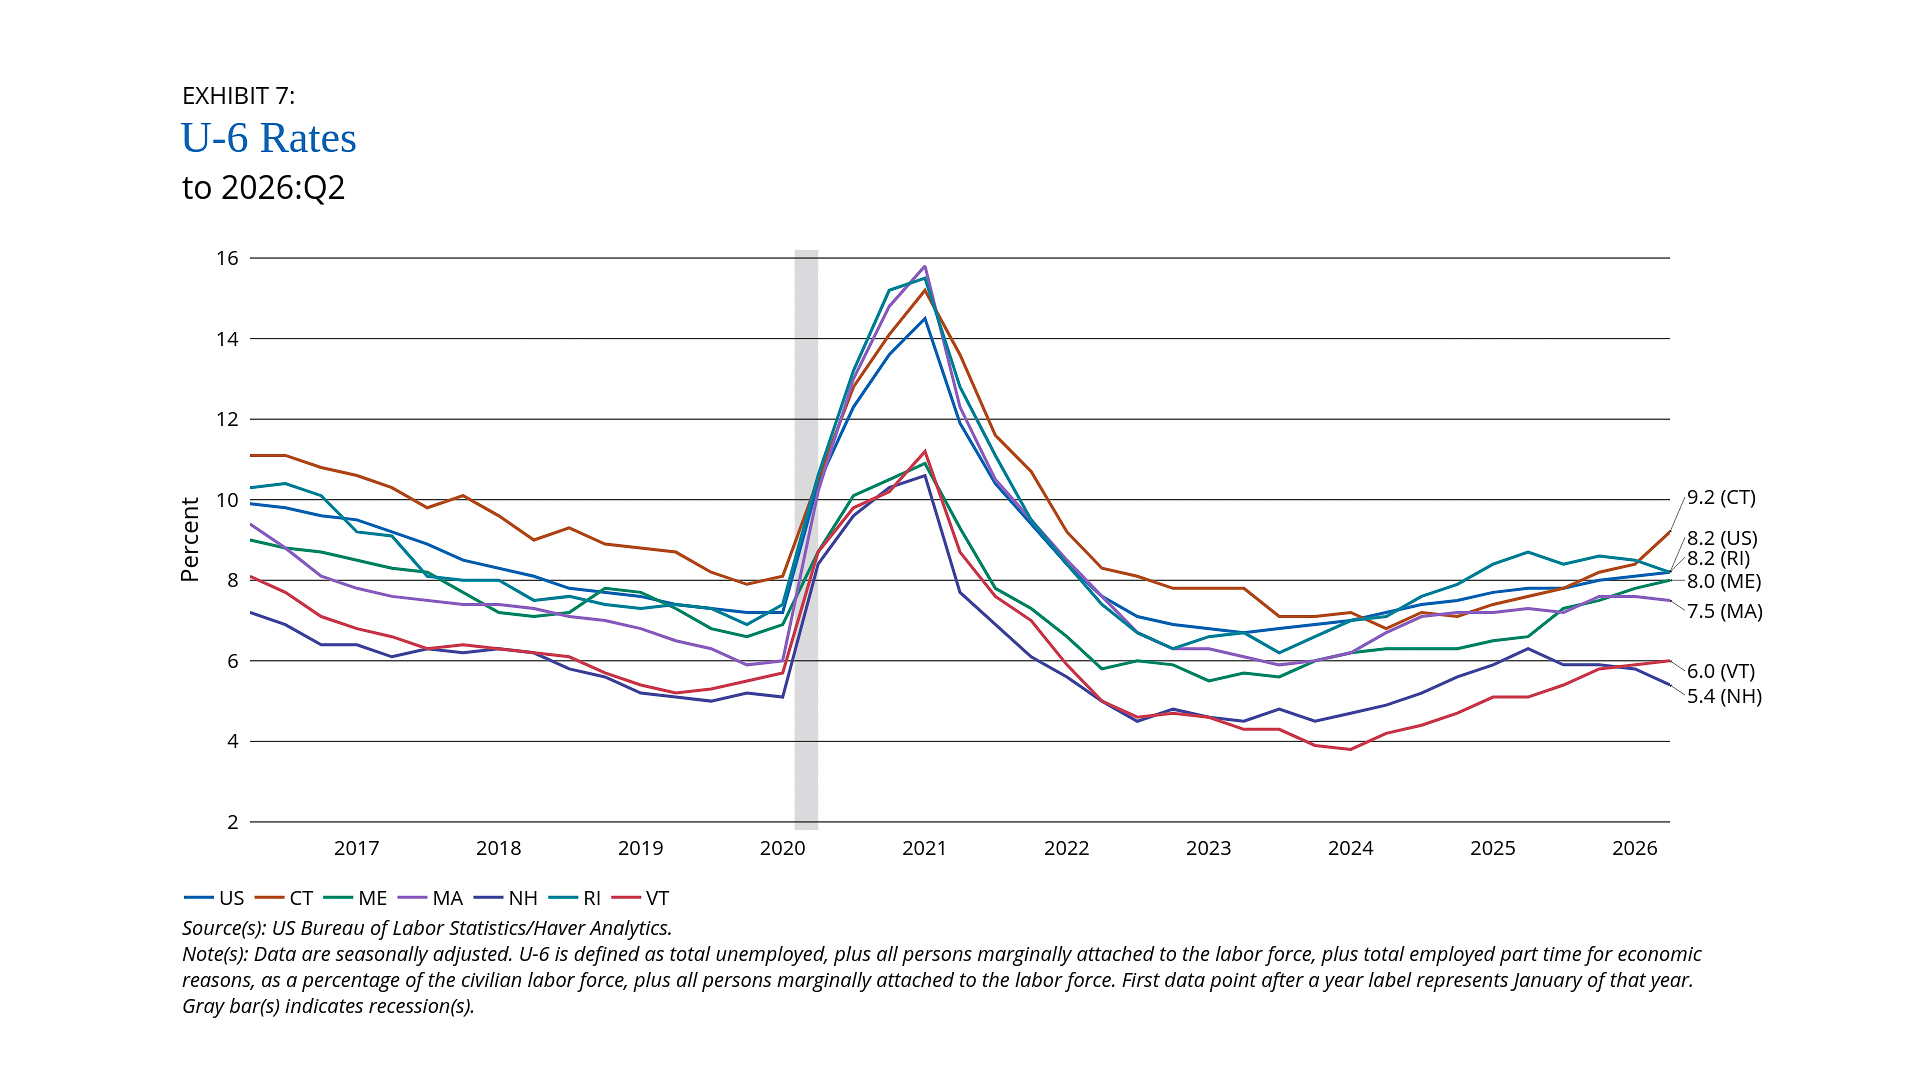
The U-6 rate provides a broader measure of unemployment, including not only those unemployed and seeking work, but also those employed part-time for economic reasons and those marginally attached to the labor force. The U-6 rate generally trends with the narrower unemployment rate (also called the U-3 rate) but reveals additional nuance about labor market conditions. The U-6 rate for 2026:Q2 ranged from 5.4 percent in New Hampshire to 9.2 percent in Connecticut (Exhibit 7). Over most of 2024 and 2025, Rhode Island’s U-6 rate was the highest in New England, but the state’s expanded unemployment measure has been falling in recent quarters and now matches the US average of 8.2 percent. Two New England states with declining or flat unemployment over the past 12-month period (Maine and Vermont) experienced noticeable increases in their U-6 rates; the U-6 rate for 2026:Q2 was up 1.4 percent in Maine and 0.9 percent in Vermont over 2025:Q2 levels.
Federal Reserve Bank of Boston
Federal Reserve Bank of Boston
Federal Reserve Bank of Boston
Household Survey Measures of Employment and Labor Force Participation
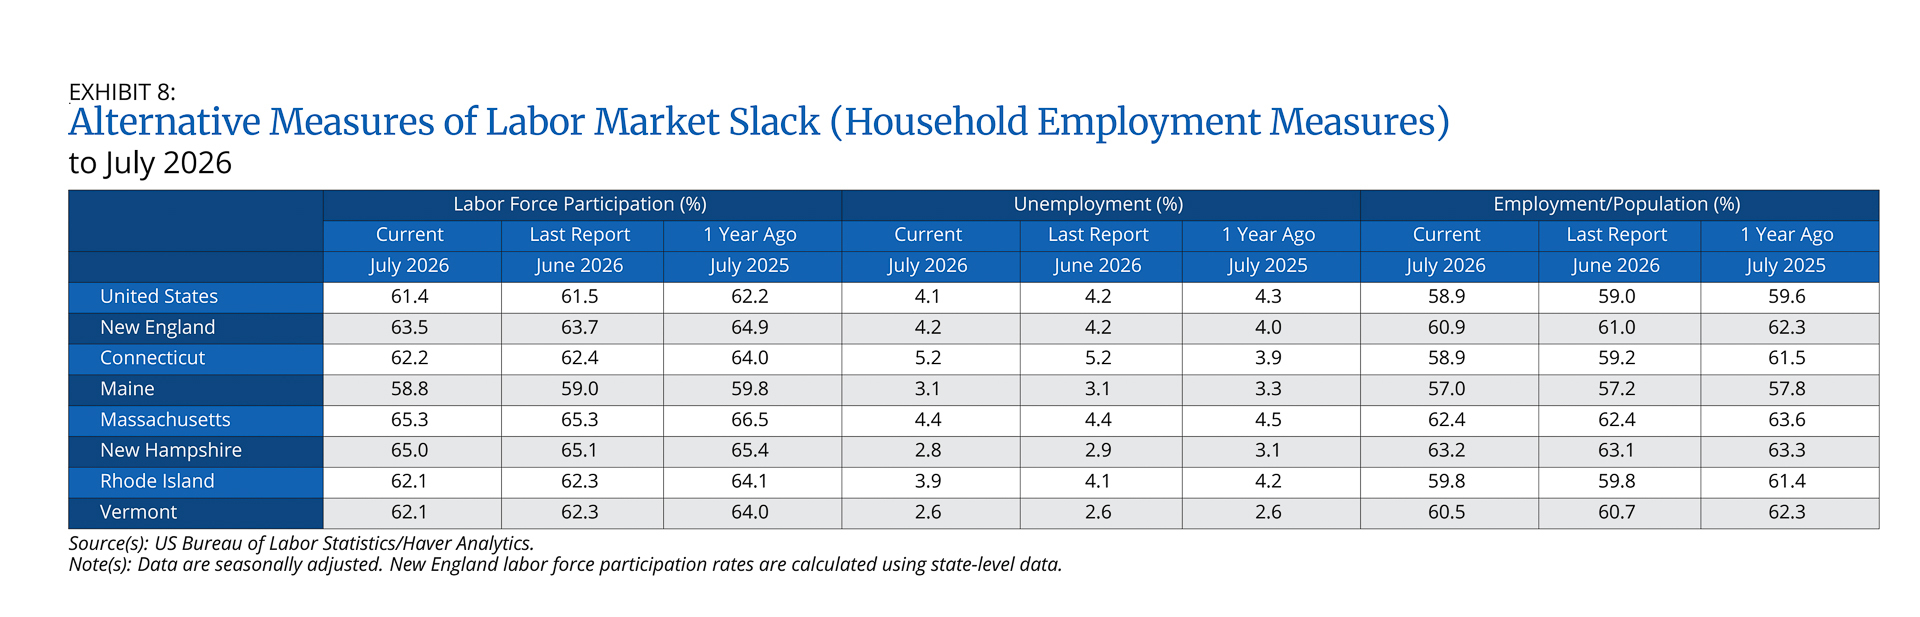
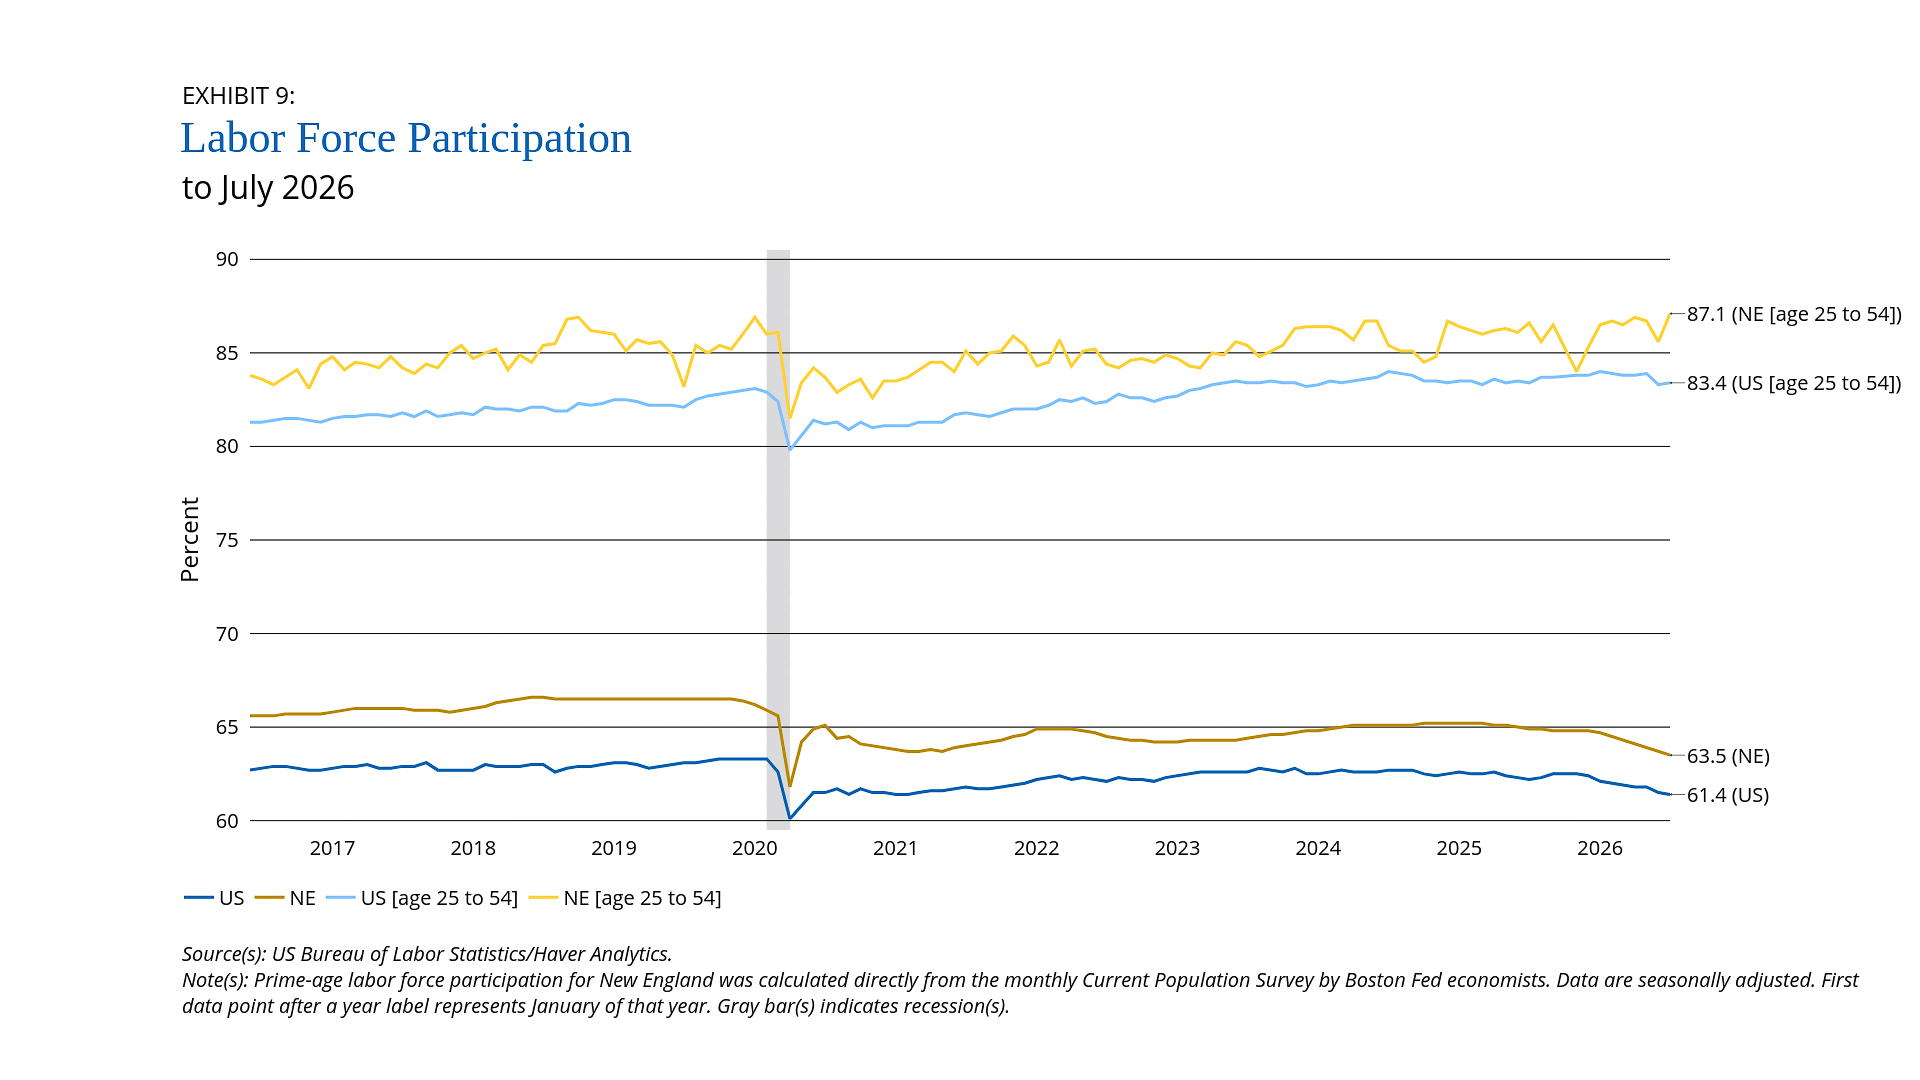
- Despite slow job growth, the economy continues to maintain low unemployment due to declining labor force growth. New England labor force participation fell 1.4 percentage points from the preceding year, dropping to 63.5 percent in July 2026. The decline in New England was slightly larger than the 0.8 percentage point drop at the national level.
- The decline in labor force participation appears to be driven by older workers, as the participation rate among prime-age workers (aged 25 to 54) has remained relatively stable.
The economy has been able to sustain the low unemployment that remains consistent with most economists’ definitions of full employment alongside slow rates of job growth in large part because labor force growth has slowed. We have seen both slower rates of population growth and recently falling rates of labor force participation.4 The total labor force participation rate for New England was 63.5 percent in July 2026, which was down 1.4 percentage points from a year earlier (Exhibit 8) and lower than during the pre-pandemic period, when it averaged 66.1 percent in from mid-2016 through early 2020 (Exhibit 9).5 Labor force participation for the United States is lower than in New England, but the rest of the country has exhibited the same pattern over this period. For New England and the United States, labor force participation has fallen back to levels last seen in early 2021.
Some of the decline in labor force participation is driven by work activity and retirement among older workers. We do not see the same decline in participation among the “prime workforce-age population”—those aged 25 to 54. The prime-age labor force participation rate for New England was 87.1 percent in July 2026 (depicted by the light red line in Exhibit 9) and remains elevated above pre-pandemic levels. This series is more volatile than the other data shown in Exhibit 9, because we calculate it directly from the monthly Current Population Survey and do not subject it to any modelling or smoothing, as is standard for the Bureau of Labor Statistics Local Area Unemployment Statistics (BLS LAUS) program series. Aside from noise, recent months of data for prime-age labor force participation in New England are consistent with levels experienced over the last several years. The July 2026 prime-age participation rate was consistent with levels observed across the last two years (from July 2024 to June 2025), when the prime-age labor force participation rate for New England averaged 85.9 percent.
Federal Reserve Bank of Boston
Federal Reserve Bank of Boston
Consumer Prices
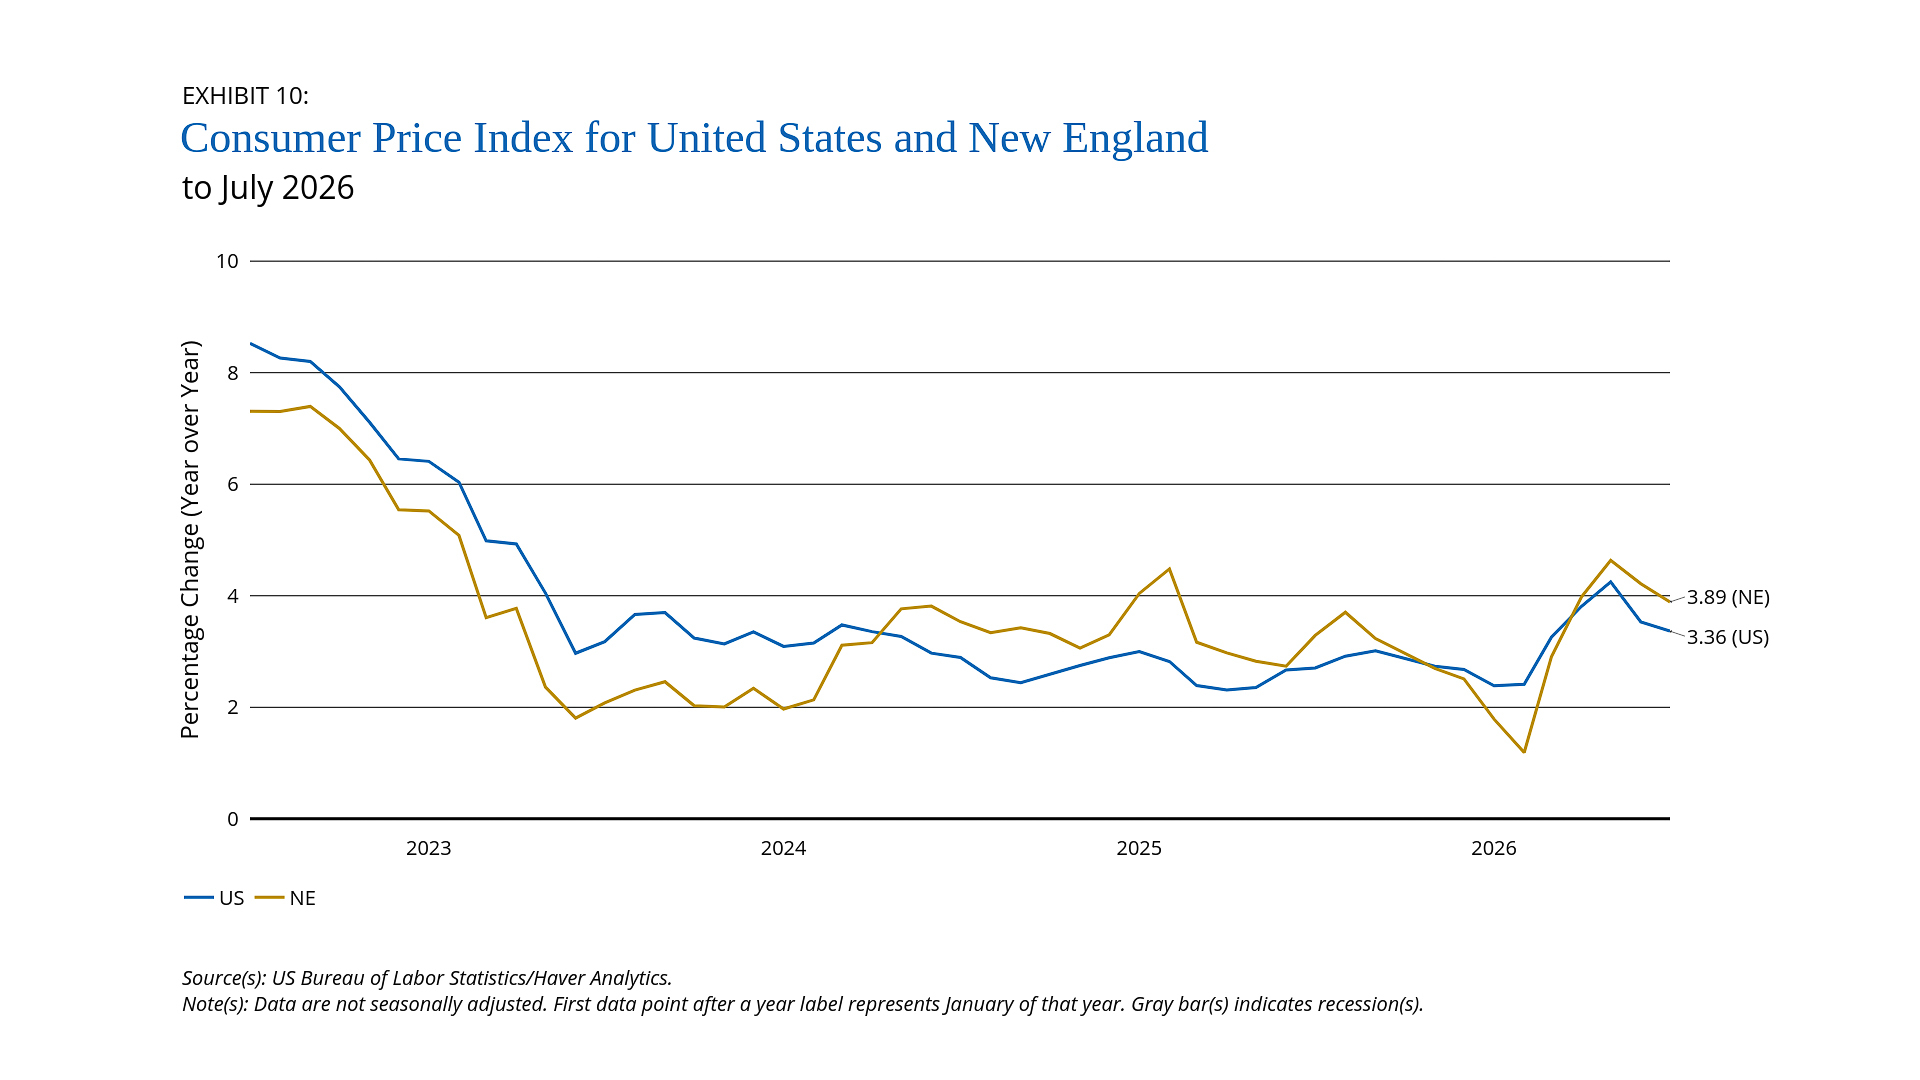
- New England consumer prices increased 3.89 percent in July over the year, slightly more than the US inflation rate of 3.36 percent. This marked the second month of receding inflation since the spike following the beginning of the recent conflict in the Middle East.
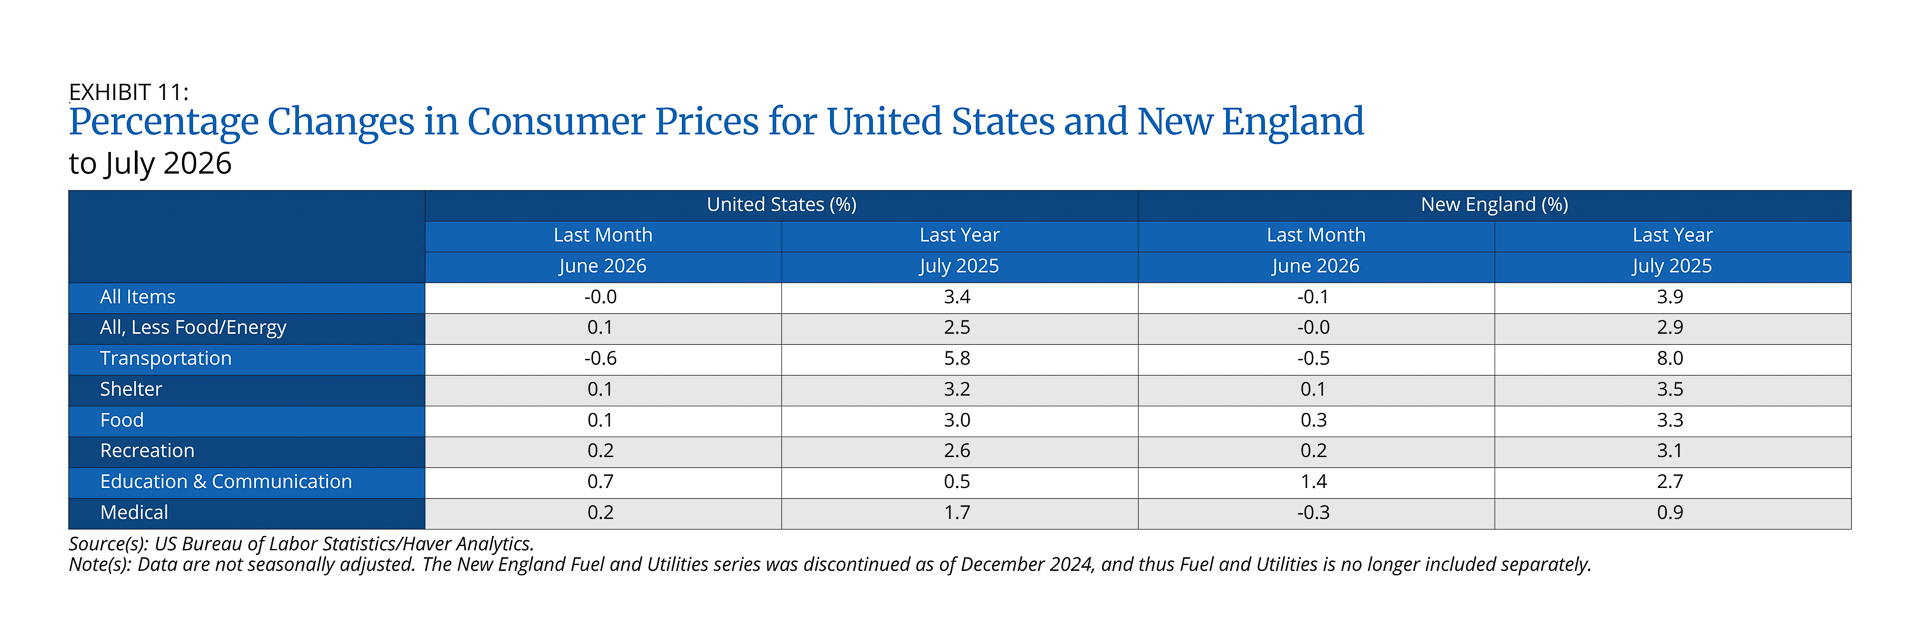
- Price increases were primarily driven by transportation costs, which rose 8.0 percent over the year in New England and 5.8 percent over the year nationally.
Consumer prices in New England, as measured by the consumer price index (CPI), were up 3.89 percent in July 2026 over the preceding year (Exhibit 10). The CPI for the United States was up 3.36 percent over the same period. Nationally and in New England, inflation rose sharply from February 2026 to May 2026, when both series hit their highest point since the post-pandemic inflation surge. July represents the second month of receding inflation since the initiation of the recent conflict in the Middle East.
Looking at the components of the CPI (Exhibit 11), we see that the transportation sector stands out as the prime driver of year-over-year price growth nationally and in New England. July 2026 prices in the transportation sector, which includes fuel prices, were up 8.0 percent over the preceding year for New England and 5.8 percent for the United States. At least as measured by the CPI through July, the surge in fuel prices shows signs of receding. Compared with prices in June 2026, transportation prices were down 0.5 percentage point for New England and 0.6 percentage point for the United States. July 2026 core inflation, which excludes volatile food and energy prices, was up 2.9 percent over the preceding year for New England and 2.5 percent nationally.
Federal Reserve Bank of Boston
Federal Reserve Bank of Boston
Housing Prices
- In July, CPI shelter prices were up 3.5 percent over the year in New England and 3.2 percent in the United State, a sign of continuing stabilization of house-price and rental inflation since the post-pandemic surge.
- Home prices and rent inflation have generally stabilized in New England and nationally, with indexes at or below pre-pandemic levels.
House-price and rental inflation have stabilized following the post-pandemic surge, with the rate of increase returning to or falling below pre-pandemic levels. The shelter component of the CPI (Exhibit 11) reflects changes in rents paid by incumbent renters as well as the “equivalent rent” the Bureau of Labor Statistics estimates that owners would pay to rent their home.6 July 2026 shelter prices were up 3.5 percent over the preceding year in New England and 3.2 percent for the United States.
Home prices paid by prospective buyers do not always track perfectly with CPI shelter costs, but the FHFA Home Price Index (HPI) on repeat sales of the same properties has now normalized to or even fallen below levels seen before the COVID-19 pandemic (Exhibit 12). The HPI for the second quarter of 2026 was up 4.0 percent over the year for New England and 3.0 for the United States.
Inflation in listed rents in the residential real estate market was up 2.6 percent in July 2026 over the preceding year in Boston and 2.3 percent nationally (Exhibit 13). Both indexes have been largely flat, though still declining slightly, since late 2024 and are now at levels below pre-pandemic averages. From mid-2016 to February 2020, the Zillow rent index averaged 3.5 percent for Boston and 4.1 percent for the United States.
Federal Reserve Bank of Boston
Federal Reserve Bank of Boston
Office Vacancy and Rent
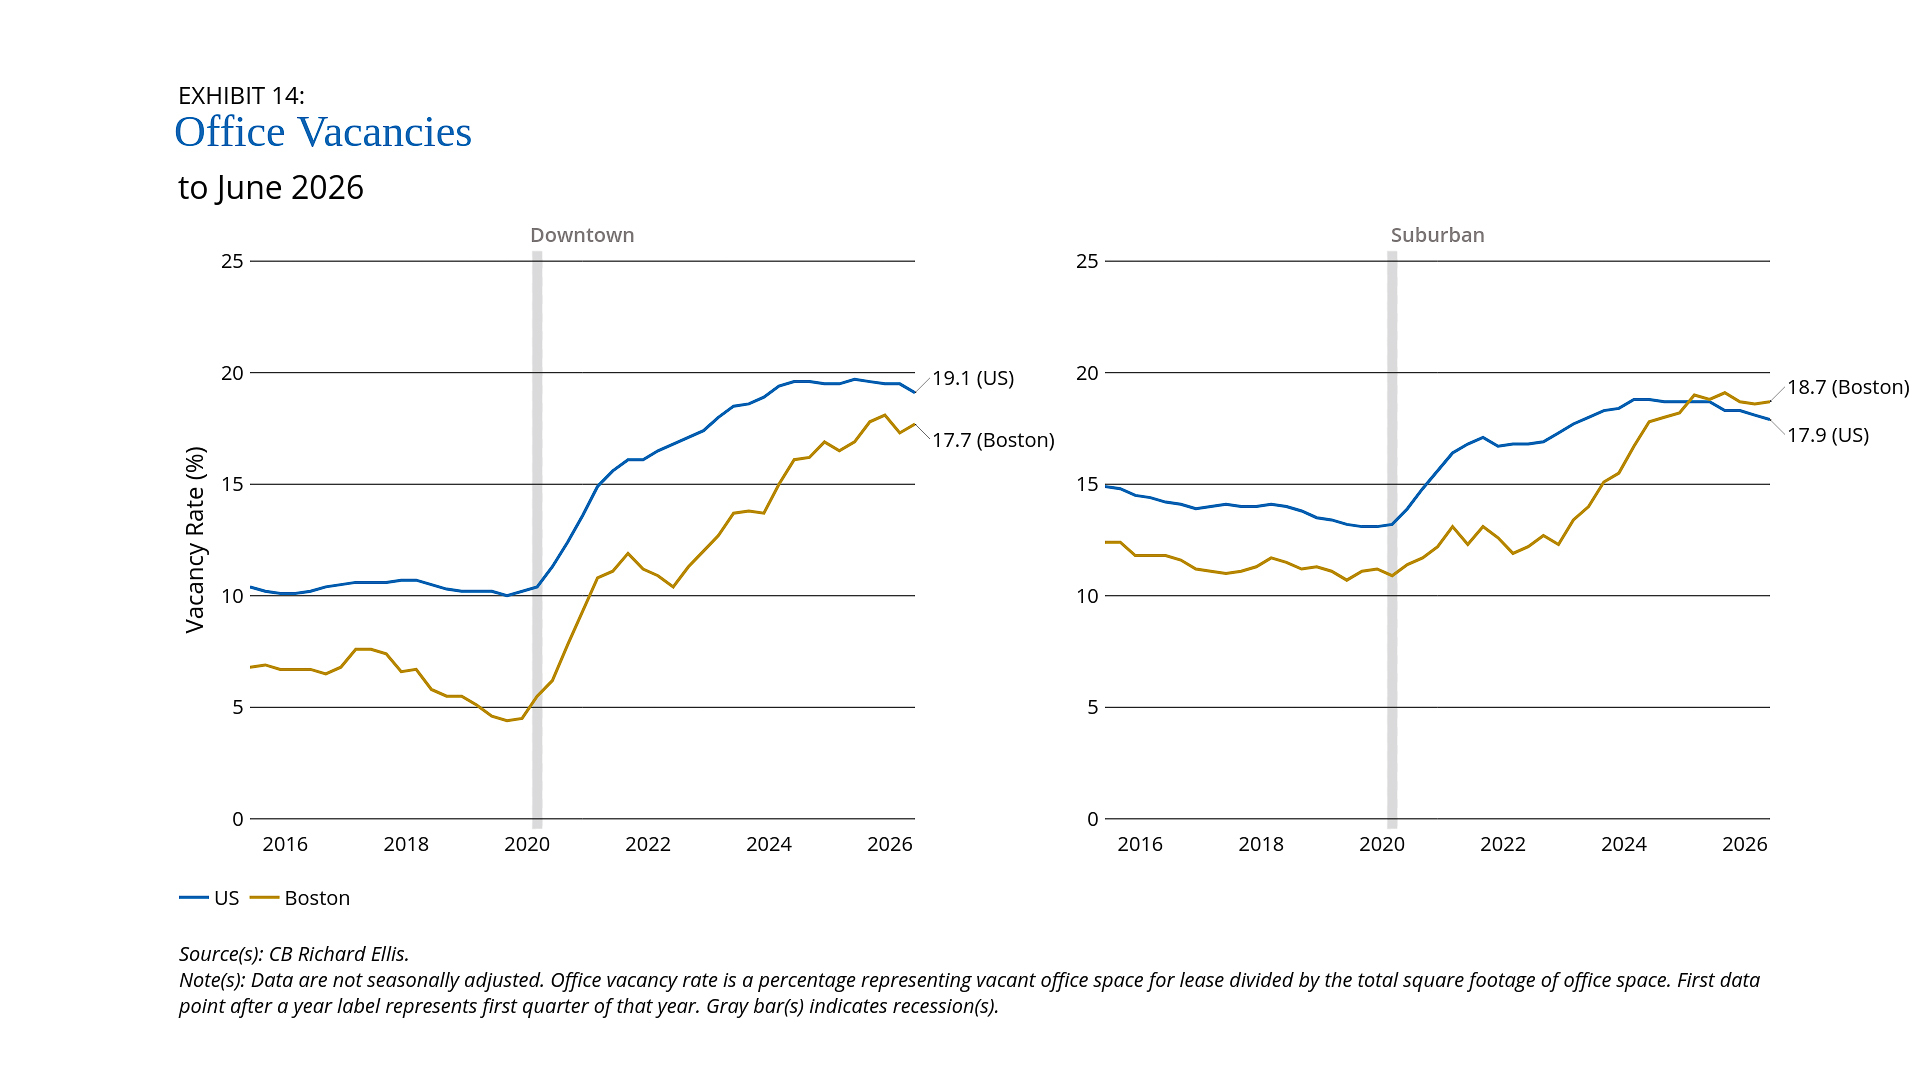
- Office vacancy rates, for both downtown and suburban markets, in Boston and nationally have somewhat stabilized or even decreased slightly after several years of growth following the onset of the COVID-19 pandemic. Boston’s suburban office vacancy rate, for example, rose 6.6 percentage points from 2022:Q2 to 2025:Q2, but in 2026:Q2, it was down 0.1 percentage point over the preceding year.
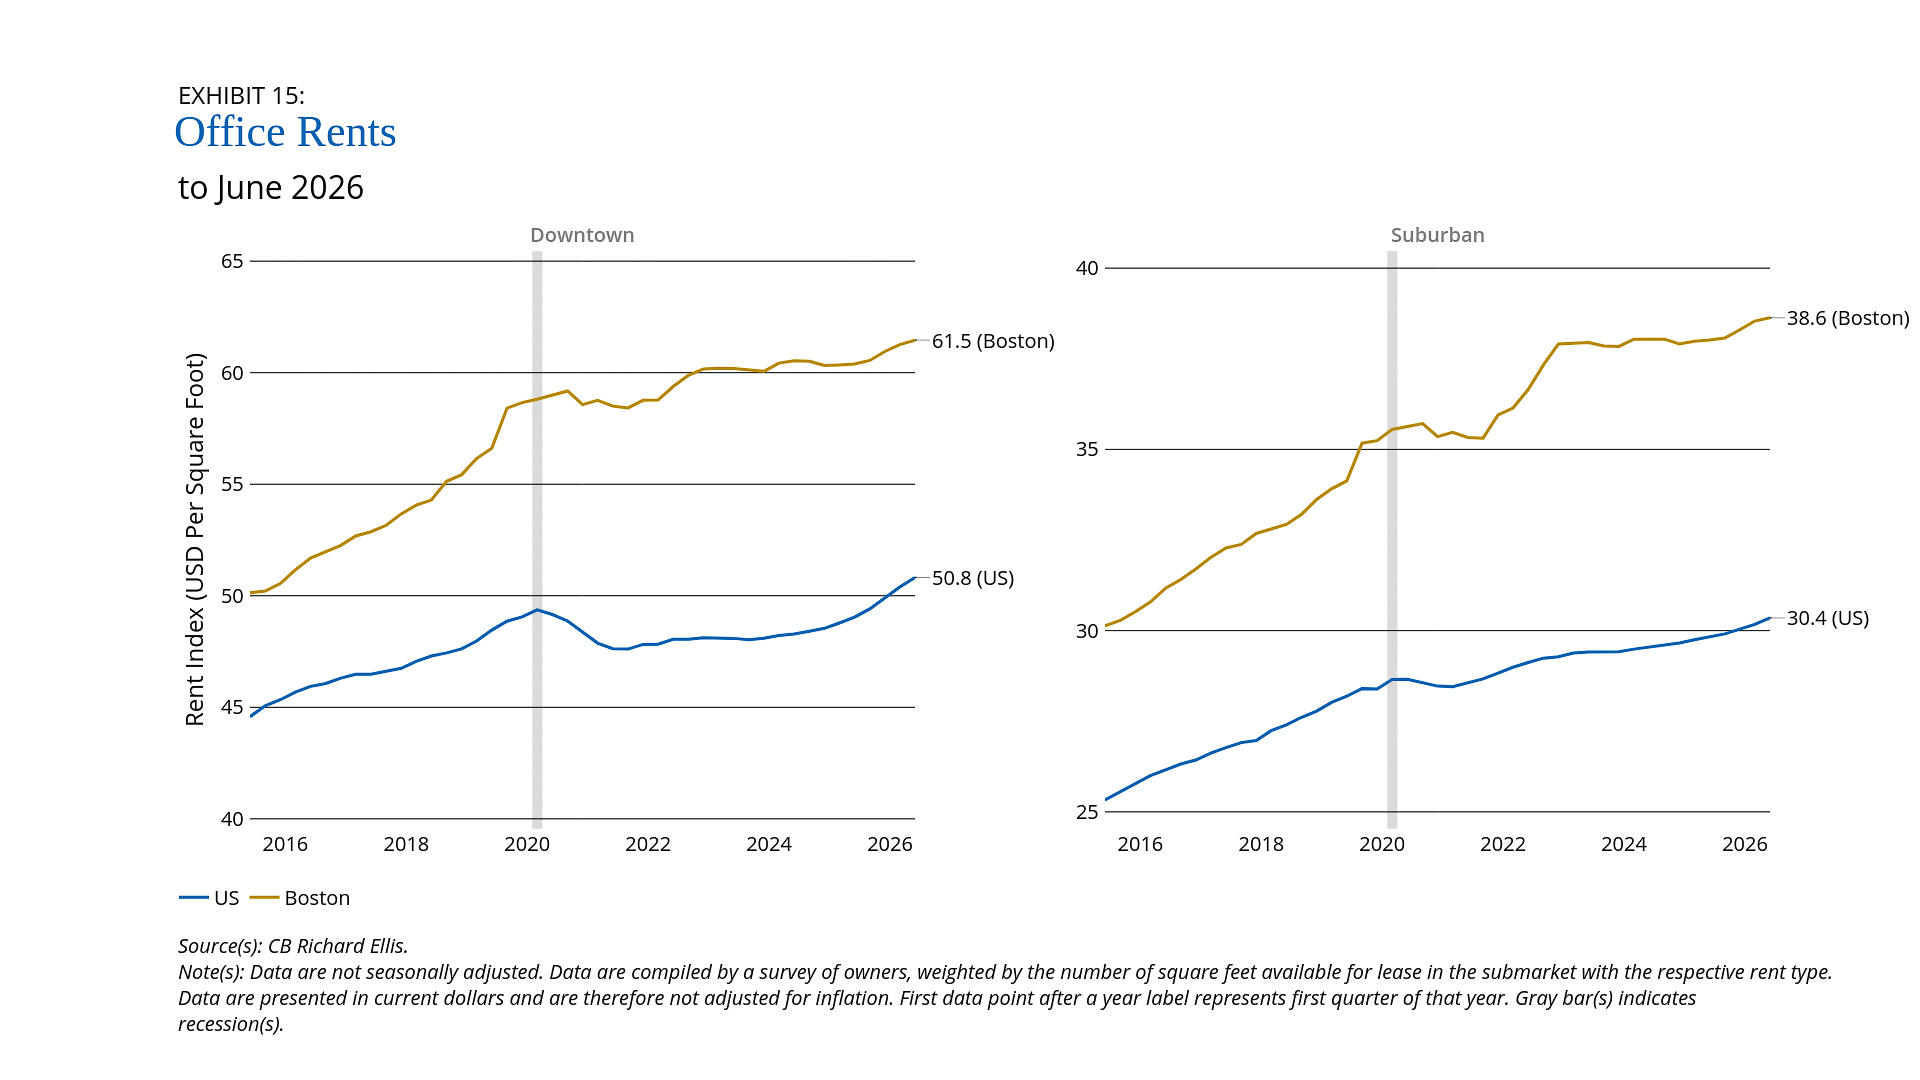
- Office rents ticked up over the past several quarters for downtown and suburban properties in Boston and nationally.
Over the last year, vacancies for office buildings—in both downtown and suburban markets nationally and in Boston—seem to have stemmed their several-years-long rise. Rents also picked up. In both downtown and suburban real estate markets, office vacancy rates surged in the wake of the COVID-19 pandemic and continued rising well into the post-pandemic economic recovery. The suburban office vacancy rate for the quarter ending June 2026 was 18.7 percent in Boston and 17.9 percent nationally (Exhibit 14, right panel). Boston’s suburban office vacancy has been flat, and the US rate has been sliding since the same quarter in 2025. The more-or-less steady rise in Boston’s downtown office vacancy rate shows signs of abating in the most recent two quarters of data, sitting at 17.7 percent in the quarter ending June 2026 (Exhibit 14, left panel). National downtown vacancy rates plateaued during the 2024-Q2–2026:Q1 period but dipped to 19.1 percent in the most recent quarter of data.
After remaining flat during 2024 and the first half of 2025, Boston’s downtown office rents have increased in each quarter since 2025:Q3, with the rent index reaching 61.5 in 2026:Q2 (Exhibit 15, left panel). Boston’s suburban office rent index was essentially unchanged—in nominal terms—from 2022:Q4 through 2025:Q3 but has ticked up in each quarter since, hitting 38.6 in 2026:Q2 (Exhibit 15, right panel). Though national office rents have also risen along a largely similar trajectory, Boston’s office rents have steadily drifted higher than their national counterparts. In 2015:Q2, Boston’s downtown and suburban office market rents were 13 percent and 19 percent higher, respectively, than the equivalent national market averages. By 2026:Q2, these gaps between Boston and national average office rents had grown to 21 percent and 27 percent, respectively.
Federal Reserve Bank of Boston
Federal Reserve Bank of Boston
Endnotes
- Current Employment Statistics Preliminary Benchmark (National) Summary - 2026 A01 Results
- Current Employment Statistics Preliminary Benchmark (State and Area) Summary - 2025 A01 Results
- Data from June 2026 show that year-over-year increases in Connecticut’s metropolitan areas ranged from 1.2 percentage points in Bridgeport-Stamford-Norwalk and Norwich-New London-Willimantic to 1.4 percentage points in Waterbury-Shelton.
- See US Census publications, including “New 2024 Population Estimates Show Nation’s Population Grew by about 1% to 340.1 Million since 2023” and “U.S. Population Growth Slows Due to Historic Decline in Net International Migration.”
- Unless otherwise specified, the labor force participation rate is measured for the population aged 16 and older. Specifically, the statistic is a ratio of the employed population plus the unemployed population (in the household survey) to the total population aged 16 and older.
- The other items included in CPI shelter costs are the prices of lodging away from home and tenants’ and household insurance. https://www.bls.gov/cpi/factsheets/owners-equivalent-rent-and-rent.htm

 About the Authors
Jeffrey P. Thompson,
Federal Reserve Bank of Boston
Jeffrey P. Thompson is a vice president and economist in the Federal Reserve Bank of Boston Research Department, where he is the director of the New England Public Policy Center.
Email: jeffrey.thompson@bos.frb.org
Elizabeth Brame,
Federal Reserve Bank of Boston
Elizabeth Brame is a research associate in the Federal Reserve Bank of Boston Research Department.
Acknowledgments
Kelly Jackson, a senior data analyst in the Federal Reserve Bank of Boston Research Department, prepared the exhibits for this memo.
Resources
Keywords
- Regional economy ,
- Economic Conditions ,
- New England