Coming to Terms with Massachusetts’ Post-pandemic Employment Growth 


Federal Reserve Bank of Boston

The views expressed herein are solely those of the authors and should not be reported as representing the views of the Federal Reserve Bank of Boston, the principals of the Board of Governors, or the Federal Reserve System.
Massachusetts’ economy stood out as a strong performer across many dimensions during the long expansion of the 2010s. During that period, employment growth (also known as job growth) in the commonwealth ran well above historic rates, ahead of the rest of New England, and on par with the national rate.1 Much of the job growth was in highly productive, high-paying sectors.2 Unemployment was low, and population growth and labor force participation were strong (see Appendix Figures A1, A2, and A3).
The expansion ended with the onset of the COVID-19 pandemic in early 2020, and the Massachusetts economy that has emerged in the aftermath of the crisis looks different from the state’s pre-pandemic economy: Unemployment now matches the US average, and job growth trails the rest of the region and the nation. Changes in the handful of sectors that were largely responsible for the strong growth in the preceding decade have driven this shift in fortunes.
Sign up for new research and data on the New England economy.
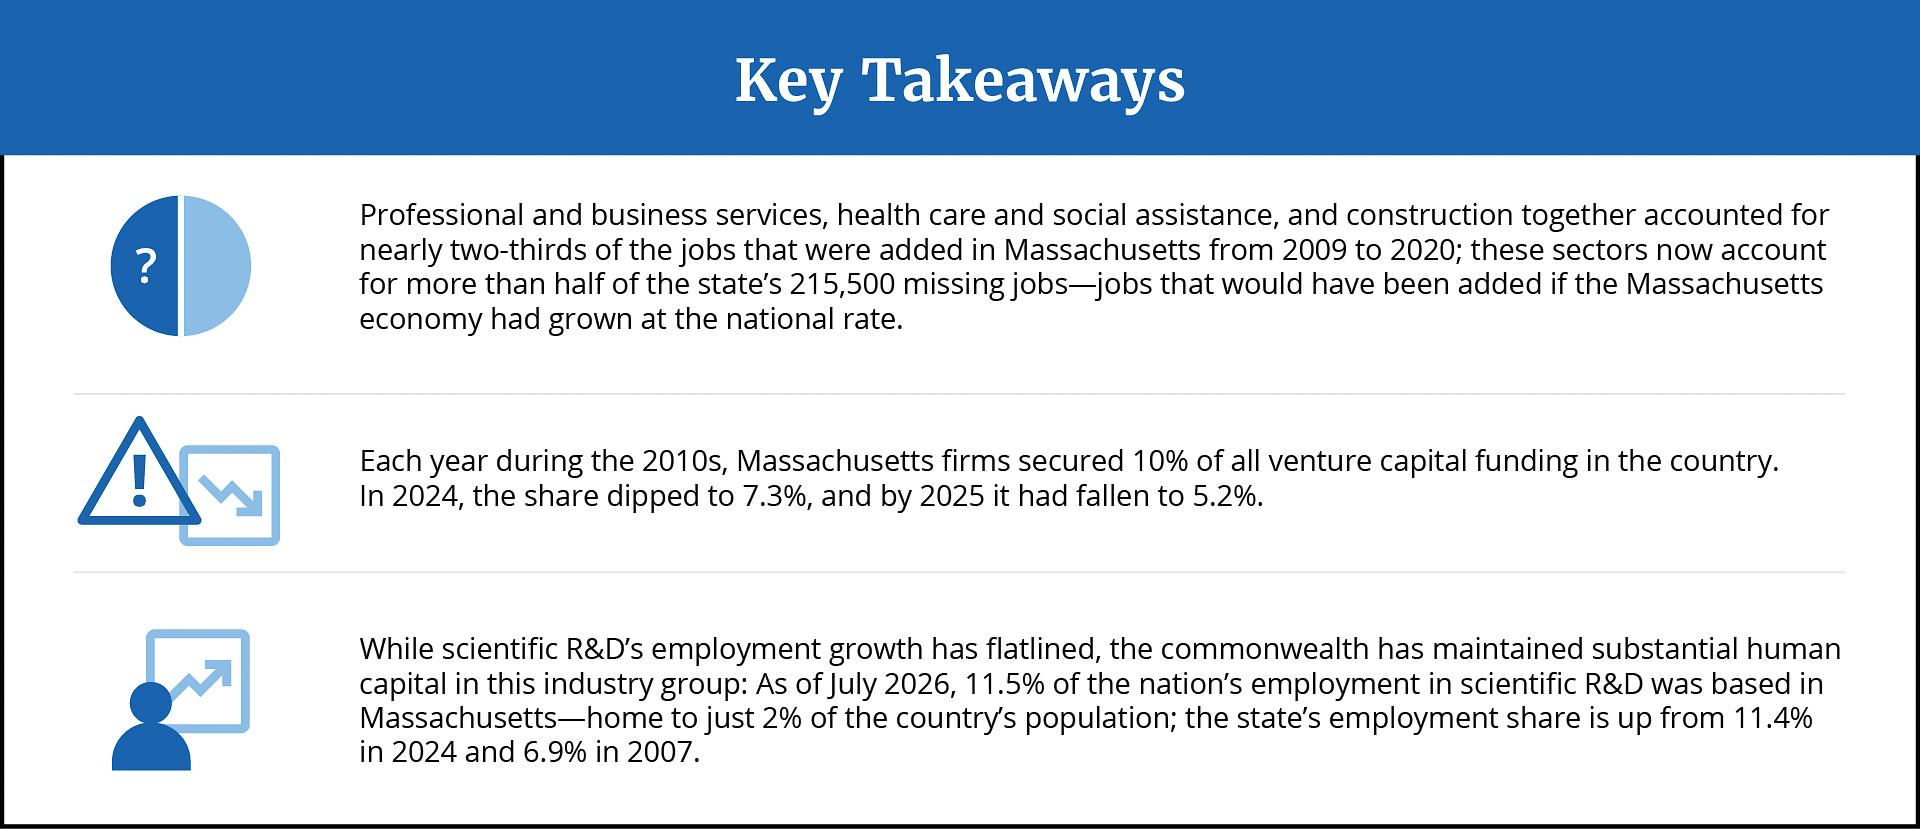
The professional and business services supersector (which comprises three sectors)3 and the health care and social assistance sector, along with related activity in the construction sector, were the main job-creating engines for the state during the 2010s. These sectors accounted for one-third of employment in the state in early 2009, and they were responsible for nearly two-thirds of the jobs that were added from 2009 to 2020.
Since 2022, however, these sectors have either stopped growing or have expanded at a fraction of the national pace. More than half of the commonwealth’s so-called missing jobs—jobs that would have been added if the state’s economic growth had tracked the national rate—are in these sectors. The slowdown is evident beyond employment growth. It appears upstream and downstream from these sectors as reductions in business formation, venture capital funding, and construction of labs and other research facilities.
Documenting these shifts, however, is distinct from speculating about their implications for the commonwealth’s future economic performance. While we do not present an economic forecast in this brief, we do make several observations that suggest the slower growth in professional and business services, health care and social assistance, and construction since mid-2022 is not necessarily a sign of fundamental weaknesses in these sectors. The rates of growth in these sectors during the pre-pandemic expansion and the early phases of the pandemic, for example, were above trend and likely unsustainable over the longer term, particularly given that labor force growth in Massachusetts has been slow in recent years, and the break-even rate of job creation has been hovering around zero.4
Consider, for example, employment growth in scientific research and development, an industry group within the professional, scientific, and technical services sector (which is part of the professional and business services supersector). From January 2020 to July 2023, during the pandemic, employment in scientific R&D establishments grew by 31 percent in Massachusetts, or nearly 50 percent faster than the national rate during this period. This industry group hasn’t grown since mid-2023, but the previous rate of growth was almost certainly not sustainable. Furthermore, despite their slow rates of job growth since the pandemic, the professional, scientific, and technical services sector and the health care and social assistance sector in Massachusetts remain highly productive and competitive relative to their national counterparts (see Appendix Table A1).5
Pressing policy issues with implications for New England’s economy are confronting voters and elected officials. The most prominent of these issues are housing affordability and taxes. The confluence of the recent period of slower growth and these policy issues has given rise to a spirited debate over the business climate and economic competitiveness in the commonwealth. These issues warrant attention and cannot be fully addressed in a brief analysis such as this.
Many of the cost issues being discussed in Massachusetts are also the subject of contentious debates in other parts of the country, especially in places where high-tech employment is heavily concentrated. Housing costs, for example, surged in the Boston metro area following the onset of the COVID-19 pandemic, but the increases were in line with national trends, and costs have since plateaued. Compared with those of other major US high-tech hubs, Boston’s housing costs are in the middle of the pack, and as a share of income, they stand above the US average but not as high above it as they were in the recent past (see Appendix Figures A4.i to A4.iii). Addressing housing affordability—among other issues—is a high priority for a host of reasons, but doing so would not necessarily affect the rate of employment growth in the technology sector.
The dramatic changes in federal research and health care funding policy, which were beyond the control of Massachusetts policymakers, occurred after the slowdown in employment growth had taken hold, but those changes can be expected to complicate a return to growth for the technology and health care sectors in the state and across the country.
Massachusetts’ Rapid Growth of the 2010s Was Not Sustainable
During the 2009–2020 economic cycle, which ultimately became the longest expansion on record, employment growth in Massachusetts outperformed the rate for the rest of New England and the national rate (Figure 1). By January 2020, the state’s employment had increased 14 percent over its January 2007 level (before the 2008–2009 downturn6), compared with growth rates of 11 percent for the nation and just 2 percent for the rest of New England.

Federal Reserve Bank of Boston
In the earliest stages of the COVID-19 pandemic, Massachusetts’ employment was hit harder than other states’, falling 18.4 percent during the initial shutdown phase (February 2020 to April 2020) compared with 14.4 percent nationally and 17.6 percent in the rest of New England. From mid-2020 to mid-2022, however, employment in Massachusetts grew as fast as or faster than the rate for each of the other New England states and the national rate. The latest data (July 2026) indicate that employment in Massachusetts rose 20.7 percent from April 2020 to July 2022, compared with 17.4 percent for the country and 20.1 percent for the rest of New England.7
The latest data also show that starting in mid-2022, Massachusetts employment growth began to lag considerably behind the national rate and the rate for the rest of New England. Since then, the state’s employment has grown at a rate of just 0.6 percent (the slowest of the six New England states) compared with 3.8 percent for the country and 3.0 percent for the rest of New England. Massachusetts (with employment sitting at 99.4 percent of its pre-pandemic level as of July 2026) and Vermont (at 98.2 percent) are the only states in the region that have failed to replace all of their pandemic-era job losses, while the United States has boosted employment 4.5 percent since January 2020. .
Sectors That Drove the Expansion Are Now behind the Malaise
From 2009 to 2020, professional and business services, health care and social assistance, and construction were the key sectors driving Massachusetts’ employment growth (Table 1). These sectors each added jobs at a faster clip than the rest of the country, accounted for a disproportionately large share of total job growth in the state, and, on average, paid higher wages compared with other sectors. Employment in professional and business services in Massachusetts grew a cumulative 26.7 percent over this period, modestly outpacing US employment growth in the supersector for the same period and accounting for nearly 27 percent of all job growth in the state. Health care and social assistance employment also increased at a rate that exceeded the US average, and it provided 29 percent of the state’s job growth. Construction employment expanded by nearly 22 percentage points more than the national average, accounting for 9 percent of new jobs in the state. At the beginning of the 2009–2020 economic cycle, these sectors accounted for one-third of total employment in Massachusetts, and over the ensuing expansion, they provided two-thirds of total job growth.

Federal Reserve Bank of Boston
From 2020 to July 2026, however, employment in each of these sectors in Massachusetts grew substantially more slowly than the national rate. Professional and business services employment grew 4.5 percentage points slower than the US average, while health care and social assistance employment grew 13 percentage points slower, and construction employment grew 5 percentage points slower. All sectors (except for government and private education services) have grown more slowly in Massachusetts than in the rest of the country since 2020, but only a handful account for the lion’s share of the employment-growth gap that has opened between the commonwealth and the country as a whole.
We conduct a counterfactual exercise to identify which sectors have been the greatest drag on employment growth since 2020. We calculate the difference between current (July 2026) employment levels and what employment would have been if each sector in Massachusetts had grown at the national rate for that sector from January 2020 to July 2026. The far-right column of Table 1 shows the results from this exercise: the number of missing jobs in each sector in Massachusetts—jobs that would have been created if each of those sectors had grown at its national rate. Professional and business services, construction, and health care and social assistance together account for more than half of the state’s total of 215,500 missing jobs. Relatively slow growth in the professional, scientific, and technical services sector (part of the professional and business services supersector) and the health care and social assistance sector comprise 53.4 percent of the total jobs shortfall (115,200 of the 215,500 missing jobs) despite accounting for only 27 percent of total employment in the commonwealth (see Appendix Table A2).
In Massachusetts, Health Care and Social Assistance Job Growth Has Slowed Substantially
Nationally, the health care and social assistance sector has added more jobs than any other sector since 2020. Each month, providers of those services have added thousands of jobs, for a cumulative net gain of 15 percent (Figure 2). In Massachusetts, employment growth in the sector has been anemic at just 3 percent since January 2020.

Federal Reserve Bank of Boston
Despite the much slower growth in health care and social assistance employment in recent years, this sector continues to play a larger role in the state’s economy than in the national economy. In July 2026, the sector accounted for 17.7 percent of total employment in Massachusetts but only 15 percent nationally. Looking at sectoral employment in relation to total population, we see that the outsized role of health care and social assistance is longstanding (Figure 2 inset). Since 1990, 5.6 percent or more of the state’s total population has been employed in the sector, compared with 3.7 percent or more nationally. The share increased to 9.1 percent of the Massachusetts population in 2025 compared with 6.8 percent of the national population. (Growth rates have varied widely among the subsectors of the health care and social assistance sector. For details, see Appendix Table A3).
Massachusetts’ White-collar Employment Growth Also Has Slowed
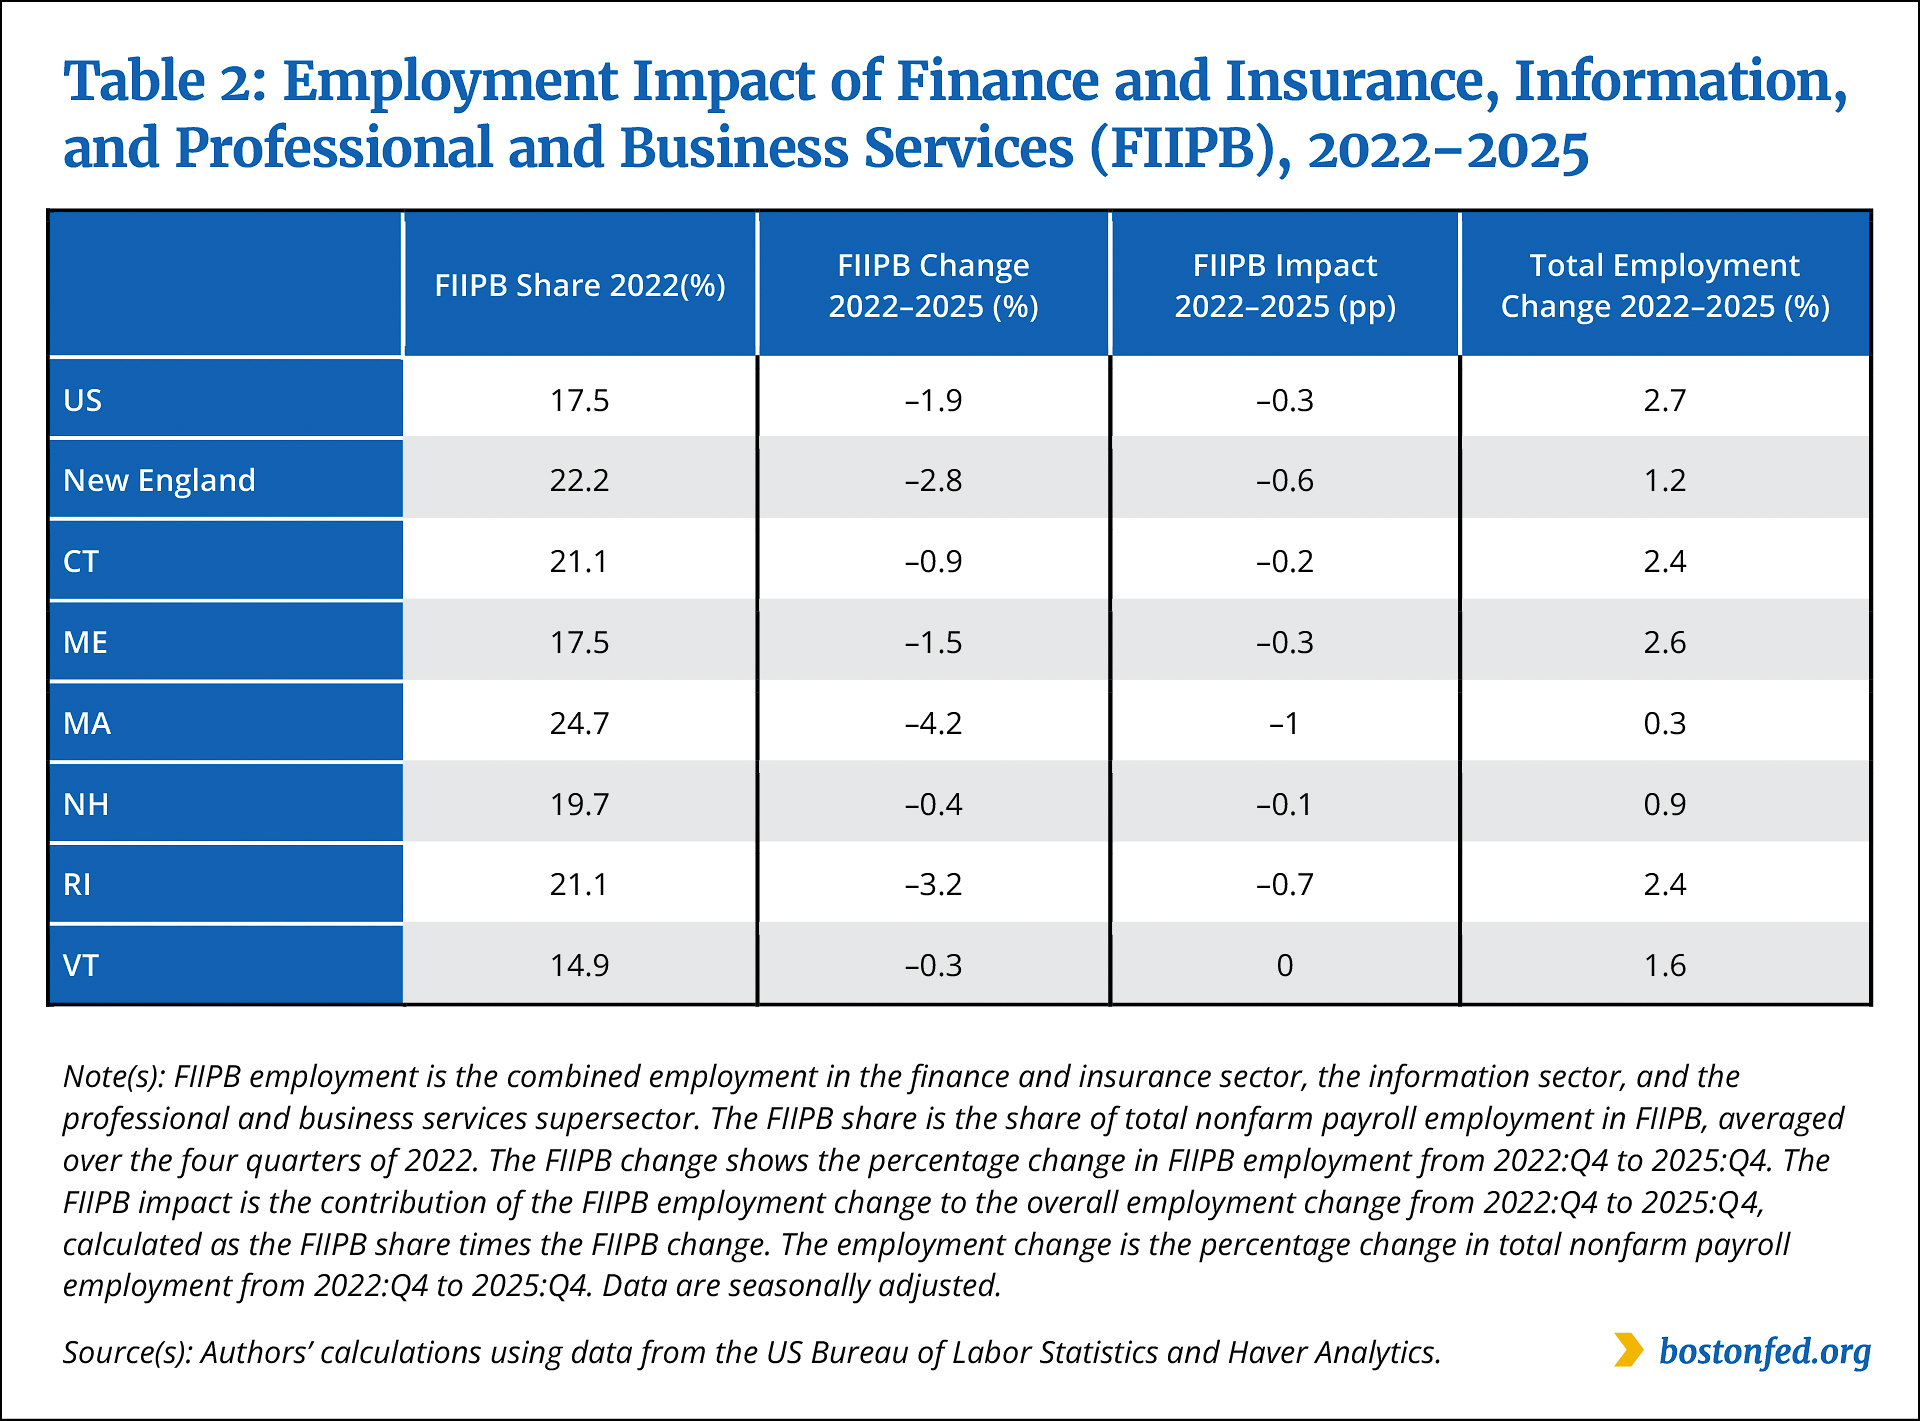
Economic analysts have drawn attention to the generally poor rate of employment growth for white-collar jobs in recent years.8 The number of jobs in finance and insurance, information, and professional and business services (FIIPB) is down nearly everywhere, but those three sectors are particularly important for the commonwealth. FIIPB jobs accounted for nearly 25 percent of total employment in Massachusetts in 2022, which was the largest share among the 50 states (Table 2). The number of FIIPB jobs fell nearly 2 percent nationally from 2022 to 2025 and by more than 4 percent in Massachusetts.
Federal Reserve Bank of Boston
Professional, scientific, and technical services account for a large share of white-collar jobs in Massachusetts. From January 2007 to January 2020, employment in that sector of the professional and business services supersector grew by 43 percent in Massachusetts, compared with 28 percent nationally (the solid lines in Figure 3). Employment briefly dipped in the first few months of the pandemic (by 4.0 percent in Massachusetts and 5.6 percent nationally) but had resumed growing at a rapid pace by May 2020. The sector’s employment was up another 11.3 percent in Massachusetts by August 2022 and 15.3 percent nationally. August 2022 marked a turning point for professional, scientific, and technical services in the commonwealth. From then until July 2026, employment in the sector tumbled 5.4 percent in the state. Nationally, the sector’s employment growth slowed following the summer of 2022 and has been flat since the summer of 2023.

Federal Reserve Bank of Boston
In the narrower scientific research and development services industry group within the professional, scientific, and technical services sector, growth was particularly robust during the pandemic period and immediately afterward. Massachusetts employment in this industry group rose 31 percent from January 2020 to July 2023, far exceeding the national average growth rate of 23 percent during this period. Scientific R&D employment peaked in July 2024 and has since declined 0.8 percent, compared with a 1.4 percent decline nationally.
Although this industry group is relatively small in Massachusetts, employing just 105,900 workers, those workers are highly compensated, earning average annual wages of $246,000 in 2024. And, while scientific R&D’s employment growth has flatlined, the commonwealth’s human capital in this industry group remains substantial. As of July 2026, 11.5 percent of the nation’s employment in this subsector was based in Massachusetts—home to just 2 percent of the country’s population. Firms in Massachusetts employed 6.9 percent of the country’s scientific R&D workers in January 2007 and 11.4 percent in July 2024.
Effects Flowing Upstream to and Downstream from the Innovative Sectors
The impact of the changing conditions confronting Massachusetts’ innovative sectors—a broad term referring to science, technology, and health-related research industries and firms—extends beyond direct employment to venture capital funding and the construction of research facilities.
Each year during the long expansion of the 2010s, Massachusetts firms regularly secured 10 percent of all the venture capital funding in the country (Figure 4, Panel A). In 2024, the share dipped to 7.3 percent, and by 2025 it had fallen to 5.2 percent. Massachusetts firms’ share of the total number of venture capital deals remained steady, fluctuating around 6 percent during the 2016–2025 period.

Federal Reserve Bank of Boston
The funding secured by high-tech and research-focused firms coincided with substantial increases in employment in the state’s innovative sectors and in the construction of labs and other research facilities. Each year from 2008 to 2025, Massachusetts firms were responsible for more than 10 percent of all construction of research facilities in the nation (Figure 4, Panel B). The state’s share of national research-facility construction surged to 30 percent or larger each year from 2020 through 2023. After 2023, such construction dropped sharply in the state, and by 2025, Massachusetts’ share of research-facility construction was back to 10 percent.
The decline had notable spillover effects on construction employment in Massachusetts, but the state’s elevated share of national research-facility construction was not sustainable. Furthermore, the labs and other research facilities that were built in the state generally remain active, and while the state’s shares of national venture capital dollars and research-facility construction have fallen to 5 percent and 10 percent, respectively, Massachusetts, as noted earlier, is a relatively small state. Given that it accounts for only 2 percent of the country’s population, it continues to draw disproportionately large shares of the nation’s innovation economy resources and produce at a high level.
In recent years, data centers have become a major source of private nonresidential construction. According to US Census Bureau data, from late 2025 through June 2026, the value of data-center construction nationally ($68 billion) exceeded that of all general office construction ($44 billion). The year-over-year changes in value during that period were 43 percent for data-center construction and –12 percent for general office construction.
Due to New England’s combination of regulatory factors and relatively higher costs of land and energy, a very small share of the country’s data-center construction has taken place in the region. Compared with research facilities, data centers produce larger numbers of construction jobs, but they have more modest long-run effects on employment growth, and they are currently the subject of political wrangling, as communities seek moratoriums to prevent the construction of these facilities (Bahar and Wright 2026).
Despite Slow Growth, Innovative Sectors’ Strengths Persist
The slow rate of job growth in Massachusetts in the post-pandemic era has been a disconcerting development that has driven considerable discussion among policymakers. While attention to the relatively slow growth among the state’s key innovative sectors is warranted, we should not lose sight of their persistent strengths. Employment growth stalled in these sectors in mid-2023, but employment levels remain well above the 2020 counts. The vast majority of scientists, researchers, technologists, and innovative firms that drove the economic expansion in Massachusetts in the 2010s have remained in the state. For many of those firms, labor supply, rather than the state’s overall business climate, is the key obstacle to employment growth.
Key pillars of the region’s innovation economy have been challenged, most notably higher education. Like higher-education institutions across the nation, New England’s colleges and universities have been adversely affected by demographic shifts, curtailed immigration, reductions and volatility in federal research funding, and the implementation of a new federal tax on endowments. As a result of these factors, many institutions have cut faculty and staff, limited enrollment in some graduate programs or eliminated them, and seen a reduction in international students. Compared with institutions in other parts of the country, however, the core research universities in New England remain fundamentally healthy (Kelchen, Ritter, and Webber 2025). Forty-three percent of the colleges and universities in the commonwealth are considered “high capacity” based on institutional strength and student success, compared with just 31 percent nationally.9
It is widely anticipated that more colleges will close in the coming years, but the closures will likely involve smaller and less-resourced institutions primarily. The research universities that are integral to the region’s high tech and health care sectors remain financially sound. Despite the disruptions and real cuts to National Institutes of Health research grants after 2024, awarded funding in 2026 (through July) was up 7 percent nationally over the 2025 level, and Massachusetts-based institutions remain recipients of the largest grants—expressed in per capita terms—among all states. 10
Moreover, even if the rate of employment growth from the 2010s economy does not return, Massachusetts has demonstrated that it can still maintain high levels of productivity, and in the current low-labor-force-growth environment, the employment growth we are experiencing is sufficient for Massachusetts to sustain low unemployment.
Endnotes
- The employment data we analyze come from the Bureau of Labor Statistics (BLS) Current Employment Statistics (CES, also known as the establishment survey). The BLS measures employment growth by the monthly net increase in the number of employees on nonfarm payrolls.
- When collecting employment data, the BLS uses the North American Industry Classification System (NAICS), which classifies establishments (businesses) into a hierarchical structure of sectors, subsectors, industry groups, and industries based on their principal product or activity. The BLS also aggregates data from multiple sectors to provide employment information on supersectors, which include professional and business services.
- The professional and business services supersector includes three NAICS sectors: professional, scientific, and technical services; management of companies and enterprises; and administrative and support and waste management and remediation services.
- Estimation of breakeven employment growth (the number of jobs necessary to prevent unemployment from rising) is maintained at https://npetroskynadeau.github.io/data.html#breakeven-payrolls. This analysis is based on research presented in Petrosky-Nadeau and Stewart (2024).
- Output per worker in the professional, scientific, and technical services sector for Massachusetts has consistently been higher than for every other state, but in the most recent data, the state’s ratio of worker compensation to GDP for that sector is ranked 30th among all states plus the District of Columbia.
- During the 2008–2009 deep downturn (from April 2008 to October 2009), nonfarm employment in the commonwealth dipped 4.3 percent, compared with 5.8 percent nationally and 5.2 percent in the rest of New England.
- Data released in July 2022, which were subsequently revised downward, suggested much stronger growth in the commonwealth (see Appendix Figure A5). Over the four rounds of annual benchmark revisions since then, Massachusetts had the third-largest downward revision in the country.
- See Gad Levanon, “California’s White-collar Contraction,” Labor Matters, March 21, 2026.
- This finding comes from Saunders (2026), who classifies institutional resilience based on a range of factors including endowment per student, revenue diversification, enrollment trajectory, selectivity, completion rate, graduates’ earnings-to-debt ratio, exposure to AI, and regional demographic trends.
- According to data tracked by the NIH Reporter, after falling sharply in 2025, research dollars awarded in 2026 are rising. The dollar value of NIH Extramural Awards (cumulative awards through July of each year) fell 14 percent from 2023 to 2025 (dropping from $25.9 billion to $22.2 billion) but rose 7 percent from 2025 to 2026 (climbing back to $23.7 billion).
References
Bahar, Dany, and Greg Wright. 2026. “New Evidence on Data Center Employment Effects.” Brookings Institution.
Kelchen, Robert, Dubravka Ritter, and Douglas Webber. 2025. “Predicting College Closures and Financial Distress.” Finance and Economics Discussion Series 2025-003. Washington: Board of Governors of the Federal Reserve System.
Petrosky-Nadeau, Nicolas, and Stephanie A. Stewart. 2024. “Breakeven Employment Growth.” Federal Reserve Bank of San Francisco FRBSF Economic Letter 2024-18.
Saunders, Kyle. 2026. “Mapping the Structural Divide: Institutional Resilience, Post-college Market Position, and Artificial Intelligence Exposure across U.S. Higher Education.” Working paper.

 About the Authors
Riley Sullivan,
Federal Reserve Bank of Boston
Riley Sullivan is the lead policy analyst with the New England Public Policy Center in the Federal Reserve Bank of Boston Research Department.
Email: riley.sullivan@bos.frb.org
Jeffrey P. Thompson,
Federal Reserve Bank of Boston
Jeffrey P. Thompson is a vice president and economist in the Federal Reserve Bank of Boston Research Department, where he is the director of the New England Public Policy Center.
Email: jeffrey.thompson@bos.frb.org
Acknowledgments
Resources
Site Topics
Keywords
- NEPPC Regional Brief ,
- Massachusetts ,
- employment growth ,
- innovative sectors ,
- health-care sector ,
- white-collar jobs