Transitory or Persistent? What the Frequency of Price Changes May Tell Us about Inflation 


Michael Konstansky/Federal Reserve Bank of Boston
The views expressed herein are solely those of the authors and should not be reported as representing the views of the Federal Reserve Bank of Boston, the principals of the Board of Governors, or the Federal Reserve System.
Understanding whether inflation pressures are transitory or persistent is central to shaping effective monetary policy. If policymakers deem the pace of price changes to be transitory, they may choose to wait out the episode. But if they judge the current inflation rate to indicate a more persistent trend, then they may need to respond quickly and aggressively to prevent the de-anchoring of inflation expectations, a situation in which households and/or businesses anticipate that prices will persistently deviate from the Federal Reserve’s target rate, potentially leading to a wage–price spiral and broader economic instability.1
A key challenge for policymakers is that the shocks driving inflation are not observable in real time. Therefore, policymakers cannot directly determine whether the observed inflation reflects a temporary disruption, such as a supply glitch, or a shift that is likely to endure, such as wages rising across the economy.
Policymakers must instead infer the nature of inflation using indirect signals. Common approaches include analyzing different measures of inflation, such as core inflation, which excludes the volatile food and energy components to provide a smoother signal, or trimmed-mean inflation and median inflation, each of which strips out extreme price changes that might reflect idiosyncratic or temporary factors. Policymakers also use structural models to break down, or decompose, inflation into demand- and supply-driven components and estimate the persistence of those components. In addition, they may analyze inflation among goods versus services separately or study further disaggregated categories within goods and services to determine whether inflation is concentrated in specific categories or is broad based.2
Sign up for Research Department Updates.
We present a complementary approach to detecting these signals based on the inflation patterns among goods and services (or “products”) in the Consumer Price Index (CPI) that change prices at different frequencies. By distinguishing between the dynamics of frequently and infrequently adjusted prices, we can gain insight into the nature of inflation—whether inflation pressures are new and transitory or sustained and spreading.
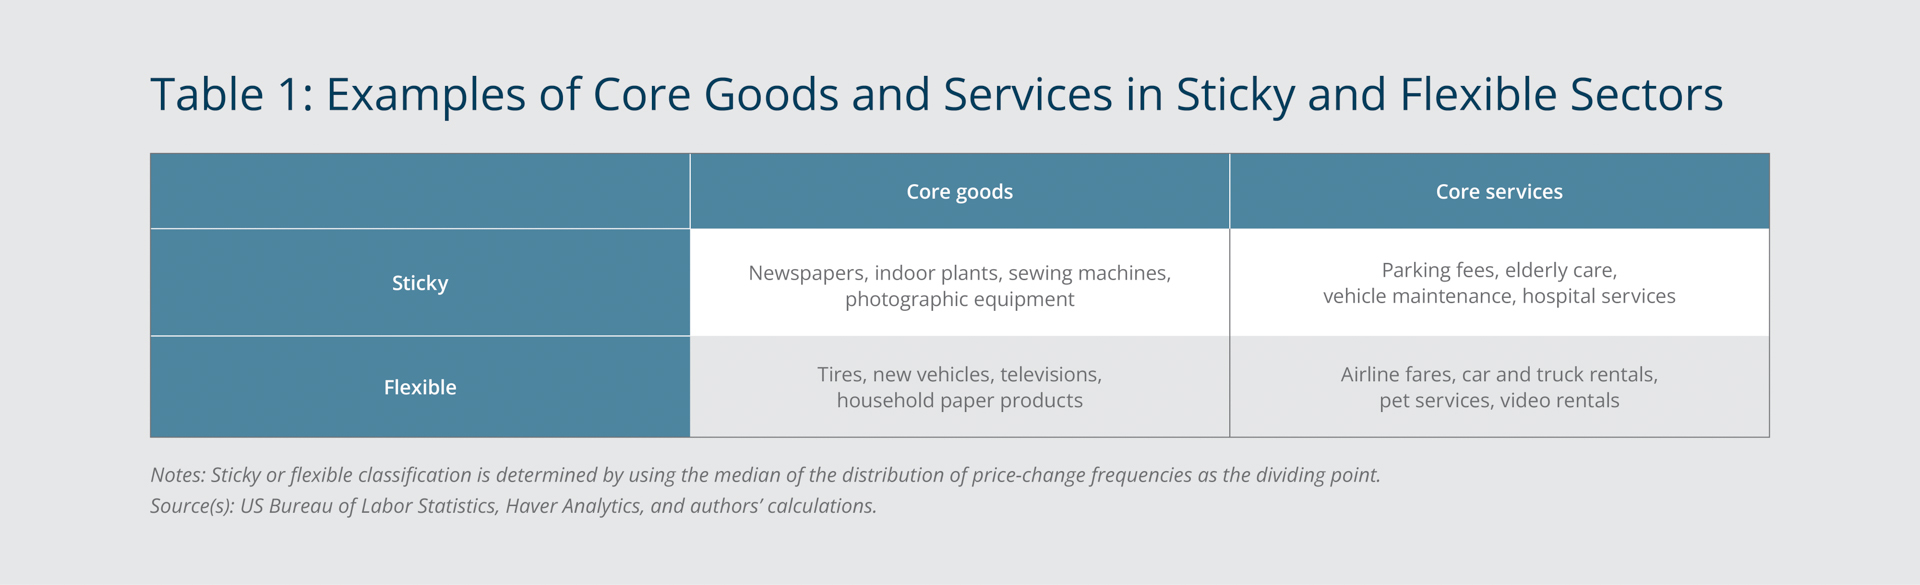
The CPI tracks the prices of products consumed by an average US household. We decompose the non-rent portion of the CPI into two subindexes, one for products that change prices frequently—the flexible sector (for example, new vehicles and airline tickets)—and one for products that change prices infrequently—the sticky sector (for example, newspapers and elderly care). Then we look at the patterns of changes in each index since 1998.
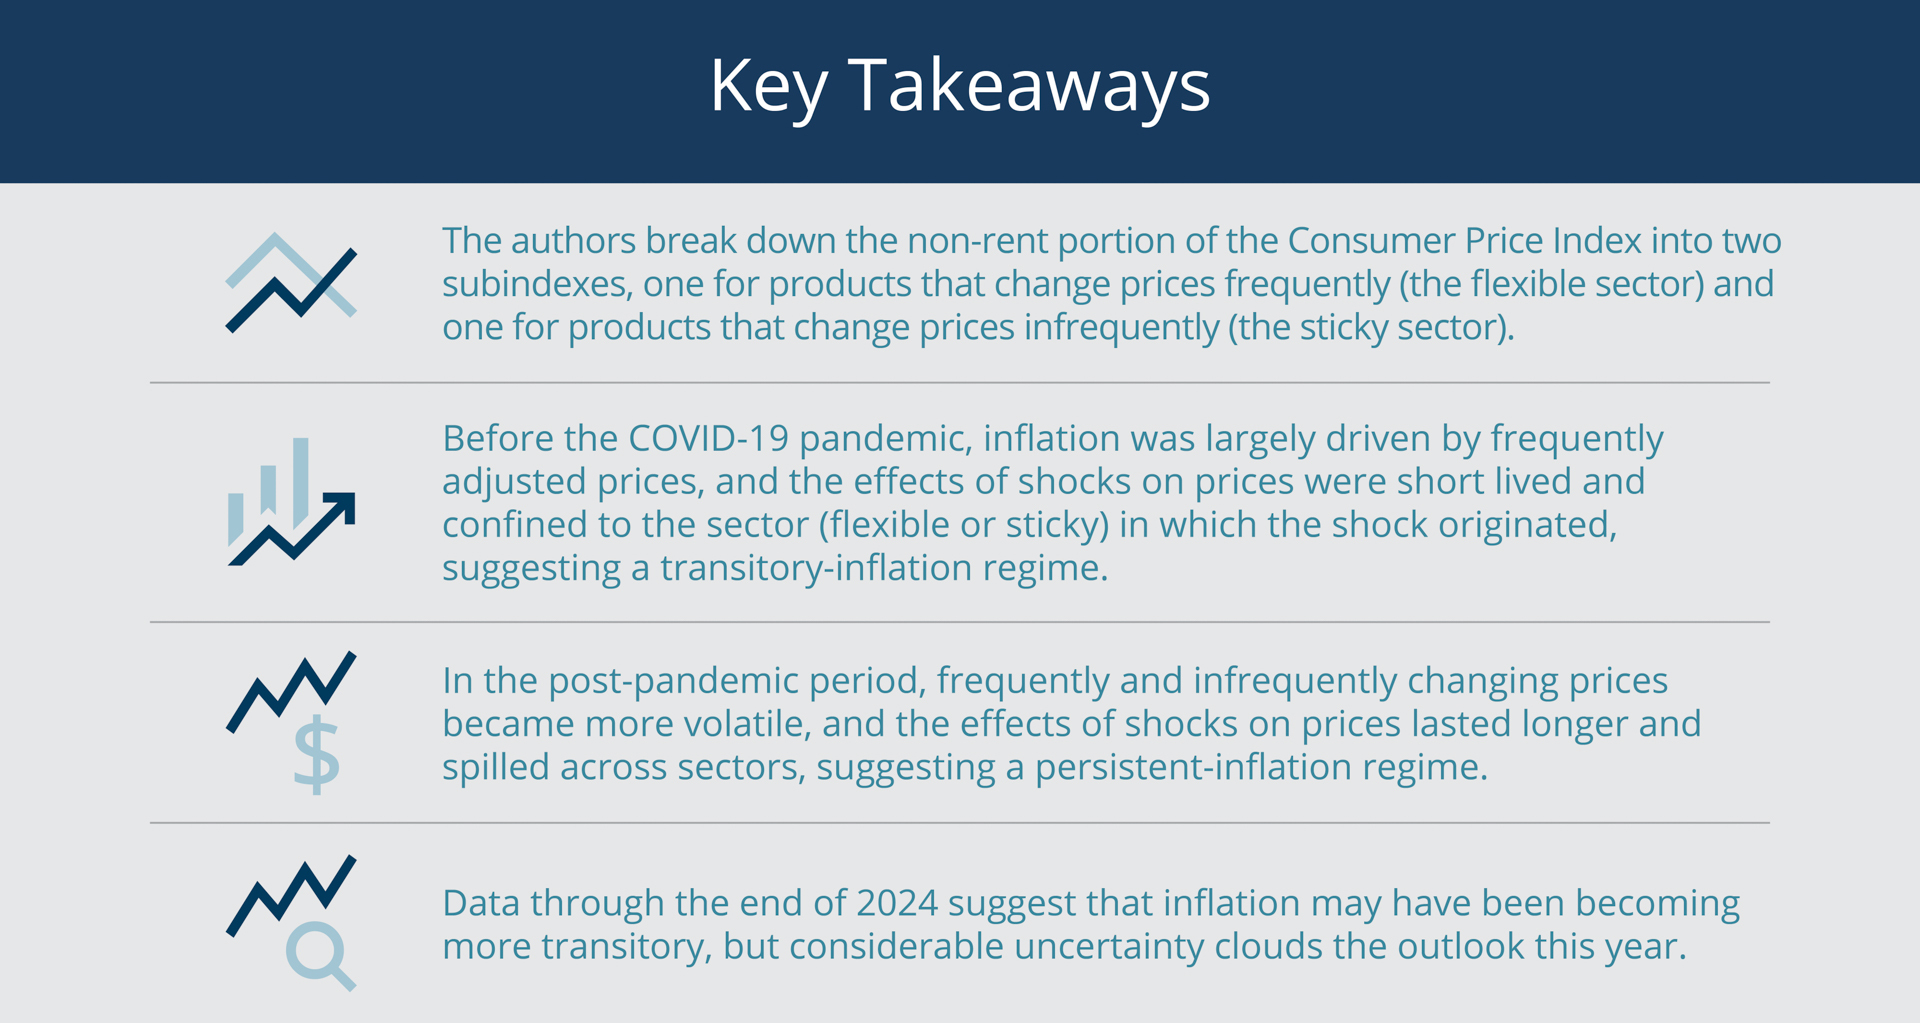
Our study produces three main findings. First, over the two decades preceding the COVID-19 pandemic, inflation was largely driven by frequently adjusted prices, and the effects of shocks on prices were short lived and confined to the sector (flexible or sticky) in which the shocks originated, suggesting a period, or regime, of transitory inflation. Second, in the post-pandemic period of January 2020 through February 2025, frequently and infrequently changing prices both became more volatile, and the effects of shocks on prices lasted longer and spilled across sectors, suggesting a persistent-inflation regime. Third, recent data suggest that we may be returning to a regime in which inflation is more transitory. However, considerable uncertainty remains.
Flexible versus Sticky Consumer Prices
We use confidential US Bureau of Labor Statistics (BLS) microdata on the prices of products (excluding rents) tracked by the CPI to divide them into those that have flexible prices and those that have sticky prices based on how frequently their prices changed from month to month over the period of January 2020 to July 2024.3 A “product” in the microdata is defined as a good or service sold at or offered by a particular business in a particular location. For example, a 12-ounce can of Diet Coke sold at the Target in Central Square in Cambridge, Massachusetts, would be a product.
We split the products into two sectors—flexible and sticky—using the median of the distribution of price-change frequencies as the dividing point.4 Products that change prices more often than the median frequency comprise our flexible sector, and those that change prices less often comprise our sticky sector.5 We similarly divide the products tracked by the core CPI, which excludes food and energy products. Table 1 provides examples of core goods and services in each of the two sectors.
Michael Konstansky/Federal Reserve Bank of Boston
To construct the flexible and sticky CPI inflation series shown in Figure 1, we compute a weighted average of the inflation rate of the products in each of the two sectors. A product’s inflation rate is weighted according to how much consumers spend on that product relative to the other products tracked by the CPI.
It is worth noting that the classification of products as flexible versus sticky is distinct from their classification as goods versus services, even though goods, on average, change prices more frequently than services. Not surprisingly, goods comprise 60 percent of the flexible CPI and 56 percent of the flexible core CPI. However, goods also account for 55 percent of the sticky CPI and 35 percent of the sticky core CPI.
Inflation Volatility in the Post-pandemic Period
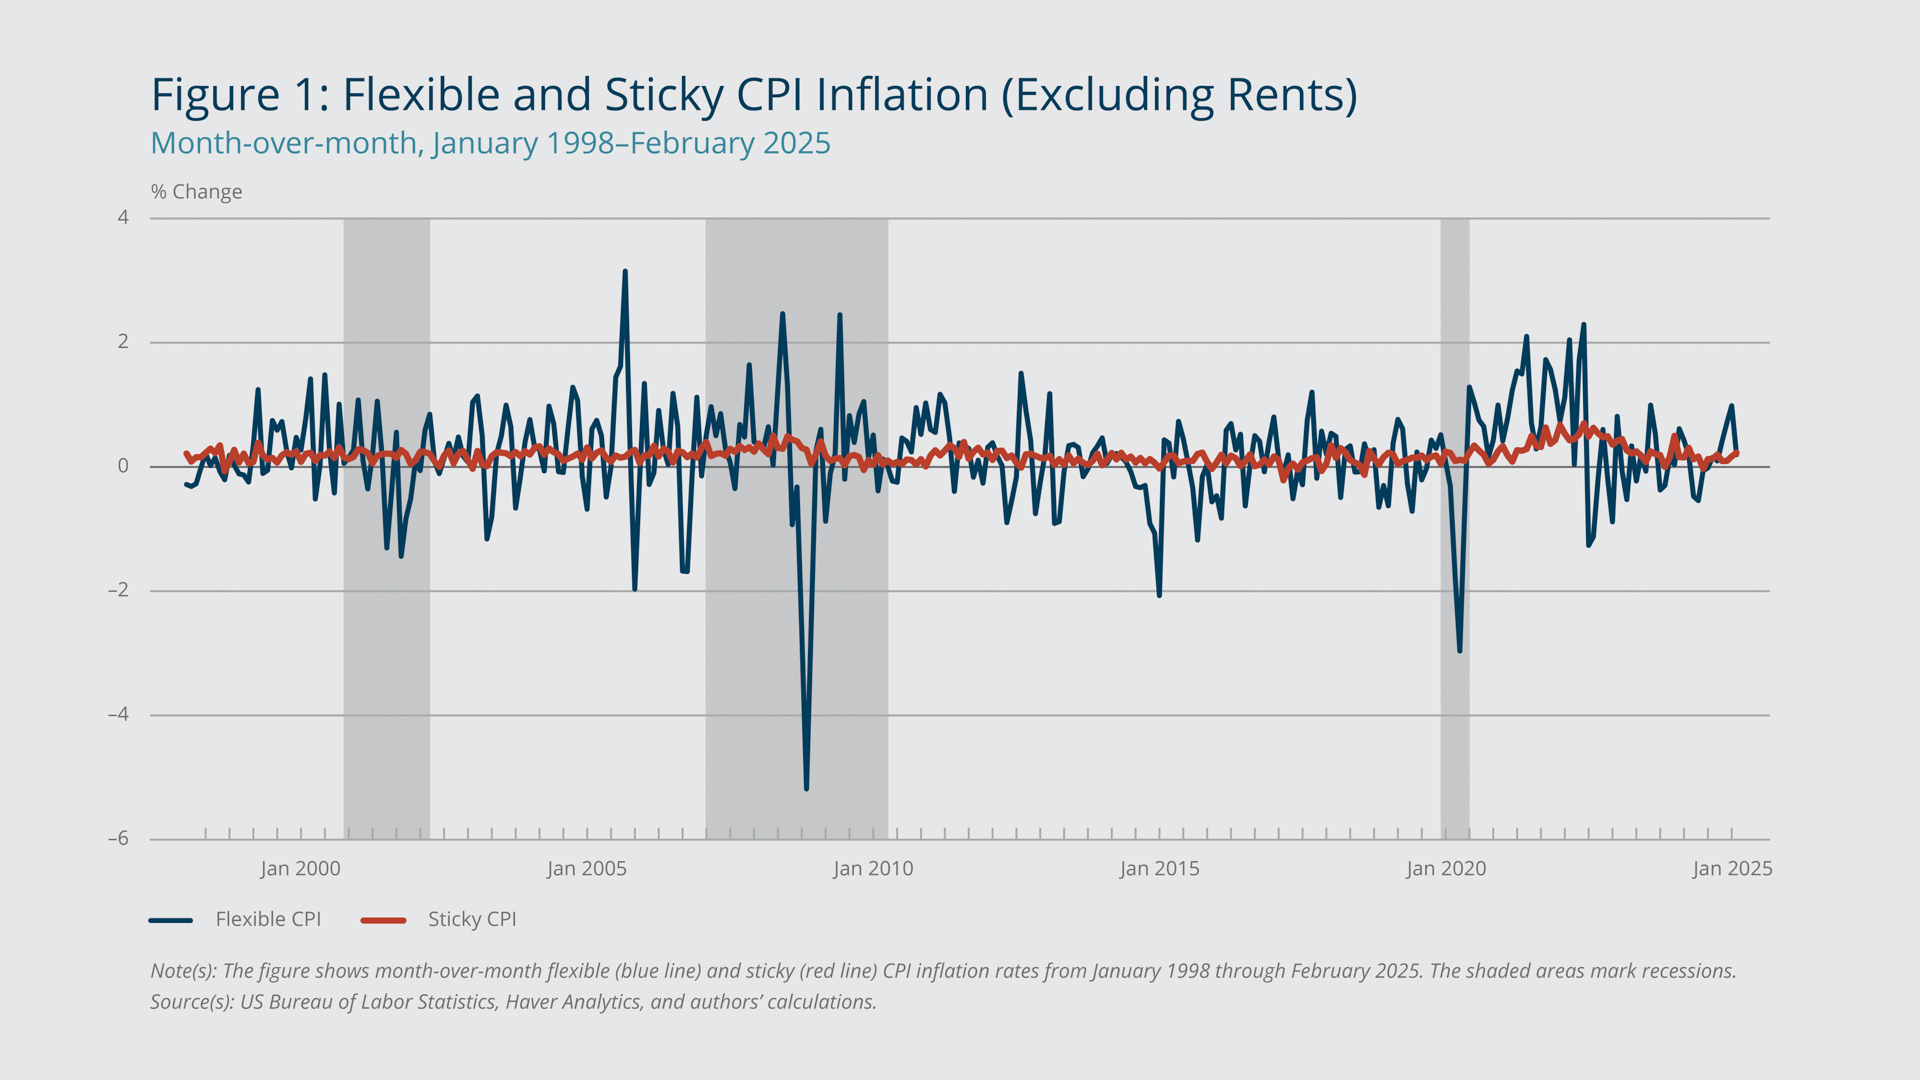
The patterns involving flexible prices and sticky prices suggest that inflation was not widespread in the years leading up to the pandemic, but after 2020, it became more volatile and spread more broadly across the distribution of products with different price-change frequencies.
Figure 1 shows month-over-month flexible (blue line) and sticky (red line) CPI inflation rates since 1998. In the pre-pandemic sample (1998 through 2019), inflation was primarily driven by movement in flexible prices. While the mean month-over-month inflation rates for the flexible and sticky CPIs were both 0.16 percent, the standard deviation of flexible CPI inflation—the degree to which it varied from its average value over the sample period—was eight times higher than it was for sticky CPI inflation (0.8 percentage point versus only 0.1 percentage point), meaning that flexible prices were eight times more volatile than sticky prices. This gap highlights how overall price changes were dominated by frequently adjusted prices, while infrequently adjusted prices remained largely stable.
Michael Konstansky/Federal Reserve Bank of Boston
By contrast, during the post-pandemic period (January 2020 through February 2025), the mean and volatility of both inflation series were higher, but relative to the pre-pandemic period, the volatility was particularly higher for sticky CPI inflation. The mean flexible and sticky CPI inflation rates were 0.4 percent and 0.3 percent, respectively. The standard deviation of sticky CPI inflation was 70 percent higher than it was in the pre-pandemic period, while the volatility of the flexible CPI rose only 25 percent. This shift indicates that frequently and infrequently adjusted prices both contributed to inflation in the post-pandemic period.
The sticky and flexible core CPI inflation series display dynamics similar to those of the sticky and flexible CPI inflation series, indicating that the post-pandemic volatility was broad based and not driven by just the traditionally volatile food and energy components, which, as noted, are excluded from core inflation. In fact, when we split these sectors further into quartiles based on the 25th, 50th, and 75th percentiles of the price-change-frequency distribution, all quartiles show elevated volatility in the post-pandemic period, including the quartile comprising products with the stickiest prices.
Effects of Price Shocks in the Post-pandemic Period
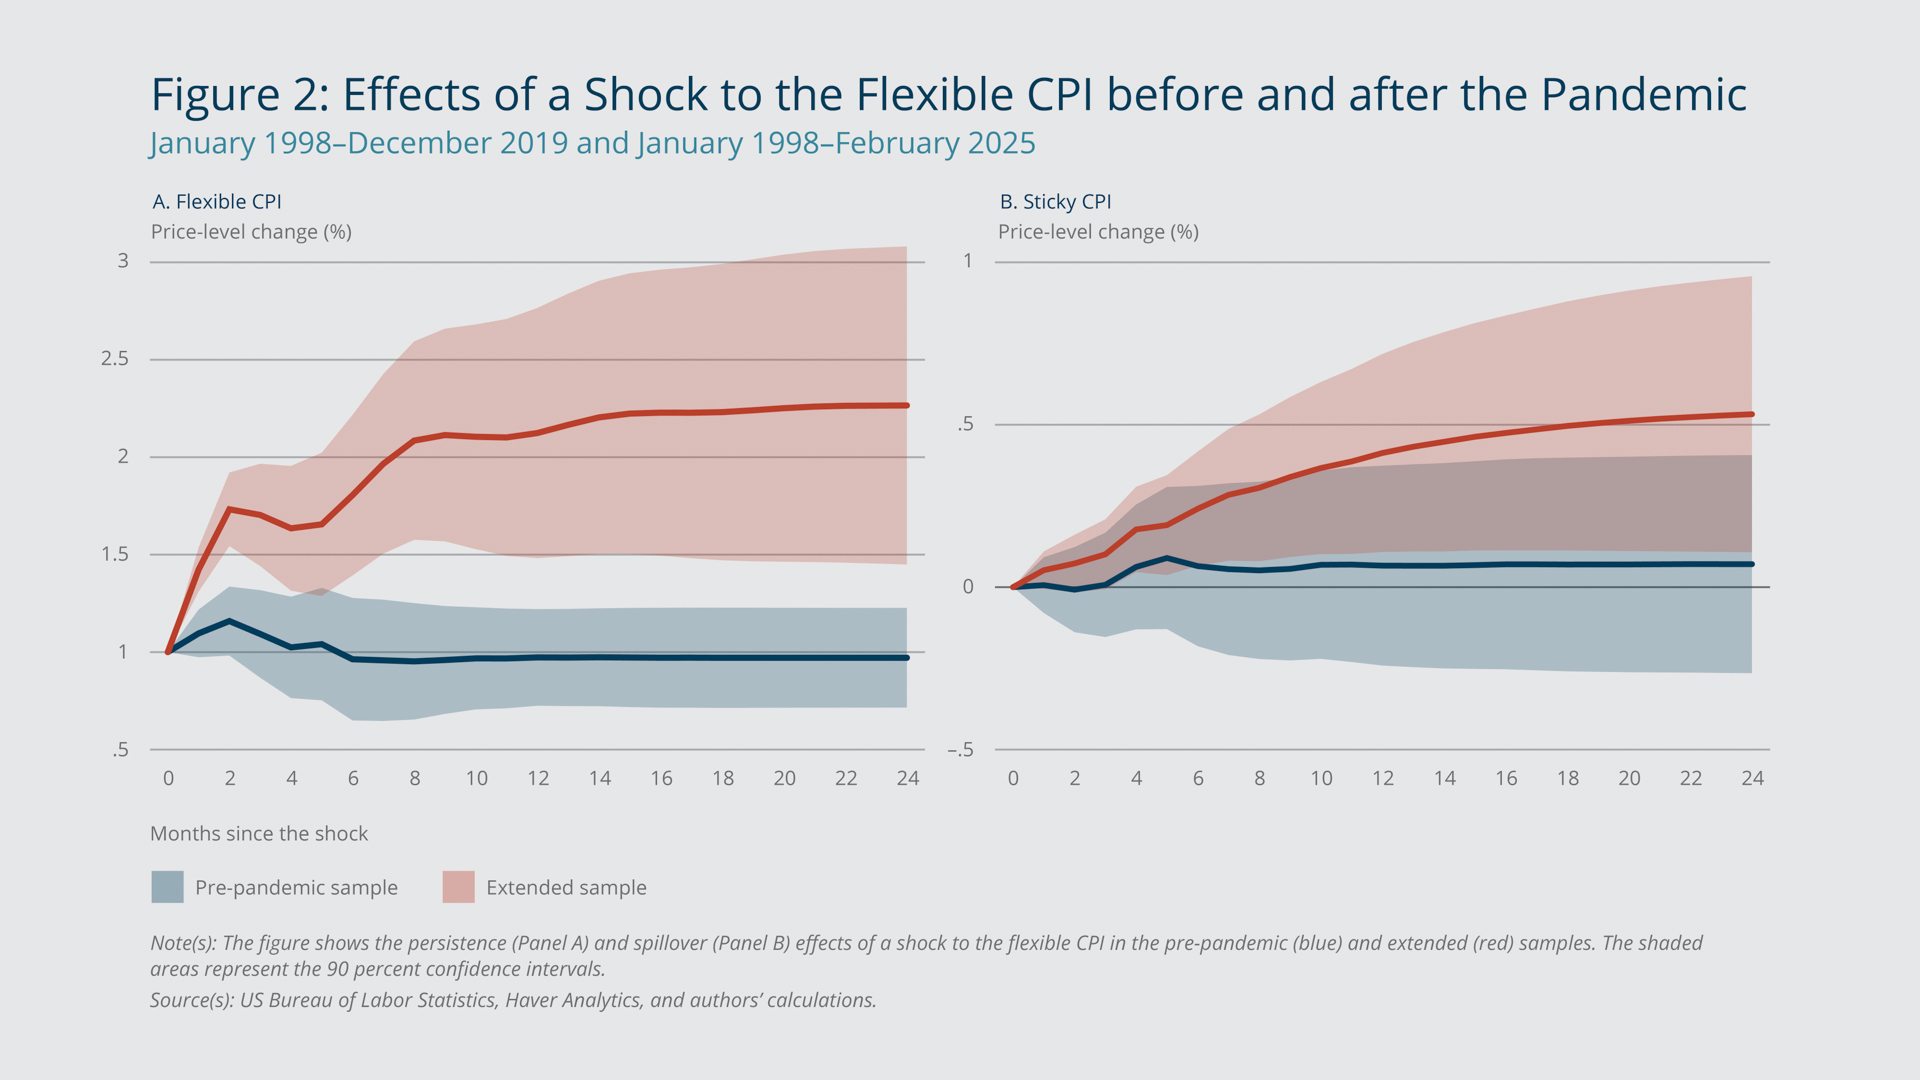
When we analyze the persistence of inflation and the degree of spillover using regression analysis, we obtain further evidence that effects of price shocks have been more sustained and more widely spread in the post-pandemic period than in the years leading up to it. For this analysis, we assume that a shock to the sticky CPI can contemporaneously affect the flexible CPI, while a shock to the flexible CPI has a delayed effect on the sticky CPI. The latter assumption reflects the tendency of sticky-price businesses to adjust their prices slowly, by definition. See the appendix for details on our regression analysis.
We estimate how a 1 percentage point unexpected one-time increase in either the flexible or sticky CPI would affect the sticky CPI and the flexible CPI over time, comparing the results for the pre-pandemic period (January 1998 through December 2019) with the results for the extended sample including the post-pandemic period (January 1998 through February 2025). Figure 2 shows the persistence (Panel A) and spillover effects (Panel B) of a shock to the flexible CPI in the pre-pandemic sample (blue) and in the extended sample (red). The shaded areas represent the 90 percent confidence intervals—the range within which we are reasonably confident the true value lies. In the pre-pandemic period, a shock to the flexible CPI would produce a small, short-lived spike in the flexible CPI; the effect would fade within two months. The sticky CPI would rise only slightly and only after a four-month delay, indicating limited persistence and a minimal spillover. In the extended sample, a flexible-CPI shock would lead to a larger and more sustained rise in the flexible CPI. The sticky CPI would respond faster and somewhat more strongly, suggesting greater persistence and a larger spillover.
Michael Konstansky/Federal Reserve Bank of Boston
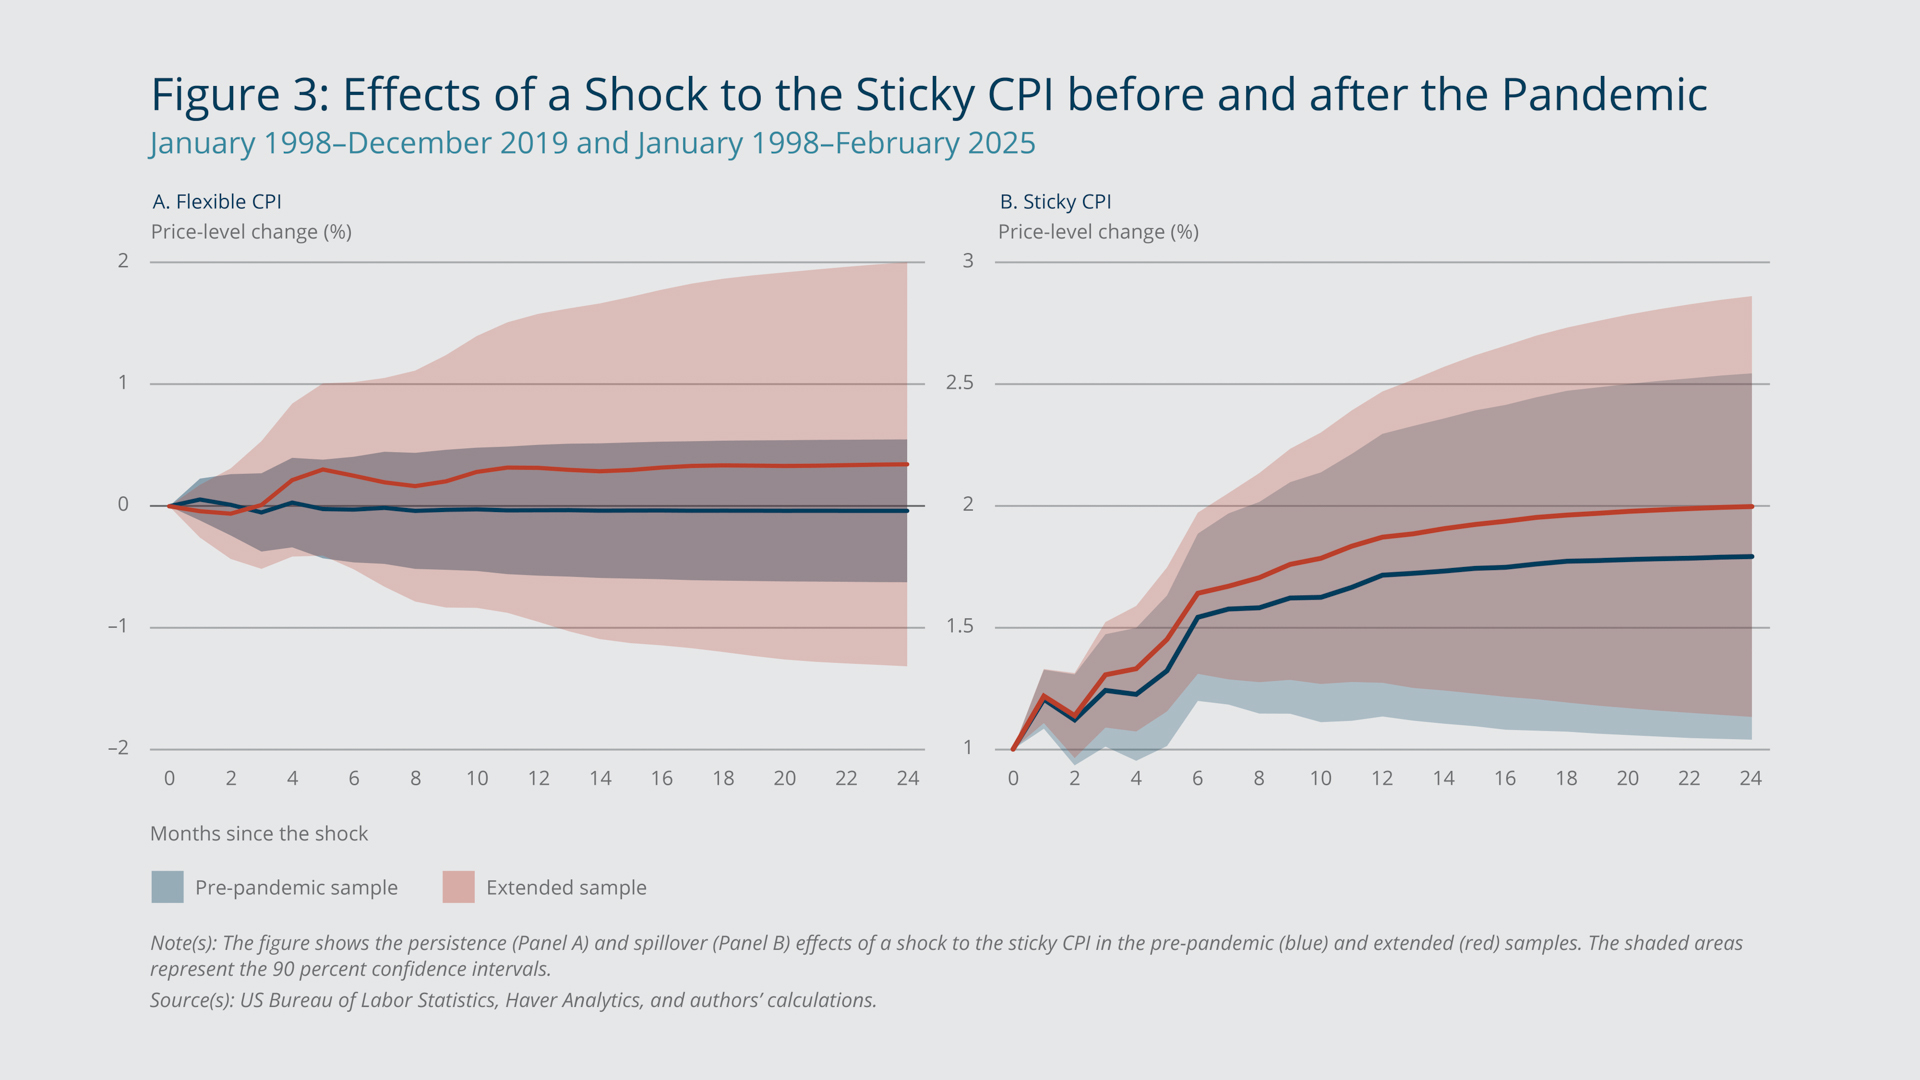
Figure 3 shows the results of the corresponding analysis for a shock to the sticky CPI. In the pre-pandemic period, the effect on the flexible CPI would be muted and short lived, and the sticky CPI would rise gradually over time. By contrast, in the extended sample, the flexible CPI and the sticky CPI both would rise sharply and steadily, indicating, as with the shock to the flexible CPI, greater persistence and a larger spillover.6
Michael Konstansky/Federal Reserve Bank of Boston
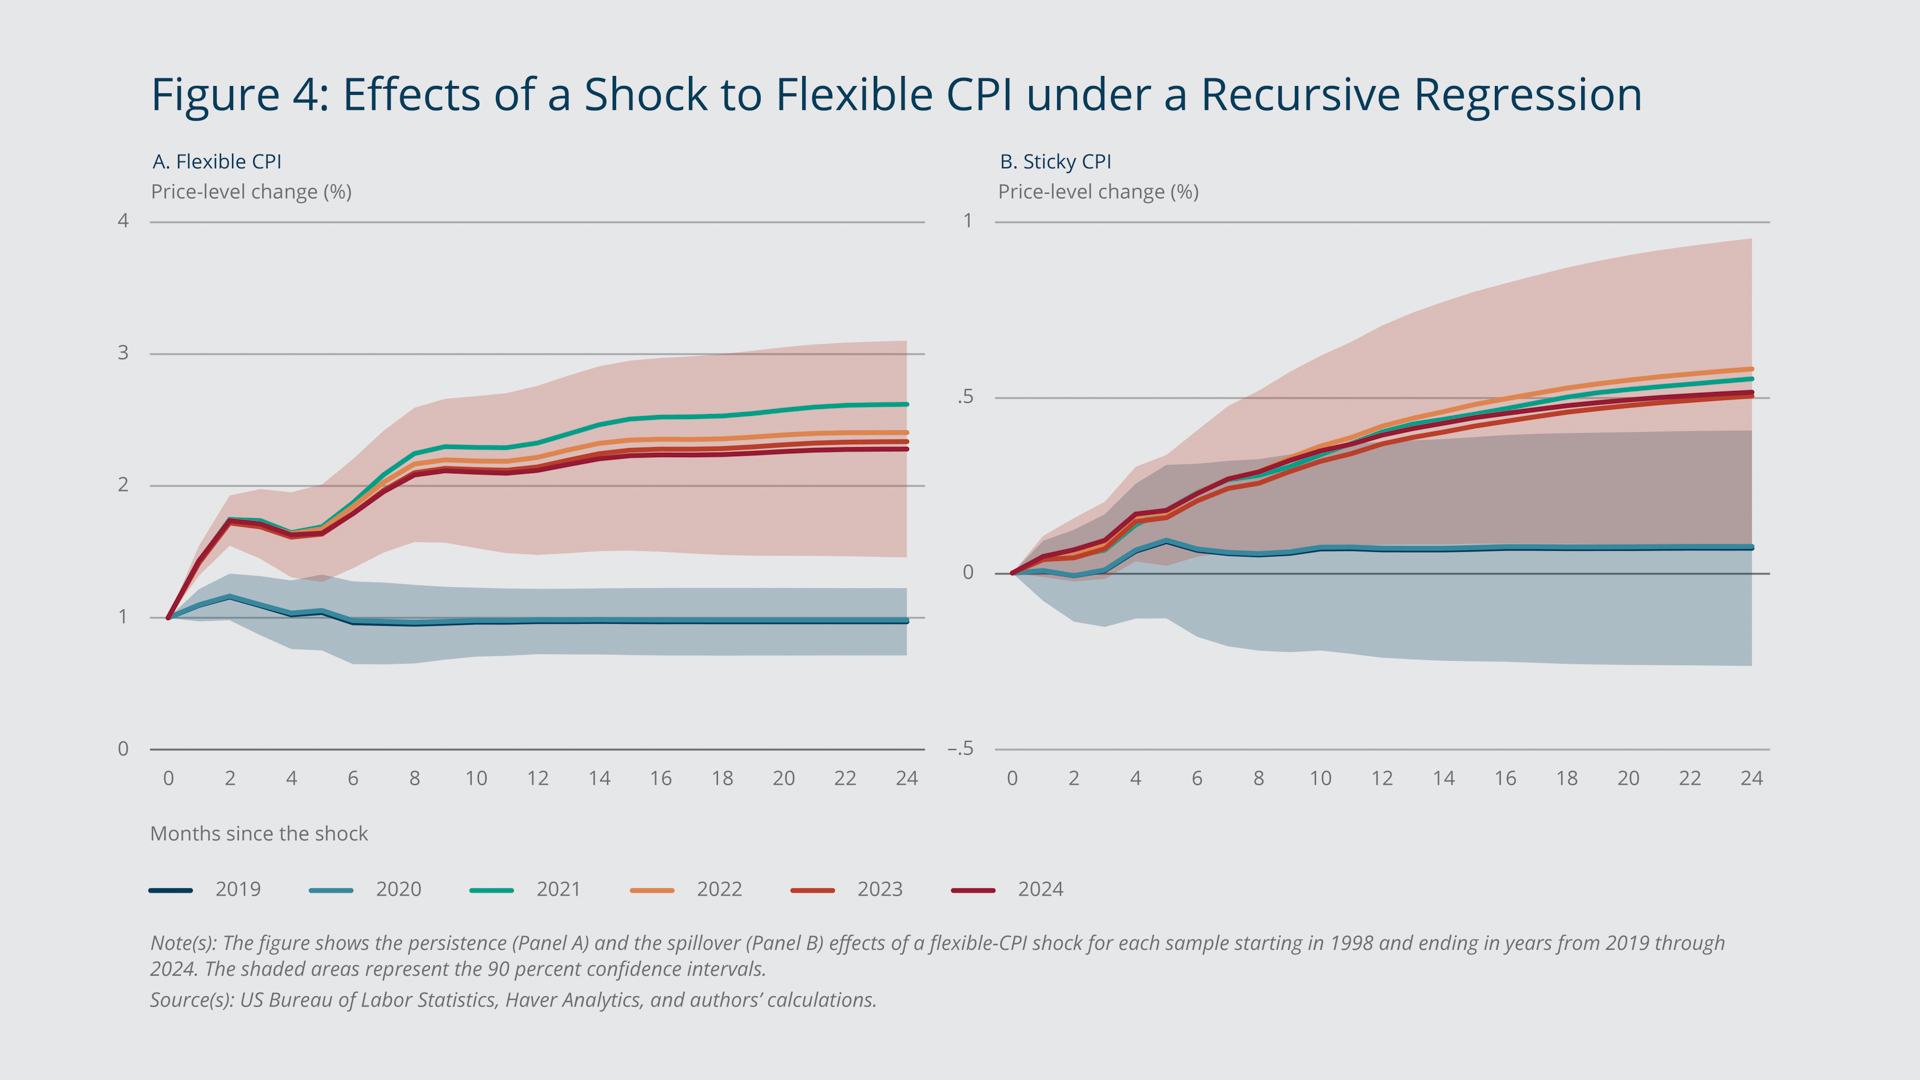
As shown in Figure 4, when we re-estimate the effects of a shock to the flexible CPI using a recursive regression that adds one year of data at a time starting with 2019 (the dark blue line), we find that inflation appears to have been becoming more transitory by the end of 2024. The figure shows that as we include subsequent years of data (the dark red line includes the latest data, through 2024), the effects of the flexible-CPI shock on both the flexible CPI and sticky CPI move closer to the respective estimated effects for 2019, when inflation was deemed transitory.
Michael Konstansky/Federal Reserve Bank of Boston
However, considerable uncertainty remains, given the wide confidence bands around the estimated effects, the non-monotonicity of the sticky CPI response (note that in Panel B, for example, the light red line—depicting estimates that include data through 2023—is closer than the dark red line is to the dark blue line), and external risks such as the anticipated tariff shocks that could shift inflation dynamics.
Endnotes
- The de-anchoring, or persistent deviation, of household inflation expectations from the Federal Reserve’s target rate can create a self-reinforcing scenario in which households, anticipating that prices will continue to rise rapidly, spend more in the present than they normally would to avoid paying higher prices in the future. The excess spending can lead to higher inflation. The de-anchoring of businesses’ inflation expectations can lead to similarly higher inflation as businesses raise prices in expectation of higher prices, and therefore higher costs, in the future. It can also lead to a wage–price spiral in which workers, anticipating higher prices, demand higher wages, leading to increased production costs that result in higher prices and a rise in inflation.
- Shapiro (2024) generates two new data series, the supply- and demand-driven contributions to personal consumption expenditures (PCE) inflation. Leiva-León et al. (2025) present a complementary statistical model to decompose, in real time, inflation readings into the underlying supply and demand components using co-movement between prices and quantities in the Personal Consumption Expenditures (PCE) series.
- See Cotton and Garga (2022) for further details regarding the BLS microdata on prices and the construction of price-change frequencies of products. The Federal Reserve Bank of Atlanta also produces sticky-price and flexible-price CPIs. The main difference is that the Atlanta Fed uses price-change frequencies based on the method in Bils and Klenow (2004), whereas we use the price-change frequencies over the period of January 2020 through July 2024 to classify the products as sticky or flexible. The Atlanta Fed uses spending categories that are broader than those for which the price-change frequencies in Bils and Klenow (2004) are available. Its analysis therefore relies on a subjective mapping. By contrast, we use product codes directly from the BLS microdata, thereby bypassing the need for a mapping. Another key difference between our method and the Atlanta Fed’s is that Bils and Klenow (2004) do not separate regular price changes from sales prices, which leads to significantly higher price-change frequencies for a large set of products in Atlanta Fed’s sample.
- The BLS publishes the inflation rates at the item-strata level each month. Therefore, when classifying products into the sticky and flexible groups, we also do it at the item-strata level. To compute the frequency of price changes for the item strata, we take the weighted average of the price-change frequencies of all products within the item strata, using monthly CPI expenditure weights. The monthly price-change frequency of an item strata represents the fraction of its products that changed prices relative to the preceding month. We then compute the distribution of price-change frequencies using the average price-change frequencies of item strata over the 2020–2024 period. Our intention is to use the most recent price-setting data to shed light on the underlying inflation regime. We also consider only “regular” price changes when measuring the frequency; that is, we drop any price quotes flagged as “on sale” because sales are temporary and therefore may have little to do with underlying inflation.
- When computing the median, we consider the weighted distribution by employing CPI expenditure weights averaged over the 2020–2024 period. The median item stratum in the sample has a price-change frequency of 16.2 percent per month. This implies that an item stratum is classified as flexible if it changes prices more frequently than every 5.7 months. Otherwise, we classify it as sticky.
- Borio et al. (2023) also provide a characterization of the inflation process that divides it into low-inflation and high-inflation regimes based on stylized facts regarding the co-movement and spillovers among disaggregated PCE series and the joint behavior of wages and prices. The authors describe the two regimes and show that there are self-reinforcing transitions from the low-inflation regime to the high-inflation regime.
References
Bils, Mark, and Peter J. Klenow. 2004. “Some Evidence on the Importance of Sticky Prices.” Journal of Political Economy 112(5): 947–985.
Borio, Claudio, Marco Jacopo Lombardi, James Yetman, and Egon Zakrajšek. 2023. “The Two-regime View of Inflation.” Bank for International Settlements BIS Papers No. 133.
Cotton, Christopher D., and Vaishali Garga. 2022. “The Role of Industrial Composition in Driving the Frequency of Price Change.” Federal Reserve Bank of Boston Research Department Working Papers No. 22-9.
Leiva-León, Danilo, Viacheslav Sheremirov, Jenny Tang, and Egon Zakrajšek. 2025. “Parsing Out the Sources of Inflation.” Federal Reserve Bank of Boston Series Current Policy Perspectives 25-5.
Shapiro, Adam Hale. 2024. “Decomposing Supply‐ and Demand‐driven Inflation.” 2024. Journal of Money, Credit and Banking.

 About the Authors
Christopher D. Cotton,
Federal Reserve Bank of Boston
Christopher D. Cotton is a senior economist in the Federal Reserve Bank of Boston Research Department.
Email: Christopher.Cotton@bos.frb.org
Vaishali Garga,
Federal Reserve Bank of Boston
Vaishali Garga is a principal economist in the Federal Reserve Bank of Boston Research Department.
Email: Vaishali.Garga@bos.frb.org
Acknowledgments
Resources
Site Topics
Keywords
- sticky ,
- flexible ,
- CPI ,
- inflation regime ,
- prices ,
- Persistence ,
- spillover
JEL Codes
- E31 ,
- E52 ,
- E58
Citation
Cotton Christopher D., and Vaishali Garga. 2025. “Transitory or Persistent? What the Frequency of Price Changes May Tell Us about Inflation.” Federal Reserve Bank of Boston Current Policy Perspectives 25-11.