Early Warning Signals in Private Credit? What BDC Portfolios Reveal about Emerging Risks 


Federal Reserve Bank of Boston

The views expressed herein are solely those of the authors and should not be reported as representing the views of the Federal Reserve Bank of Boston, the principals of the Board of Governors, or the Federal Reserve System.
Private credit—lending by nonbank financial institutions—has grown to over $1 trillion in the United States, yet most of it remains opaque to investors and policymakers because private credit funds are not required to publish their holdings. Business development companies (BDCs) are an exception and provide a window into this segment of the credit markets.
All BDCs are publicly registered investment vehicles that must file periodic reports with the Securities and Exchange Commission (SEC), including quarterly and annual filings.1 We analyze these disclosures to detect trends in the pricing of BDC loans, borrowers creditworthiness, and the industry composition of BDC loan portfolios.
Sign up for Research Department Updates.
We look at the SEC filings of 168 BDCs, representing nearly 890,000 company-quarter loan observations. We focus primarily on the period since 2022, when improved reporting consistency allows for more reliable comparisons across lenders and over time.
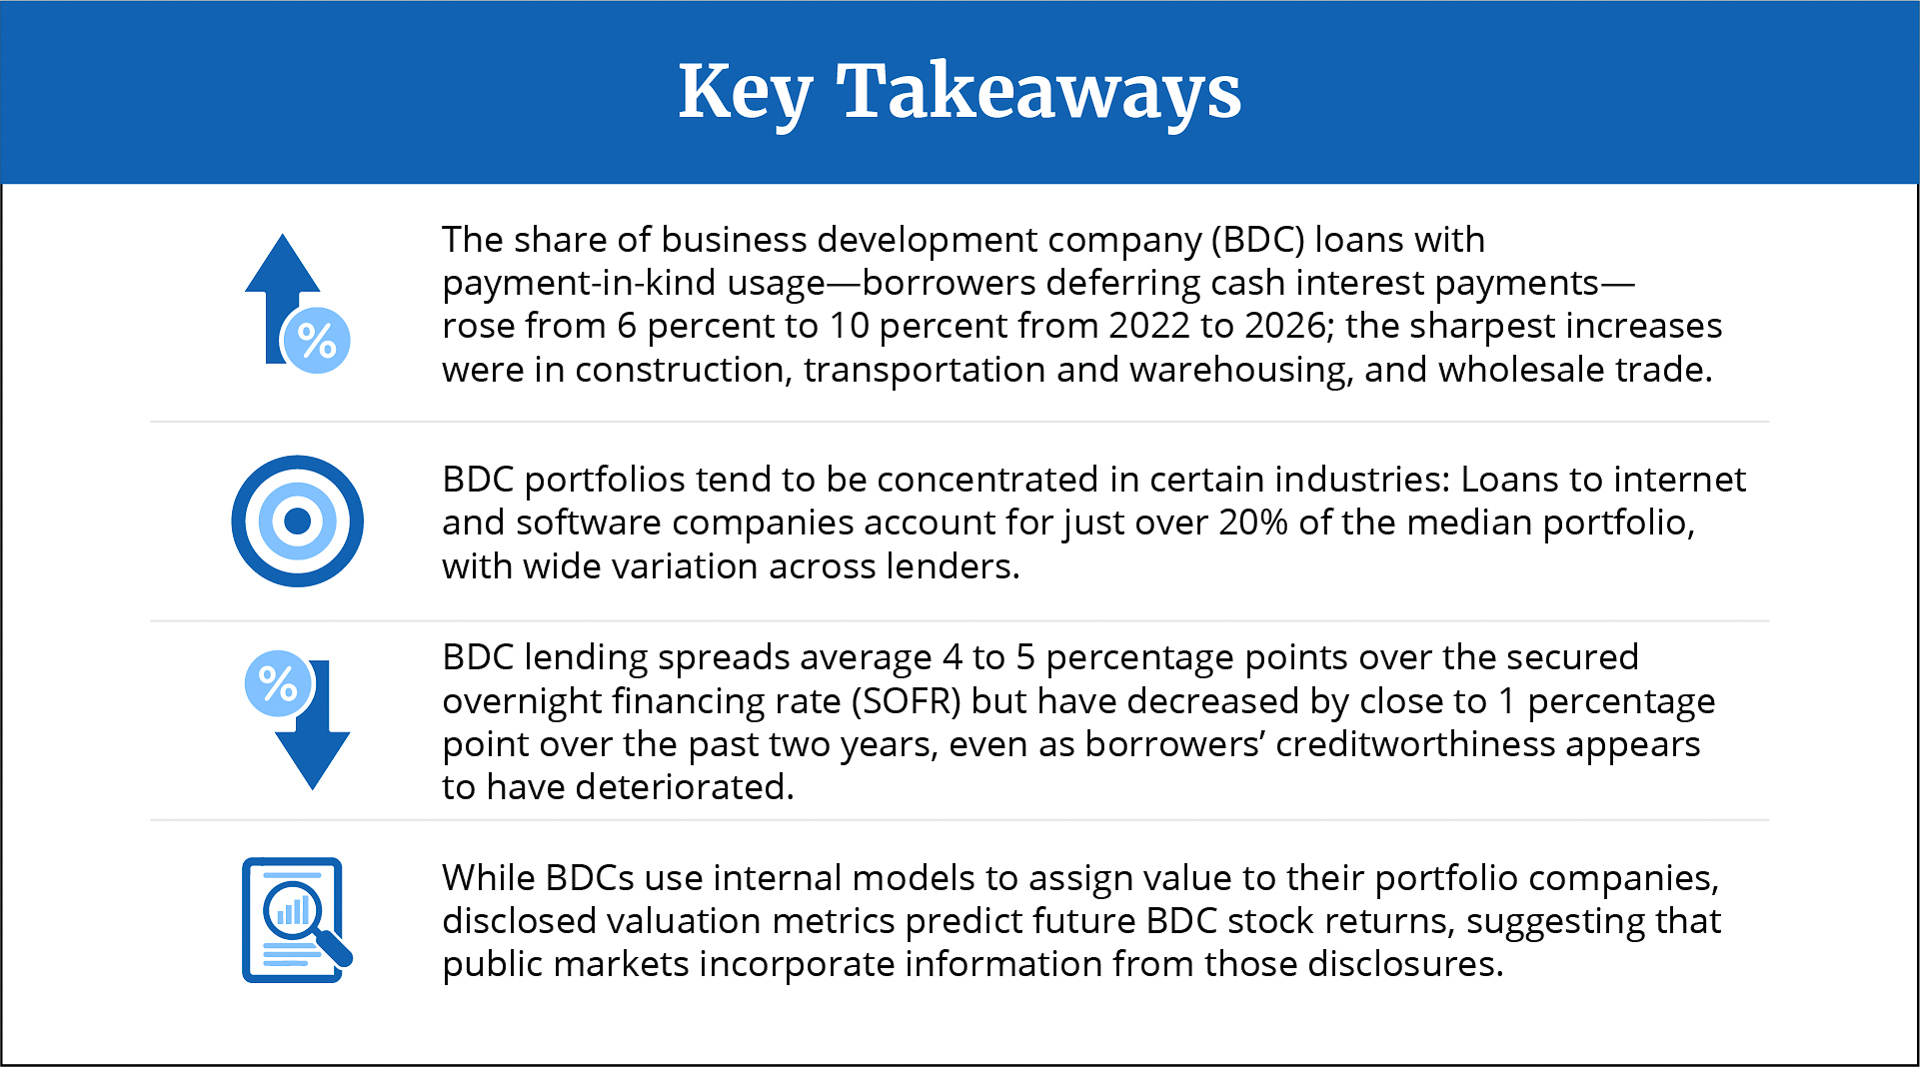
Our analysis produces a detailed picture of middle-market lending conditions that can inform assessments of the broader private credit market. It shows that payment-in-kind (PIK) usage has increased steadily since 2022. Under a PIK arrangement, the borrower adds unpaid interest to its loan principal instead of paying cash each quarter. The increase suggests there is growing pressure on borrower cash flows. At the same time, there has been a compression of BDC lending spreads (the premium of the loan interest rate over a benchmark rate). This decrease in the size of spreads is consistent with mounting competition in private credit markets.
Although BDCs use internal models to assign values to the companies in their lending portfolios, we find that the disclosed valuation metrics contain information that helps predict future BDC stock returns. This suggests that public markets pricing of a BDCs shares incorporates and reacts to signals about the quality of its portfolio.
Constructing a Window into Private Credit
The quarterly and annual reports that BDCs file with the SEC (forms 10-Q and 10-K) include complete schedules of their investment holdings. The investments are typically loans (senior secured, mezzanine, or unitranche) but also include equity positions and warrants. Each filing lists every company in a BDC’s lending portfolio, the type and amount of each loan, interest rate terms, fair value estimates, and often the industry classifications of the companies in the portfolio. We use this information to construct a comprehensive data set of BDC lending activity.2
From the first quarter of 2022 through the fourth quarter of 2025, the number of BDCs increased from an average of 105 to 166 per quarter, and the number of loans grew cumulatively by just over 100 percent over that period.3 Both measures declined somewhat in 2025, which is consistent with the broader slowdown in leveraged lending activity. Over this period, BDCs provided financing primarily to middle-market companies, which are too large for traditional small business lending but too small to access public bond markets.
Industry Concentration Varies Substantially across Lender Portfolios
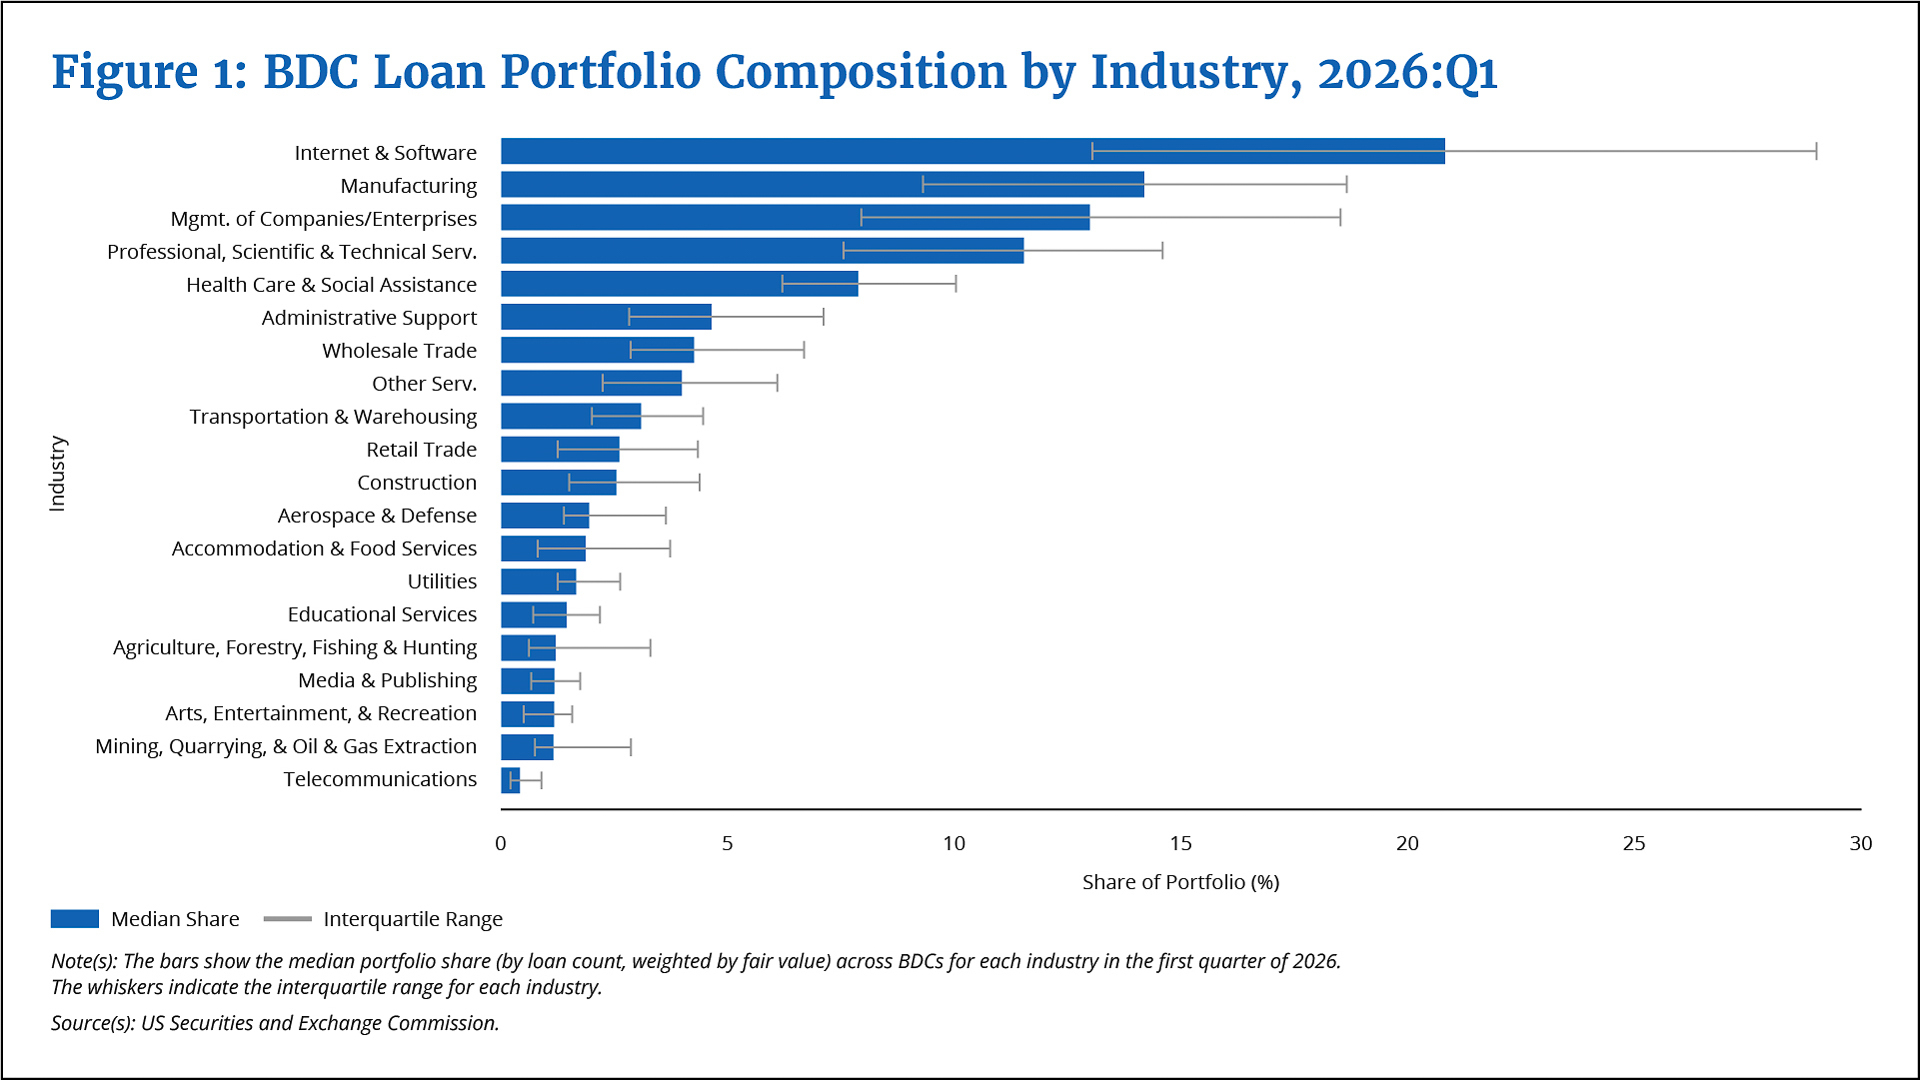
BDC portfolios tend to be concentrated in certain sectors, although the composition varies substantially across lenders. Figure 1 shows the distribution of portfolio shares by industry as of early 2026.4 Internet and software companies represent the largest share of the median BDC’s holdings by loan count, about 20 percent. Manufacturing and industrial firms, general professional services, and health care round out the top five sectors, each accounting for 10 to 15 percent of the typical portfolio.
Federal Reserve Bank of Boston
The variation around these portfolio shares is substantial. The interquartile range for holdings in internet and software companies stretches from less than 15 percent to nearly 30 percent of BDC portfolios. We find similar dispersion for portfolio shares in the other top four sectors. Some lenders have built portfolios that are highly concentrated in specific sectors, while others maintain broad diversification across dozens of industries.
Technology-related lending has attracted the most media attention in recent quarters. The 20 percent share of the median BDC portfolio that internet and software companies represent may be modest, but this figure belies wide variation. As noted, some BDCs have concentrated more than one-third of their lending in technology sectors, creating substantial exposure to venture-backed and growth-stage companies. Some of these borrowers likely are facing headwinds from disruptions caused by the reshaping of software business by artificial intelligence.
Federal Reserve Bank of Boston
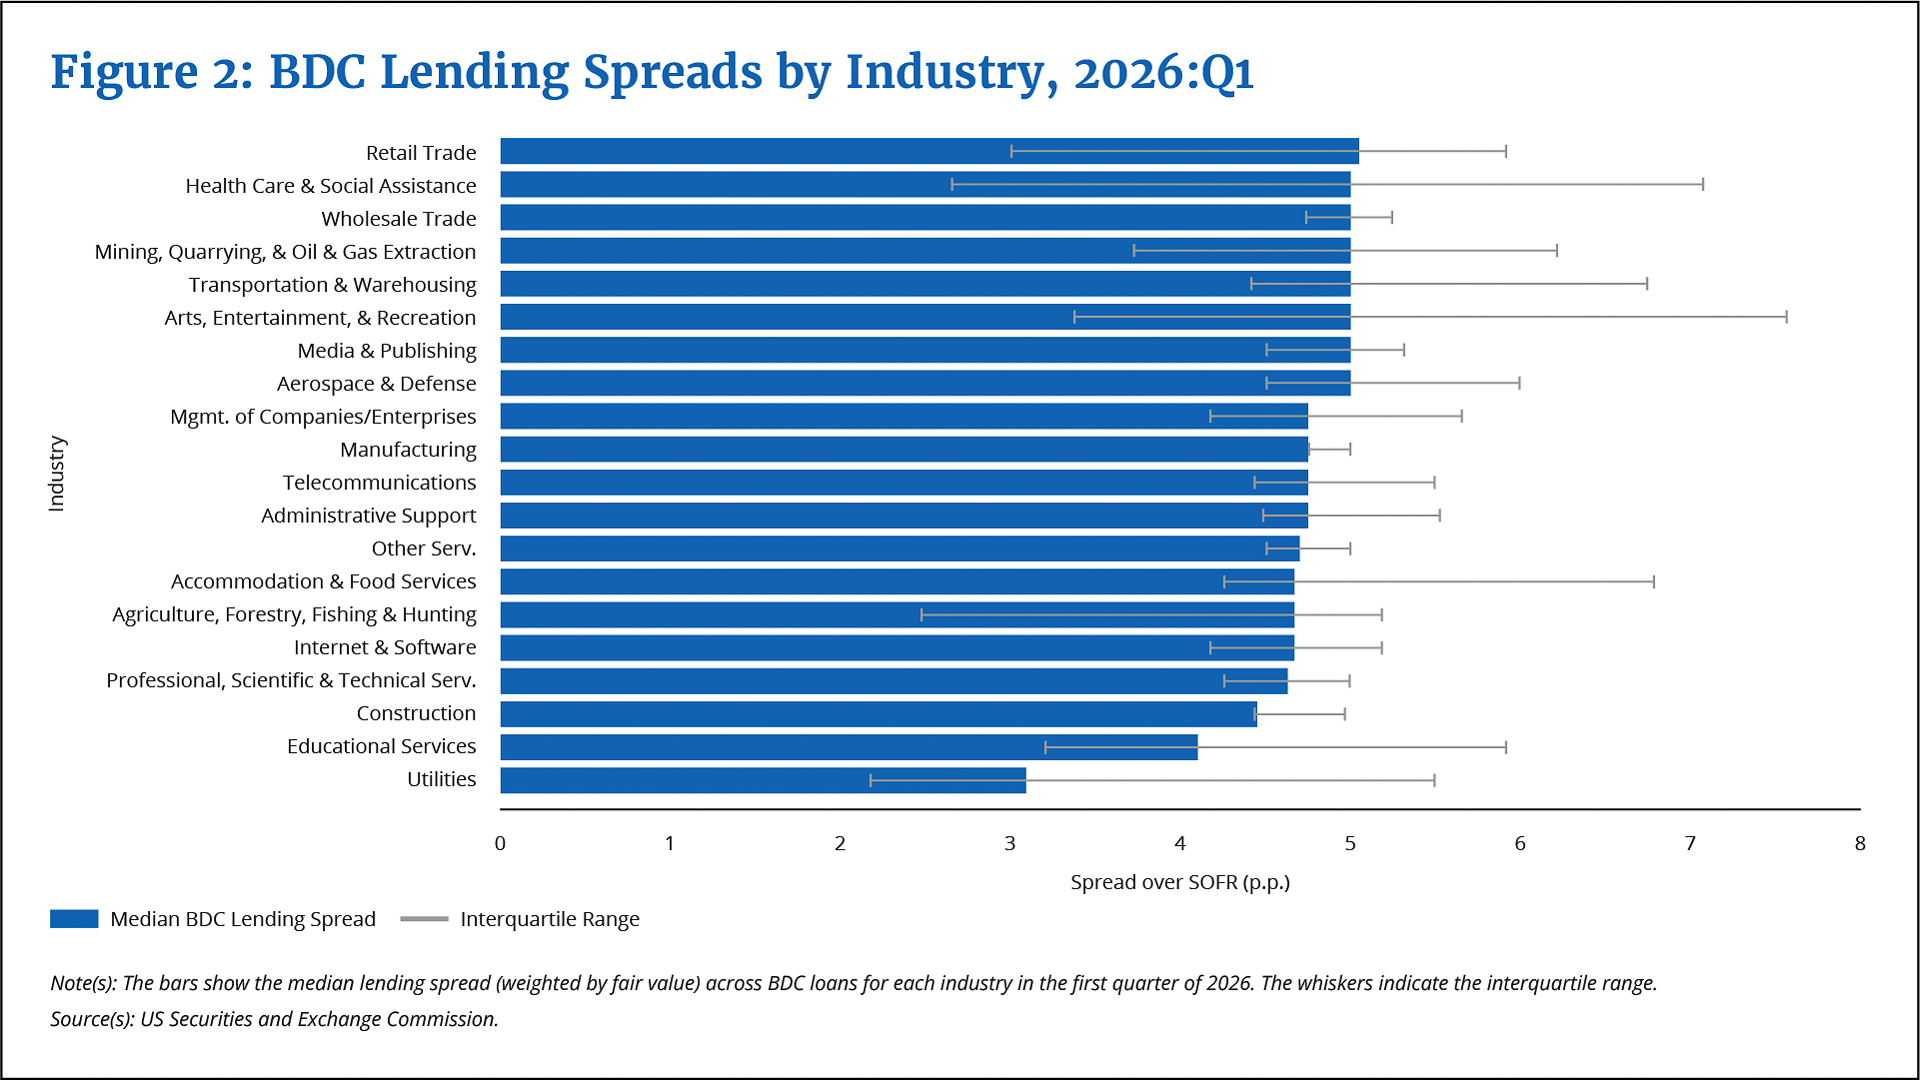
By comparison, there appears to be limited cross-industry variation in BDC loan pricing, that is, the valuation of existing loans, which moves inversely with spreads, rising as spreads compress and vice versa. Figure 2 shows median spreads by industry. Whether lending to consumer products companies, health-care providers, or technology firms, BDCs charge median spreads that cluster between 4 and 5 percentage points over a reference rate—the secured overnight financing rate (SOFR) is a benchmark interest rate that has been commonly used to price loans in recent years. The interquartile range for most industries spans roughly 1.5 percentage points. This relative uniformity across sectors with different risk profiles may be largely the result of BDCs actively selecting companies for their portfolios that have specific risk profiles. Pricing could also be influenced by competitive pressure, given the increasing amount of capital being invested in private credit—meaning that the robust growth of BDC lending has kept spreads compressed and prices high.
Payment-in-Kind Usage Has Increased across Most Sectors
We closely track the frequency of PIK usage by BDC borrowers that is reflected in the Schedule of Investments disclosures that BDCs file with the SEC.5 PIK usage is designed to allow growth companies to reinvest rather than service debt, but an increase in PIK usage across a lenders portfolio often signals that borrowers are struggling to generate sufficient cash flow.
Federal Reserve Bank of Boston
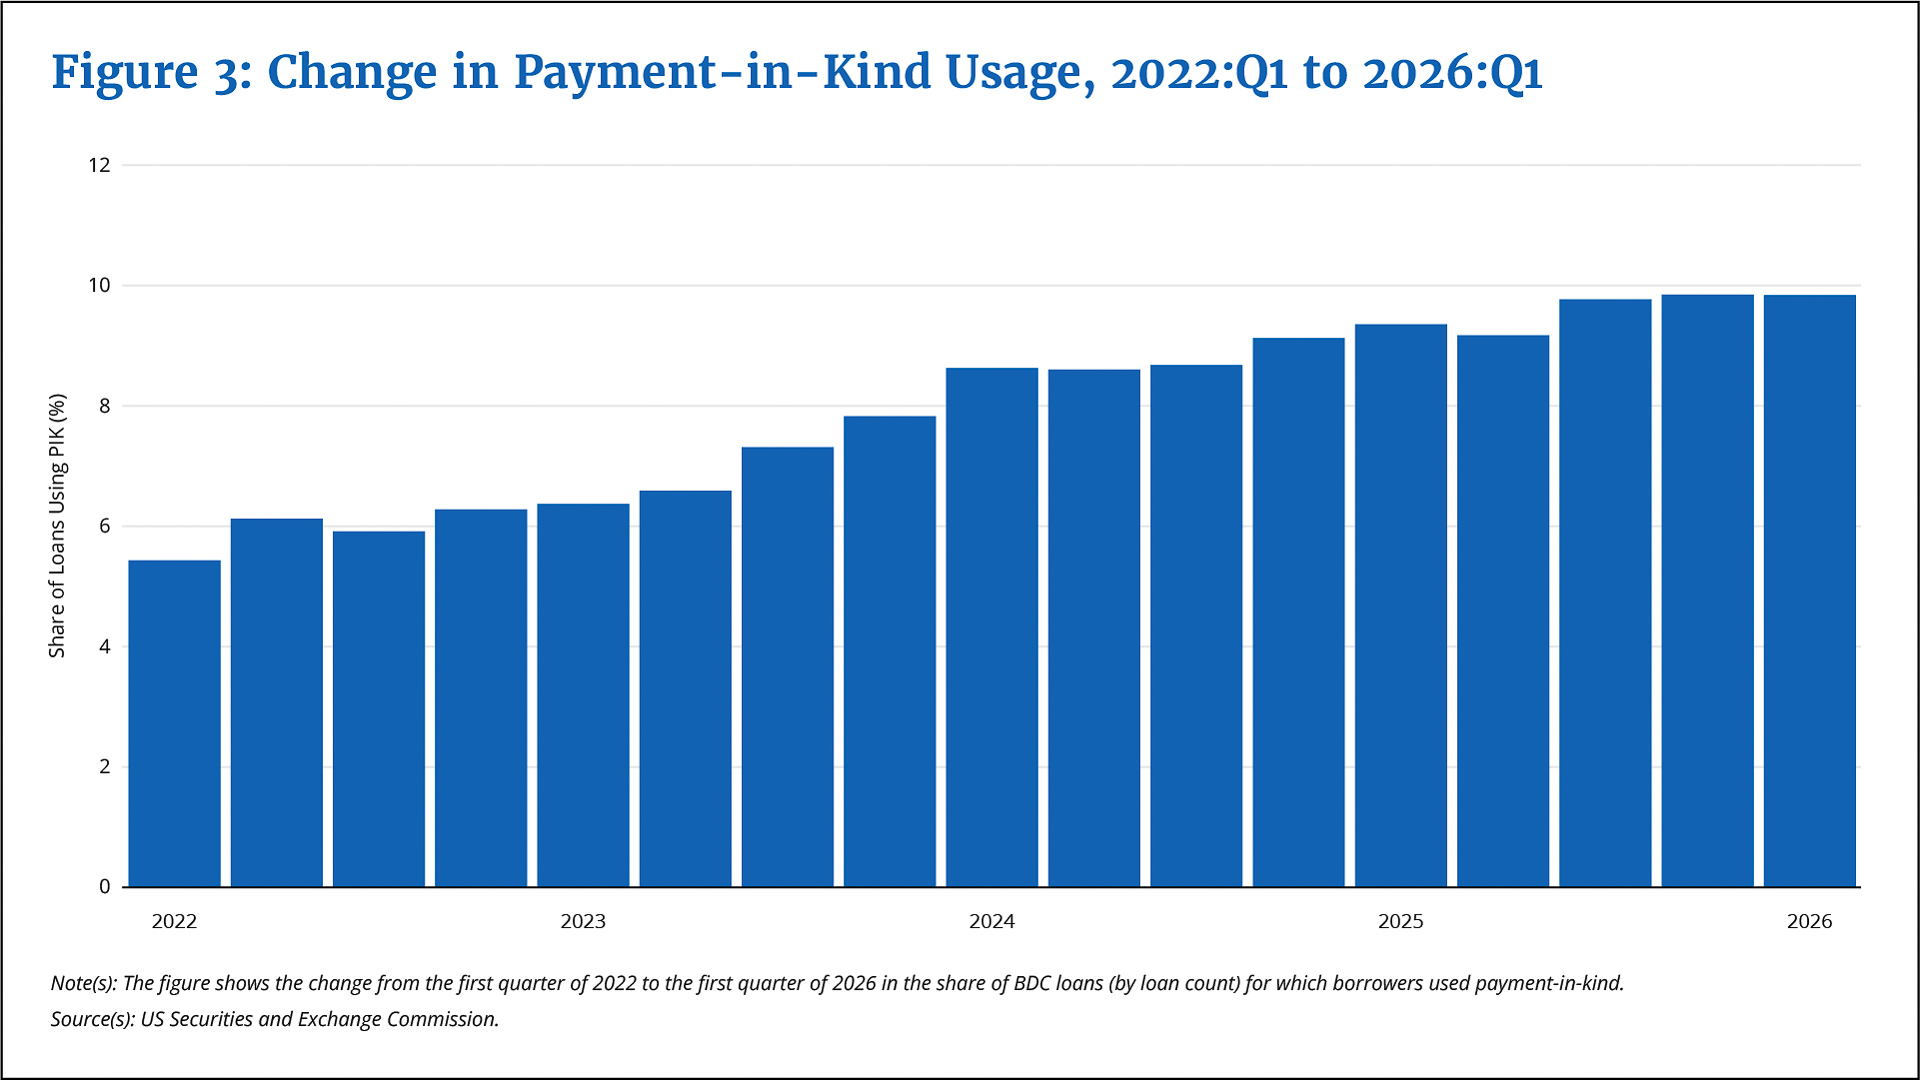
We document a steady increase in PIK usage since early 2022. As shown in Figure 3, the share of BDC loans with PIK usage rose from approximately 6 percent to roughly 10 percent by early 2026—a 67 percent increase over three years. This trend appears across nearly every industry in our sample, and the variation across industries suggests that the increase in PIK usage cannot be attributed largely to BDCs adding more new companies in growth industries to their portfolios.
Federal Reserve Bank of Boston
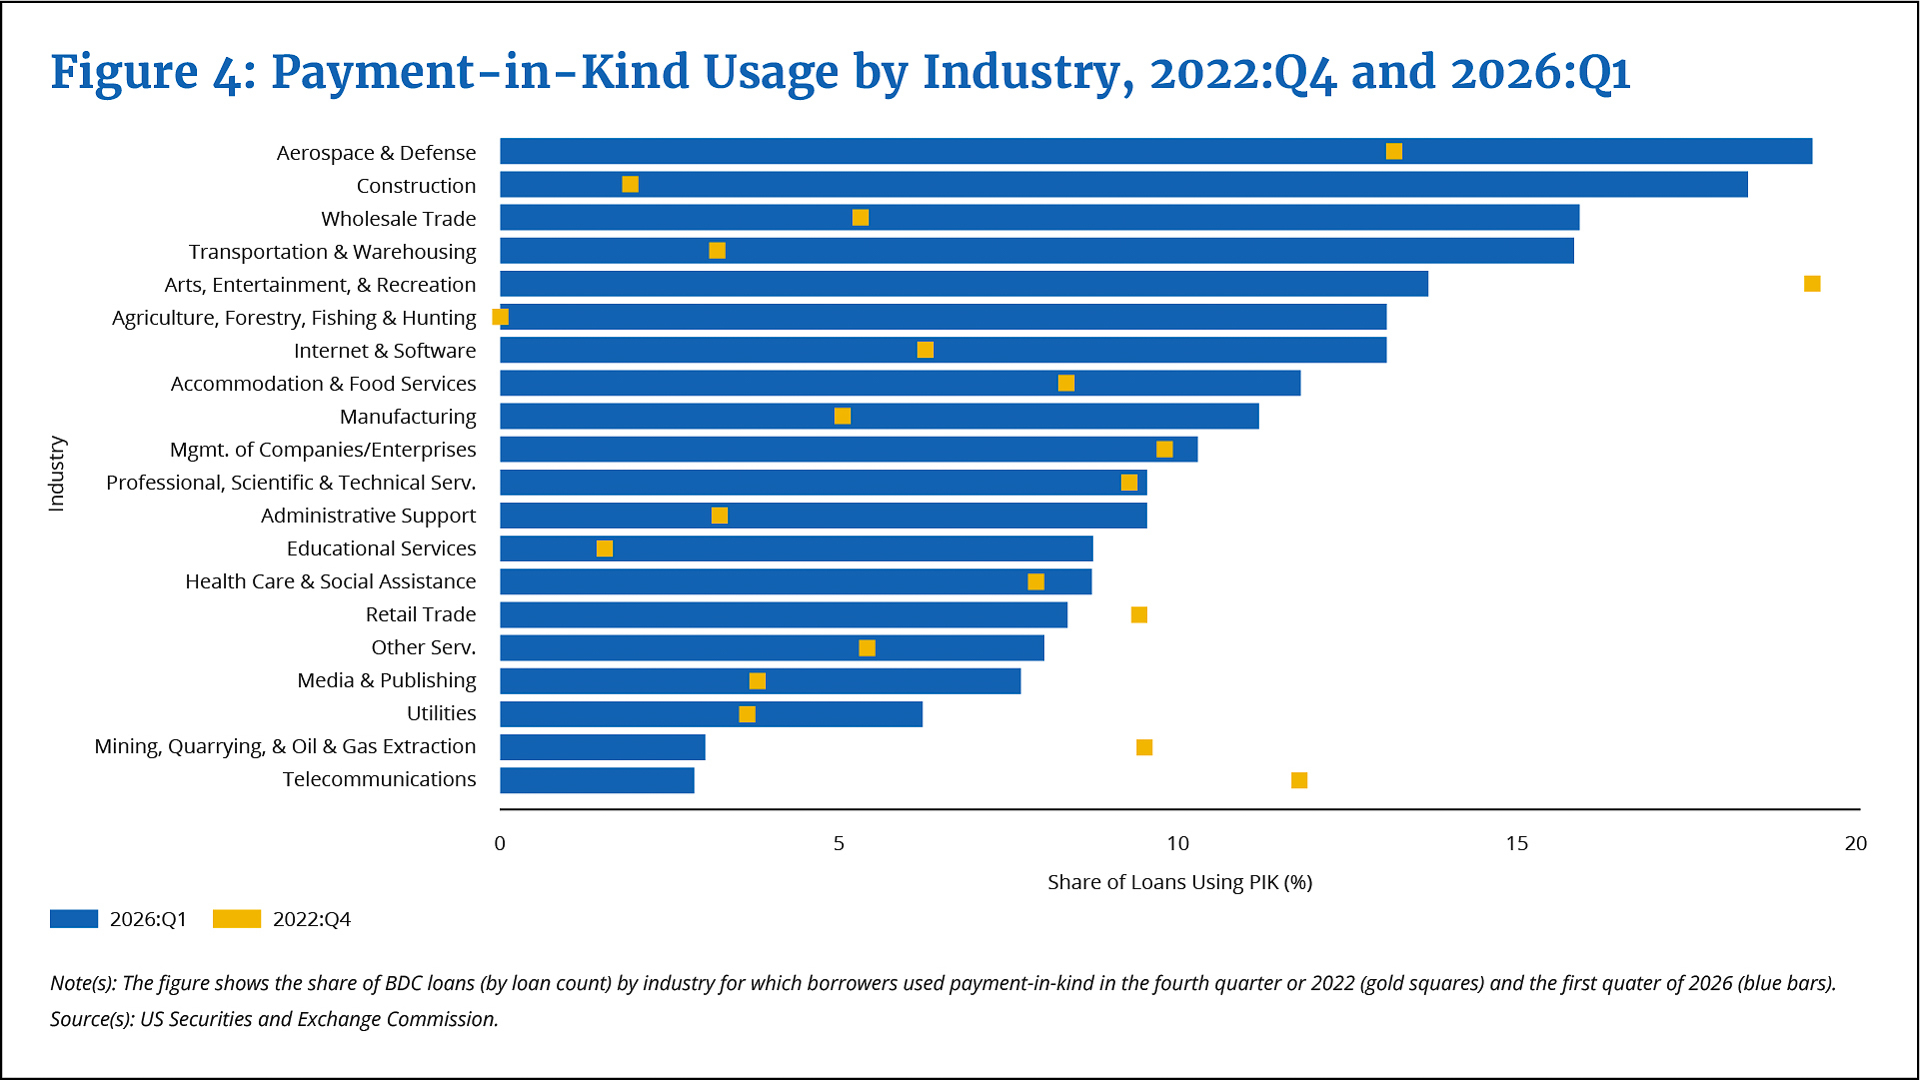
Figure 4 breaks down PIK usage trends by industry. Construction displays the largest increase, from less than 5 percent in 2022 to nearly 20 percent by early 2026. Wholesale trade and transportation and warehousing also show pronounced increases, with PIK shares more than doubling over the period. By contrast, industries such as accommodation and business services, where the baseline PIK usage was already elevated, exhibit more modest increases.
Because the increase in PIK usage is spread across diverse sectors and not concentrated in a few troubled industries, it suggests there is broad-based pressure on the cash flows of middle-market borrowers. This is consistent with higher interest rates since 2022 having mechanically increased debt service burdens for floating-rate borrowers, which constitute the majority of BDC portfolios. Companies that could comfortably service their debt at a rate of SOFR plus 5 percentage points when SOFR was near zero percent face a substantially greater burden when SOFR is higher than 4 percent.
Spreads Have Compressed Despite Softening Credit Metrics
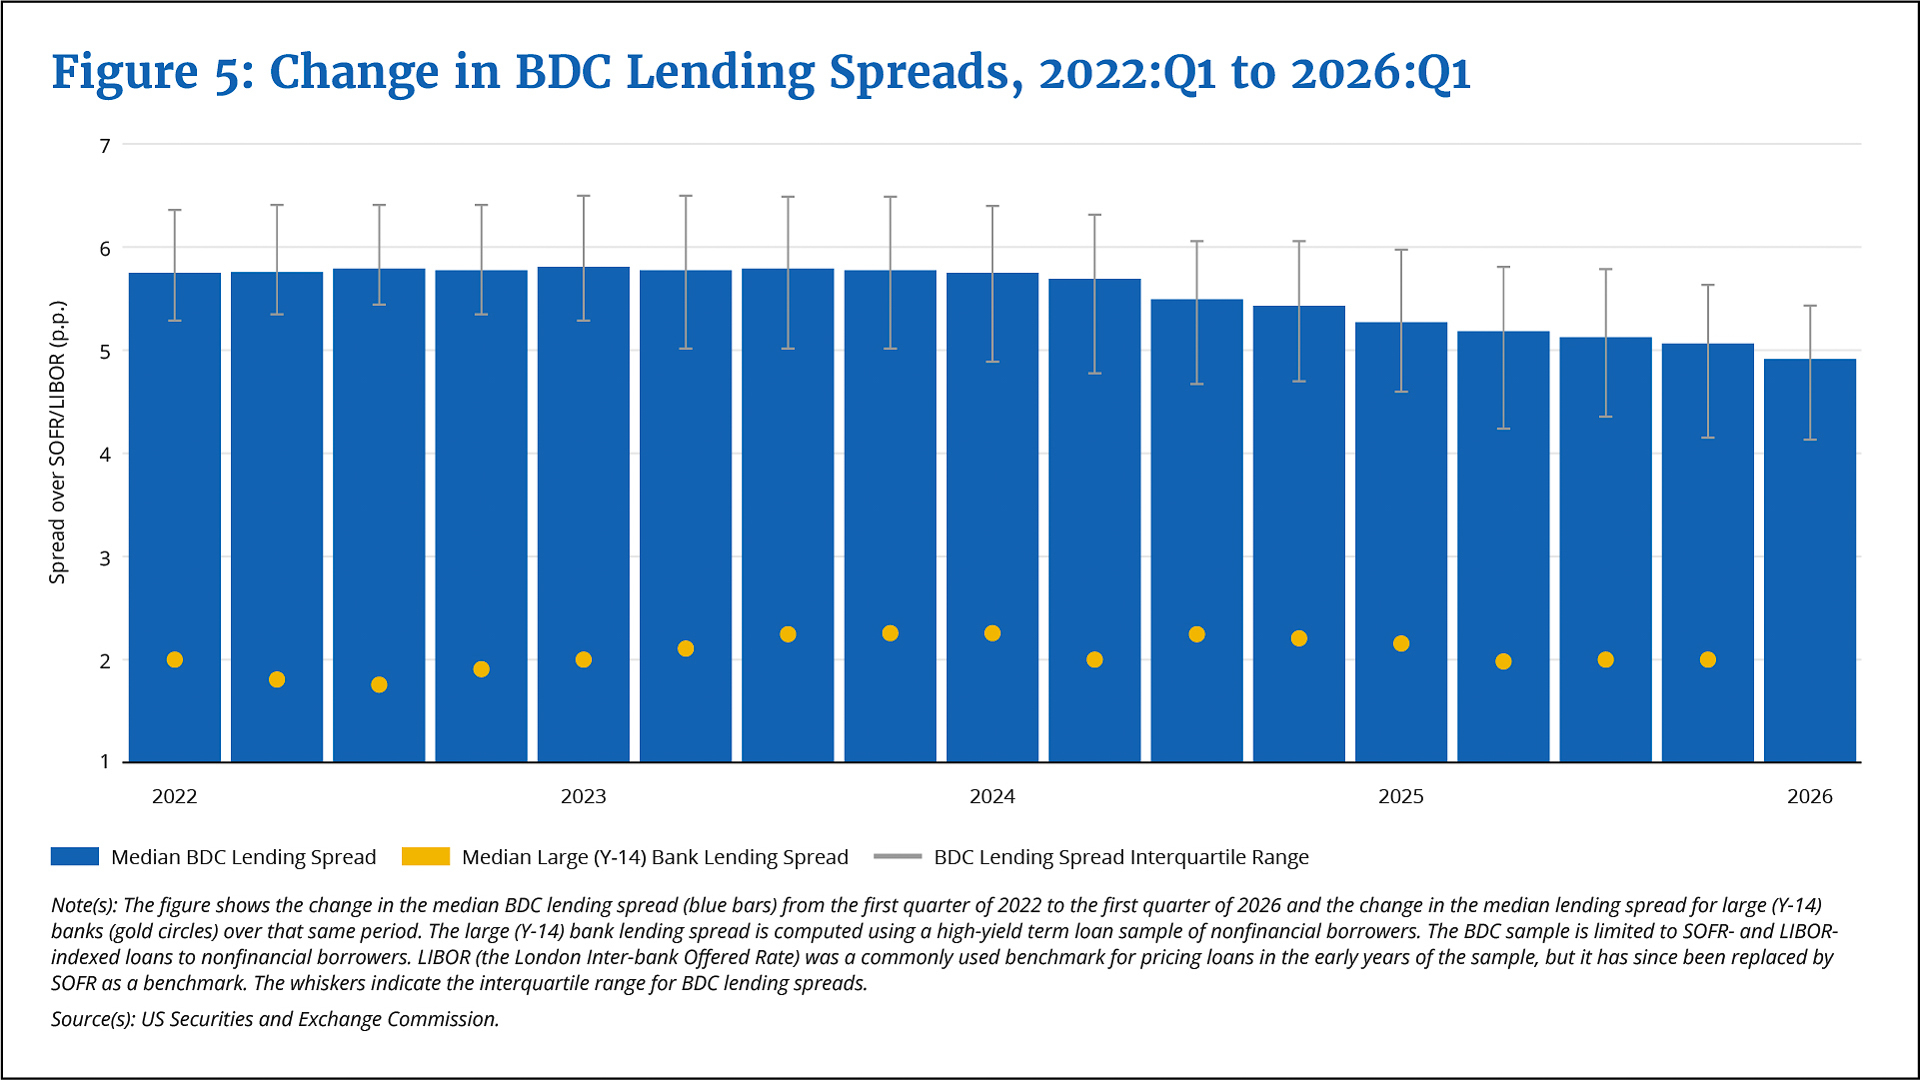
Lending spreads should, in principle, reflect underlying credit risk. We find that BDC spreads substantially exceed those charged by large banks on comparable corporate loans. As noted, the median BDC spread runs 4 to 5 percentage points over SOFR, compared with roughly 2 percentage points over SOFR for high-yield term loans, calculated using filings by large banks subject to the Federal Reserve stress test (known as FR Y-14 data). This premium compensates for lending to riskier, smaller borrowers that lack access to bank credit or public bond markets.6
Federal Reserve Bank of Boston
Over the past two years, however, BDC spreads have narrowed by approximately 1 percentage point. Figure 5 shows this compression in median spreads since 2022. The compression likely reflects growing competition, as investors have poured capital into private credit strategies in search of higher returns. When more capital chases the same loan opportunities, spreads tend to compress.
The combination of rising PIK usage and compressing spreads presents a puzzle. If borrowers are increasingly unable to pay cash interest, lenders might be expected to demand higher compensation for bearing that risk. Instead, however, they are accepting lower compensation. This could be a form of implicit restructuring: lowering the cost of debt to reduce the probability of default. This pattern also could be consistent with lowering rates in response to an increasingly competitive market.
Market Valuations and Internal Fair Values
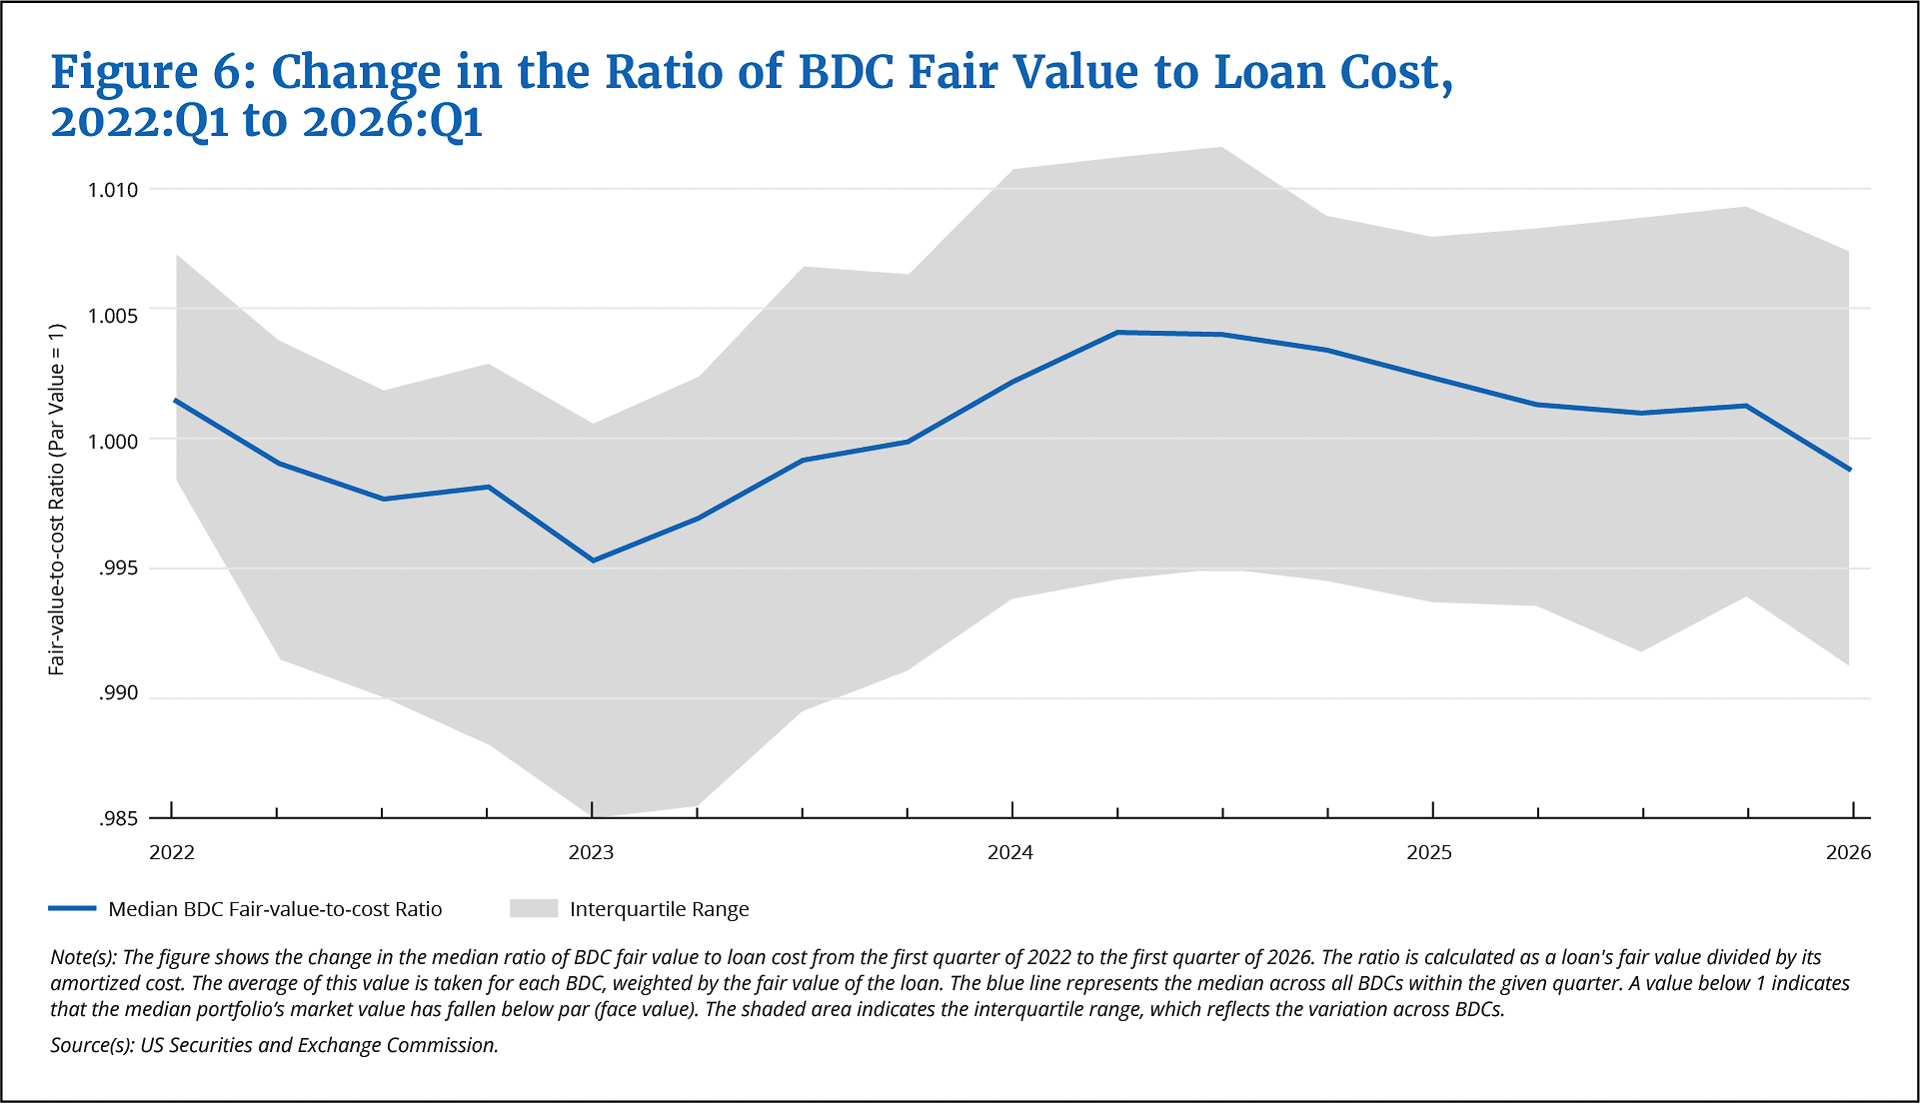
BDCs report the fair value of their portfolios in their quarterly regulatory filings. Because most middle-market loans lack liquid secondary markets, meaning that BDCs dont bundle and sell the loans as securities, these valuations rely substantially on the BDCs own models and the judgment of their management. The ratio of reported fair value to loan (purchase) cost or principal provides one measure of how BDCs assess the credit quality of their holdings.
Federal Reserve Bank of Boston
As shown in Figure 6, this ratio, on average, remained relatively stable near 1.0 throughout our sample period. A slight dip leading into 2023 was followed by a gradual recovery. The stability suggests that, in aggregate, BDCs view their portfolios as holding value close to par (face value) despite the increase in PIK usage and other indications of rising risk. At the same time, assessments of portfolio quality vary substantially across BDCs, as indicated by the interquartile range (the figures shaded region).
Federal Reserve Bank of Boston
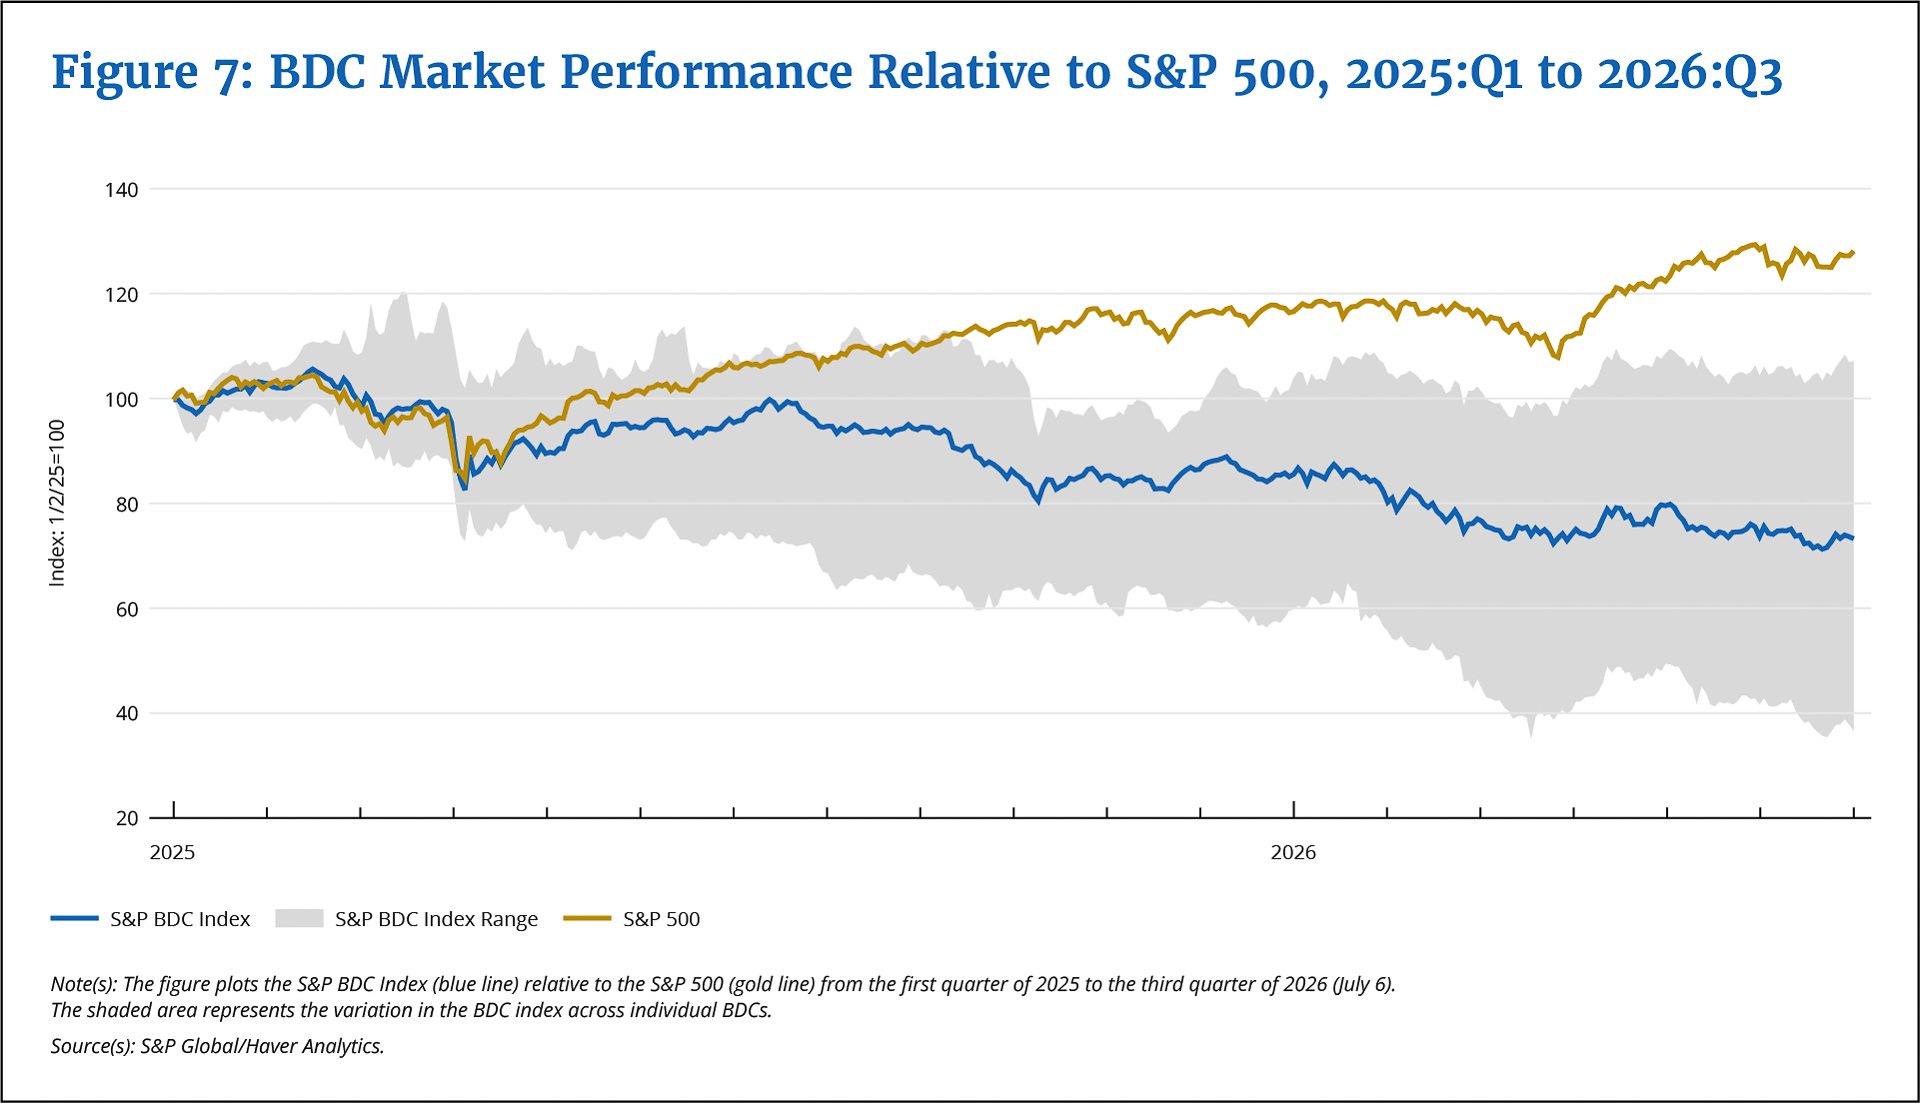
BDCs equity prices (their publicly traded value), meanwhile, have underperformed the broader market. Figure 7 plots the S&P BDC Index relative to the S&P 500 since 2025. BDC equities declined roughly 20 percent relative to the broad market from early 2025 to mid-2026, albeit again with substantial variation across individual BDCs (indicated by the shaded areas range). This underperformance most likely reflects market concerns about the private credit sector specifically. These concerns stem most recently from the potentially serious disruptions that AI could cause in some of the industries that constitute substantial shares of private credit portfolios.
Despite the opacity and illiquidity of BDCs portfolio valuation, we find a statistically significant relationship between BDCs internal portfolio metrics and subsequent stock market returns. BDCs reporting lower fair value ratios in one quarter tend to experience weaker equity returns in subsequent quarters, which is consistent with investors responding to disclosed credit-quality signals. A one-standard-deviation decline in a BDCs fair value ratio is associated with approximately 50 basis points (0.5 percent) lower abnormal returns on its equity in the following quarter.7
Bank Exposure Has Grown but Remains Modest Relative to Capital
BDCs fund their lending activities through a combination of equity, unsecured debt, and secured credit from banks. Bank credit creates a link between BDC performance and the traditional banking system that warrants monitoring.
Total committed bank credit to BDCs has grown substantially, from approximately $10 billion in 2013 to more than $50 billion by 2025, with actual utilization of that credit reaching roughly $35 billion.8 This growth reflects both the expansion of the BDC sector and the deepening of relationships between banks and private credit firms.
In context, however, these exposures remain modest: BDC-related commitments represent less than 2 percent of large banks Tier 1 capital, the core capital that a bank uses to absorb losses while it operates normally; it comprises mainly shareholder equity and retained earnings. Moreover, bank loans predominantly represent senior secured claims on the BDCs, meaning banks are first in line for payments from BDCs. Thus, while the losses from a severe stress scenario affecting BDC portfolios could be substantial, those losses would not be large enough to threaten bank solvency.9 At the current exposure levels, the direct transmission of private credit stress to banking-system stability seems to be limited.
Nevertheless, banks and supervisors appear cognizant of evolving conditions. The April 2026 Federal Reserve Board of Governors Senior Loan Officer Opinion Survey (SLOOS) included special questions on lending to nonbank financial institutions. Large and regional banks both reported tightening standards for business credit intermediaries and private equity funds along multiple dimensions: maximum loan size, maturity, risk premiums, covenants, and collateral requirements. Banks cited a less favorable economic outlook, reduced risk tolerance, and increased borrower credit risk as motivations for their actions.
Demand for credit from BDCs and similar vehicles, meanwhile, has strengthened. The divergence between tightening credit supply and increasing demand creates pressure that could affect BDC funding costs and availability going forward.
Implications for Monitoring Private Credit
The patterns of BDC portfolios documented here offer useful insights for monitoring the broader private credit market. Rising PIK usage signals cash flow pressure among middle-market borrowers. Spread compression despite softening credit metrics suggests that competition is squeezing private credit markups and may also be eroding lending standards. Industry concentrations create correlated exposures that warrant attention.
However, these observations come with important caveats. BDCs represent only a portion of the private credit universe, and because they are publicly listed, their lending behavior may be different from that of fully private vehicles. Therefore, the patterns we observe may not generalize to hedge fund credit strategies, insurance company direct lending, or private equity credit arms that operate without disclosure requirements.
In a market where most activity occurs behind a veil of privacy, BDCs provide the only comprehensive, real-time insight into lending conditions. The concerning signs—rising deferrals, compressing spreads, and concentrated exposures—likely exist in some form across the broader private credit landscape. Continued monitoring of BDC portfolios can inform assessments of a market that otherwise remains largely opaque.
Endnotes
- Some BDCs are publicly listed and traded on exchanges, while others are publicly offered but not publicly listed, although they frequently have scheduled redemption or share repurchase programs. There are also privately offered BDCs that are available only to accredited investors.
- The raw data require substantial processing. Company names appear in varying formats across filings. For example, the same borrower might be listed as “ABC Corp,” “ABC Corporation,” or “ABC Corp – Term Loan” in different quarters or by different lenders. Industry classifications follow BDC-specific conventions rather than standard codes. Interest rates appear in multiple formats, sometimes as all-in rates and sometimes as spreads over reference rates. We harmonize the data to produce consistent measures that can be compared across the 168 lenders in our sample.
- The growth rate is computed based on new loans originated to each distinct borrower by BDCs that were active throughout the 2022–2025 period.
- The industry classifications we use are based on the sector or business function that is included in a company’s website profile. Industry classifications are initially processed as reported by the BDCs, which follow their own conventions rather than standard codes. Moreover, different BDCs may apply different classification criteria so that a given company receiving loans from multiple BDCs may be classified into different industries.
- The PIK percentages that we extract from the Schedule of Investments tables reflect active borrower usage during the reporting period. Per SEC disclosure rules, these tables must state the actual end-of-period rate structure. For example, a loan listed at 11.5 percent (including 2 percent PIK) means that the borrower is actively capitalizing that 2 percent interest into the loan principal, rather than paying it in cash. Unexercised “PIK toggles” are excluded from these tables and preserved only in SEC text footnotes.
- Borrowers may also be willing to pay a premium for useful features of private credit funding such as greater certainty of execution: Private lenders typically require fewer layers of internal approval compared with large or mid-sized banks and therefore can close transactions in weeks rather than months. Private loans may also feature enhanced flexibility in the loan terms, such as covenants or amortization schedules, which can be tailored deal by deal.
- Abnormal returns are the portion of returns not explained by overall market movements.
- See Fillat et al. (2025) and Berrospide et al. (2025) for more detailed analyses of the evolution of bank exposure to private credit firms.
- Berrospide et al. (2025) make this point explicitly.
Data Sources
BDC SEC filings (Forms 10-Q and 10-K); Federal Reserve Y-14Q; Senior Loan Officer Opinion Survey (April 2026); S&P Global/Haver Analytics.
References
Berrospide, José, Fang Cai, Siddhartha Lewis-Hayre, and Filip Zikes. 2025. “Bank Lending to Private Credit: Size, Characteristics, and Financial Stability Implications.” FEDS Notes. Washington: Board of Governors of the Federal Reserve System.
Fillat, José L., Mattia Landoni, John D. Levin, and J. Christina Wang. 2025. “Could the Growth of Private Credit Pose a Risk to Financial System Stability?” Federal Reserve Bank of Boston Current Policy Perspectives 25-8.

 About the Authors
José L. Fillat,
Federal Reserve Bank of Boston
José L. Fillat is a principal economist and policy advisor in the Federal Reserve Bank of Boston Research Department.
Email: Jose.Fillat@bos.frb.org
Leslie Sheng Shen,
Federal Reserve Bank of Boston
Leslie Sheng Shen is a principal economist in the Federal Reserve Bank of Boston Research Department.
Email: LeslieSheng.Shen@bos.frb.org
J. Christina Wang,
Federal Reserve Bank of Boston
J. Christina Wang is a principal economist and policy advisor in the Federal Reserve Bank of Boston Research Department.
Email: Christina.Wang@bos.frb.org
Acknowledgments
The authors thank Liam Chentoufi for his excellent research assistance.
Resources
Site Topics
Keywords
- private credit ,
- business development companies ,
- financial stability ,
- credit risk ,
- payment-in-kind ,
- middle-market lending
JEL Codes
- G23 ,
- G24 ,
- G28 ,
- G32
Citation
Fillat José L., Leslie Sheng Shen, and J. Christina Wang. 2026. “Early Warning Signals in Private Credit? What BDC Portfolios Reveal about Emerging Risks.” Federal Reserve Bank of Boston Current Policy Perspectives 26-6.