Pricing in the New Year: Why Inflation Behaves Differently at the Start of the Year 


The views expressed herein are solely those of the authors and should not be reported as representing the views of the Federal Reserve Bank of Boston, the principals of the Board of Governors, or the Federal Reserve System.
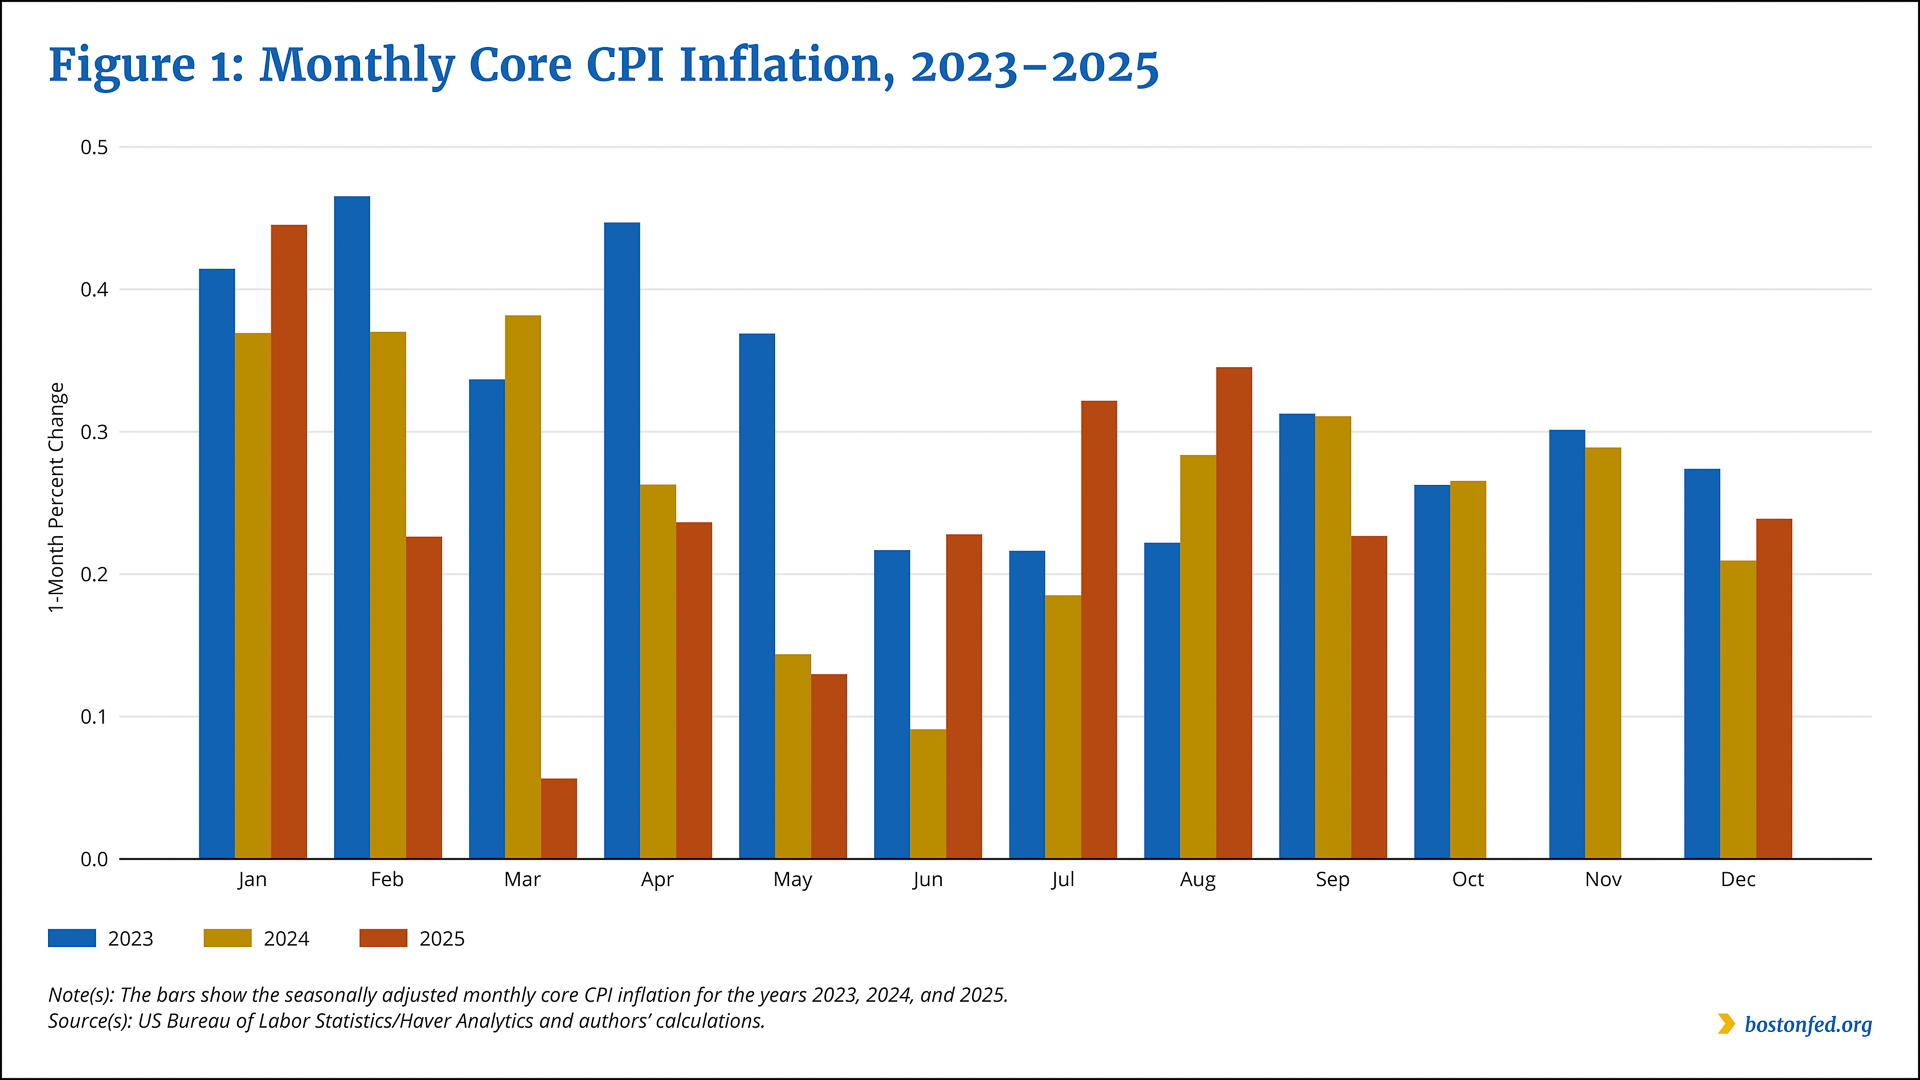
Fireworks rang in the New Year, and recently, they also have signaled that higher inflation was on the way. Each year from 2023 through 2025, monthly inflation,1 as measured by the US Bureau of Labor Statistics (BLS) consumer price index (CPI), was generally higher in January compared with the rest of the year. In 2023 and 2024, monthly inflation also was elevated in February and March. Figure 1 shows these dynamics in the core CPI, which excludes the volatile food and energy categories.2 The behavior of January inflation is especially relevant now as markets and policymakers remain watchful for changes to underlying inflation. The BLS is scheduled to release the January 2026 CPI on February 11.
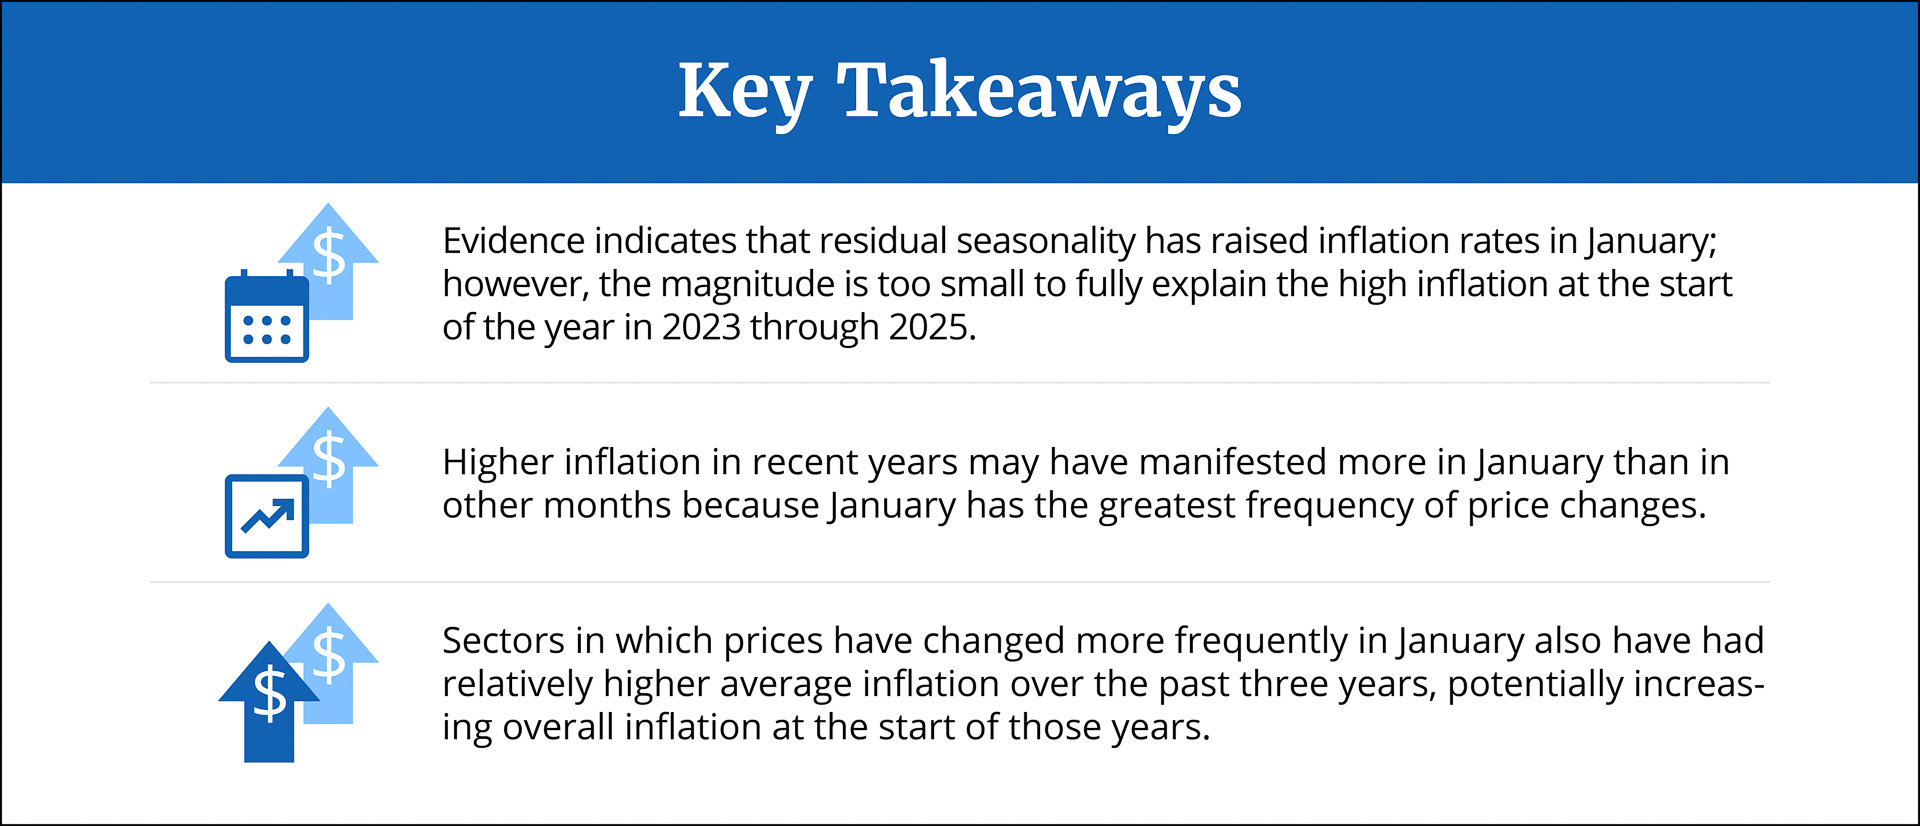
We present three reasons that collectively may explain why inflation has been especially high at the beginning of recent calendar years. First, residual seasonality—seasonal pricing patterns that remain even after the CPI has been adjusted to eliminate such patterns—may have affected January inflation in recent years. Second, according to data from the past quarter-century, prices are changed more often at the start of the year than at other times, which may exacerbate January inflation during periods of elevated inflation, such as the past few years. Third, business sectors with the strongest tendency to change prices at the start of the year have experienced particularly high inflation in recent years, which may have increased overall January inflation in those years.
Reason No. 1: Residual Seasonality Has Had an Impact on January Inflation
The BLS produces two versions of the CPI each month. One is seasonally adjusted based on pricing patterns from previous years; the other remains unadjusted.3 By seasonally adjusting the CPI to remove common price fluctuations that repeat in the same month or season each year, the BLS enables the index to present a clearer picture of underlying inflation dynamics. For example, airline ticket prices typically rise in the summer travel season when demand increases and therefore need to be seasonally adjusted downward before conclusions can be drawn about underlying trends in those prices. However, seasonal adjustment is a challenging process and can result in residual seasonality.
Sign up for Research Department Updates.
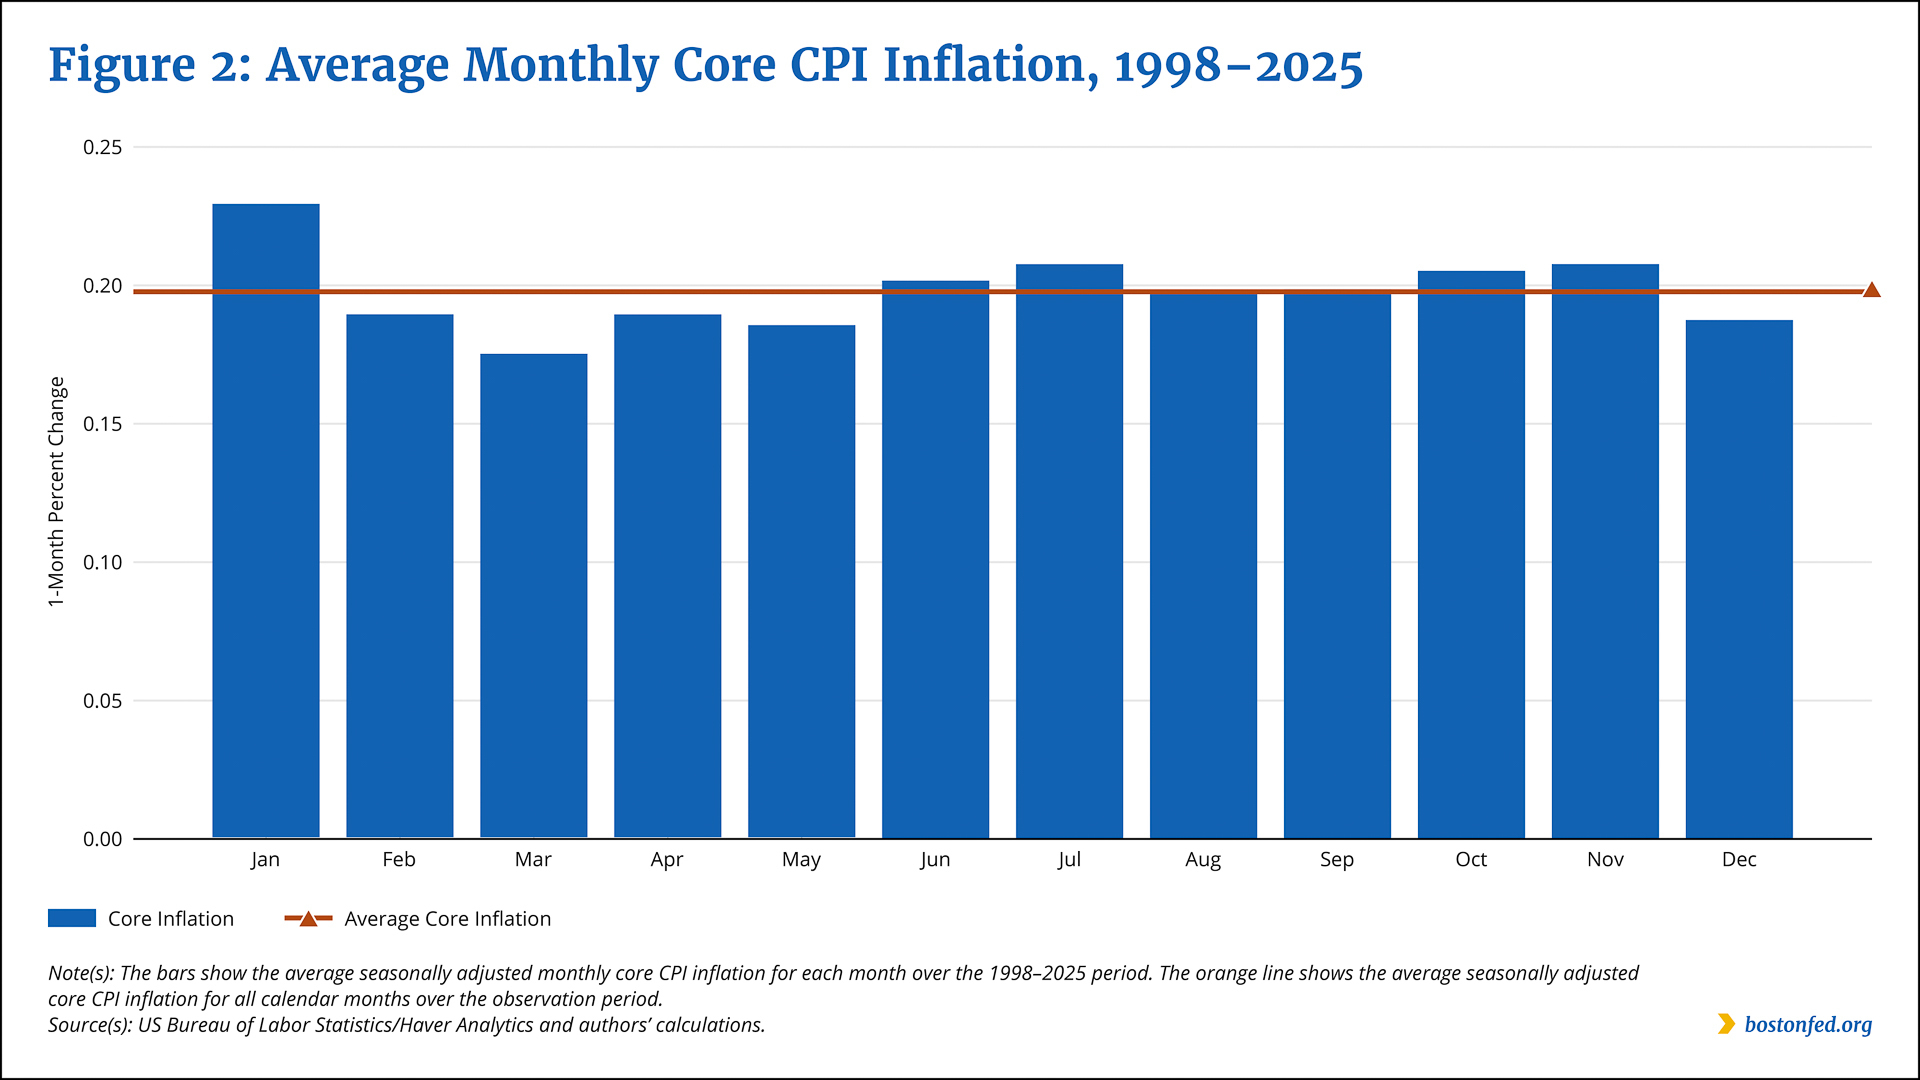
As shown in Figure 2, we examine the degree to which residual seasonality may have affected monthly inflation during the 1998–2025 period by first computing each calendar month’s average seasonally adjusted inflation rate for that period (the blue bars). We then compare each of those rates to the average seasonally adjusted inflation rate for all calendar months over the observation period (the orange line).
If residual seasonality had no effect on inflation during the observation period—that is, if seasonal adjustments had eliminated all seasonal fluctuations—the average seasonally adjusted inflation rate should be, on average, the same for each calendar month, in which case the blue bars would all top out at the orange line. However, January’s average inflation rate is higher than those of the other months. The rate is 0.23 percent, which is 0.03 percentage point higher than the average rate of 0.20 percent for all calendar months. The higher rate suggests that residual seasonality has raised inflation in January. However, the magnitude of residual seasonality is too small to fully explain the high inflation at the start of the year in 2023 through 2025, indicating that other factors also have played roles.
Reason No. 2: Prices Have Changed More Often in January Than in Any Other Month
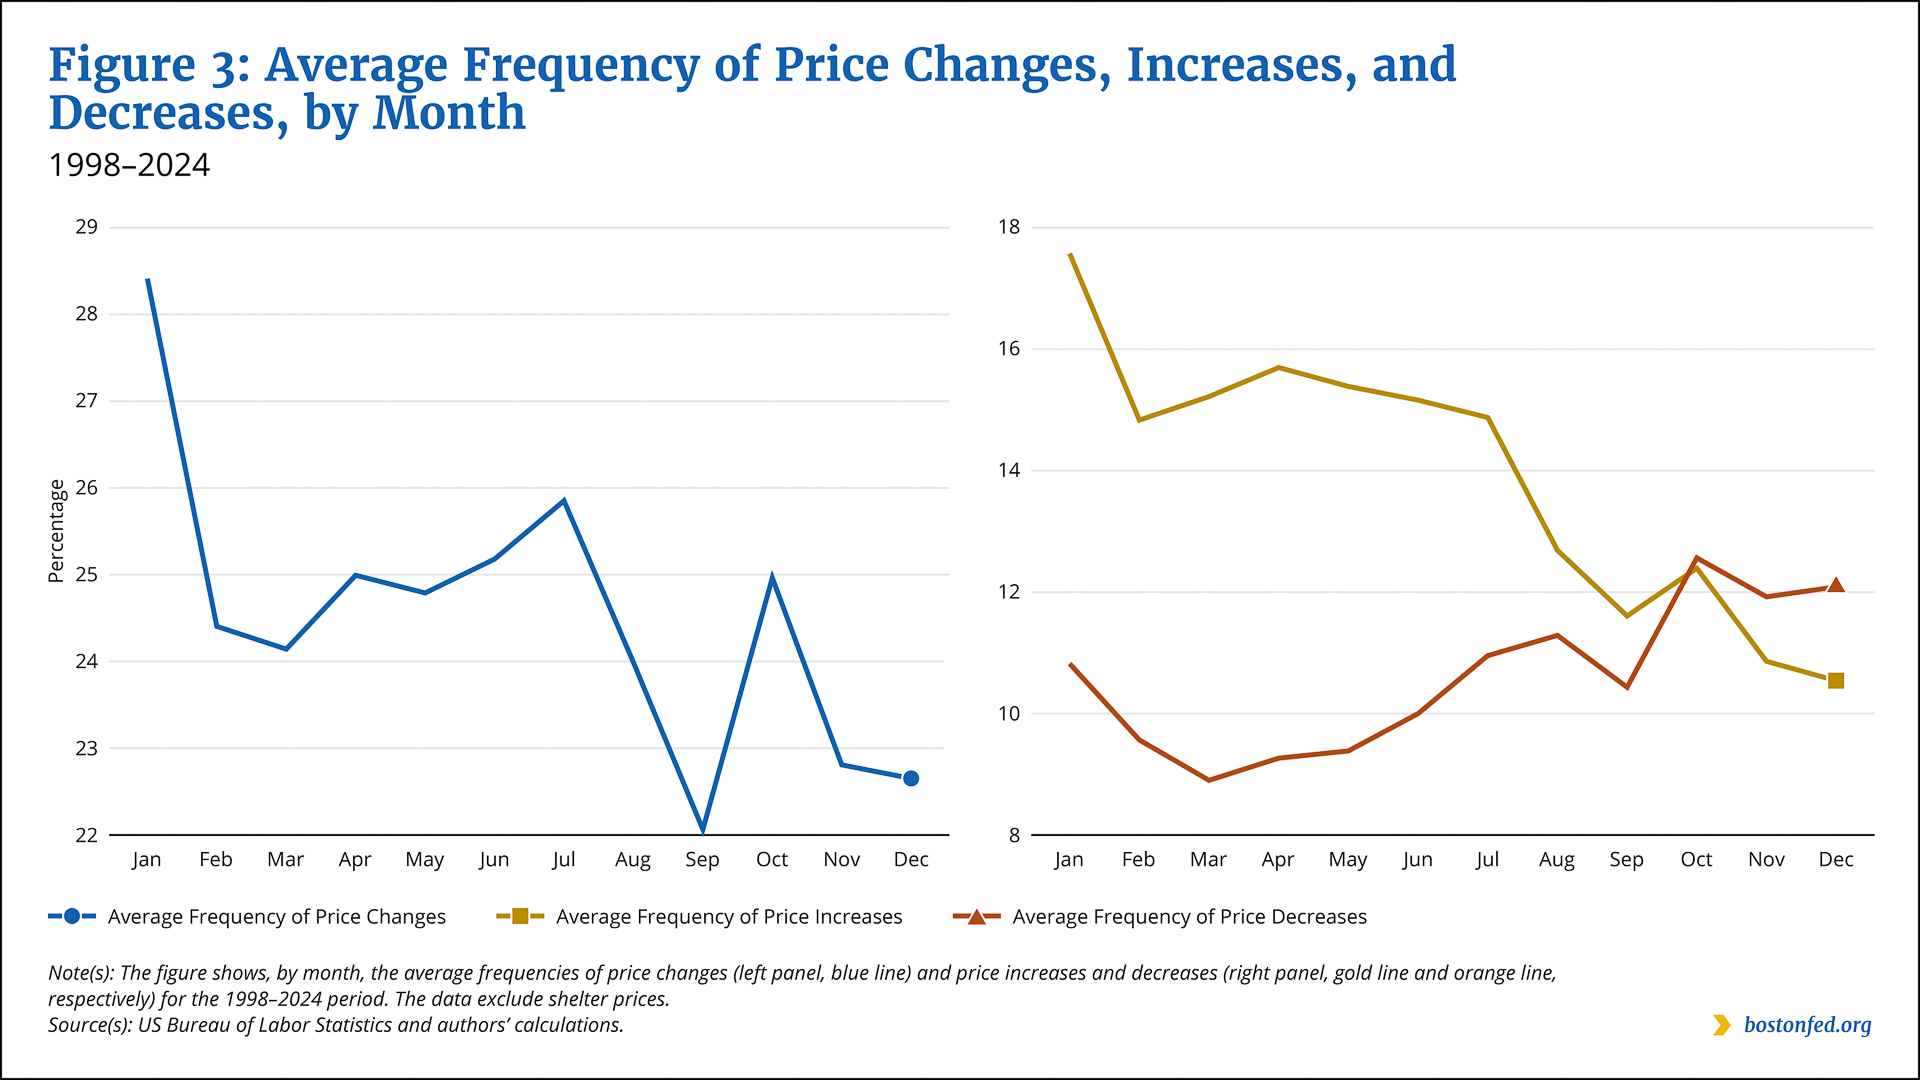
A second possible explanation for why January inflation has been elevated in recent years involves monthly differences in the frequency of price changes, which is defined as the percentage of prices in a given month that are different from what they were the preceding month.4 We examine the frequency of price changes from 1998 through 2024 using confidential BLS price microdata. The left panel of Figure 3 shows the average frequency of price changes for each calendar month during that period. January had the greatest frequency by far; every year, on average, more than 28 percent of prices changed from what they were in December. The figure also shows the frequency dipping in the second half of the year.
During periods of elevated inflation, such as 2023 through 2025, prices are likely to rise even higher than usual when they change, thus exacerbating inflation in those months when prices change more often, including January. Conversely, during periods when inflation is low, prices are likely to rise only minimally or even fall when they change. As a result, inflation is likely to be even lower in months when prices change more often. Note that seasonal adjustment is intended to capture only average differences in inflation across months, not differences that vary with the level of inflation. Therefore, in recent years, January inflation may have been higher than other months due to the combination of a greater frequency of price changes and the amplifying effects of the period’s elevated inflation.
The difference in the frequency of price changes across months becomes even starker when we break it down into price increases and decreases over the 1998–2024 period, as shown in the right panel of Figure 3. The frequency of price increases was greatest in January and declined substantially through the calendar year, whereas the frequency of price decreases generally was lower at the start of the year and grew moderately through the end of the year.
Reason No. 3: Inflation Has Been Higher in Sectors That Tend to Change Prices at the Start of the Year
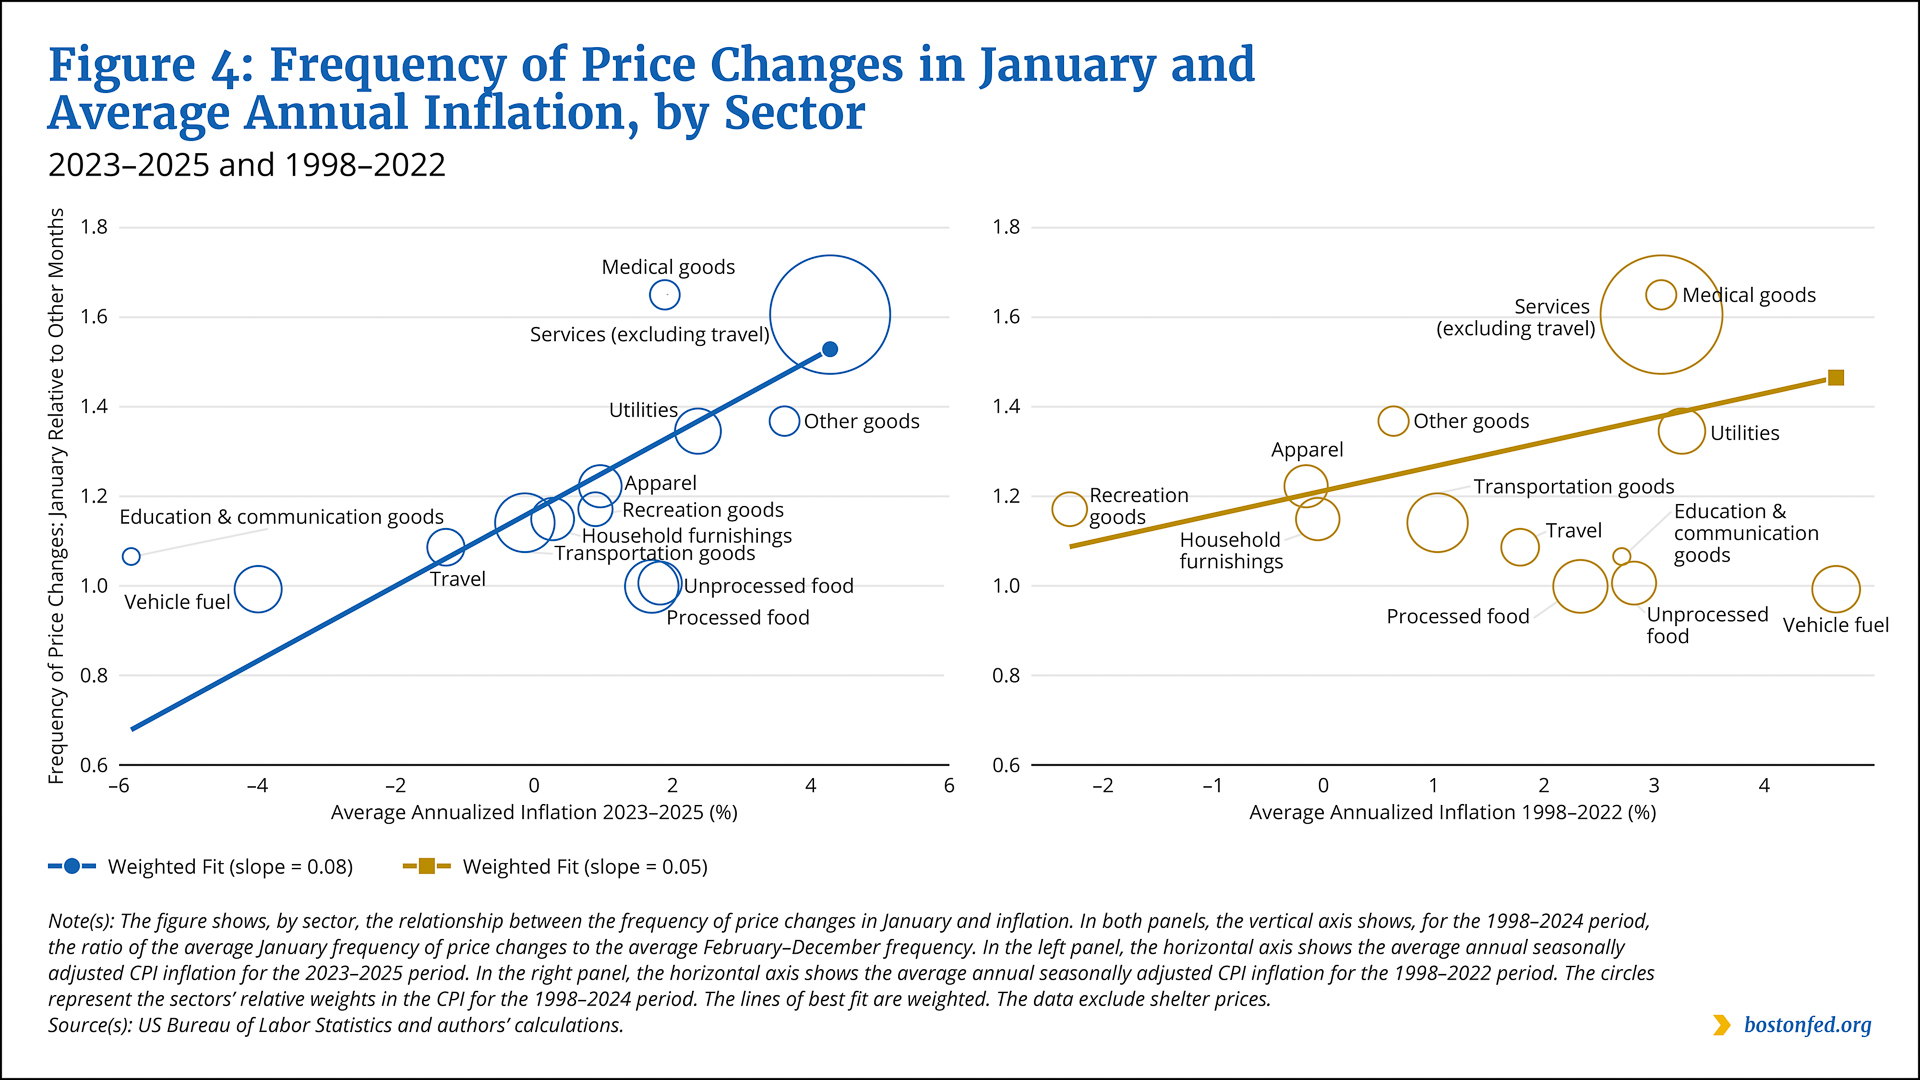
A third possible explanation for the new-year inflation dynamics involves compositional effects; that is, the higher January inflation may be due to the type of items that have changed prices at the start of the year. Figure 4 shows the core CPI broken down into different business sectors. The vertical axis in each panel shows, for each sector for the 1998–2024 period, the average ratio of the frequency of price changes in January to the frequency of price changes in other months. Some sectors, notably medical goods and services (excluding travel), had a much greater frequency of price changes in January than in other months.
Inflation is likely to be higher in a particular month than in other months if the sectors that change their prices in that month experience relatively high inflation. We investigate whether this was the case for January for the past three years by comparing the average annual inflation rate for all months from 2023 through 2025 for each sector with that sector’s average January frequency of price changes relative to the rest of the year (for the 1998–2024 period). The results are presented in the left panel of Figure 4, which shows a clear pattern of sectors with a relatively high frequency of price changes in January also having had relatively higher average inflation over the past three years. Indeed, the line of best fit (the diagonal blue line in the panel), which derives from a regression analysis and reflects the correlation between the variables, shows a strongly positive slope.
When we analyze the relationship between sectors’ frequency of price changes and inflation for the 1998–2022 period (the right panel of Figure 4; the diagonal gold line is the line of best fit), we find that it also is positive, but it is weaker than for the 2023–2025 period. This suggests that seasonal adjustment will remove seasonal patterns associated with compositional effects that are smaller than what we have observed recently. Thus, the stronger compositional effects in recent years may also help to explain why January inflation was notably high the past three years.
Endnotes
- The monthly inflation rate is the percentage change in inflation over a month. For example, a January monthly inflation rate of 0.23 percent means that inflation, as measured by the CPI, grew 0.23 percent since December.
- We exclude these volatile components to gain a clearer view of the underlying inflation dynamics.
- For more information about CPI seasonal adjustment, visit https://www.bls.gov/cpi/seasonal-adjustment/.
- We construct price-change frequency using confidential BLS price microdata underlying the CPI. We consider only the 1998–2024 period. This measure does not include shelter prices, for which microdata were not available. We discuss these data in more detail in the forthcoming paper “The Price Change Statistics We’ve Weighted For.”

 About the Authors
Christopher D. Cotton,
Federal Reserve Bank of Boston
Christopher D. Cotton is a senior economist in the Federal Reserve Bank of Boston Research Department.
Email: Christopher.Cotton@bos.frb.org
Anna Durall is a senior research associate in the Federal Reserve Bank of Boston Research Department.
Vaishali Garga,
Federal Reserve Bank of Boston
Vaishali Garga is a principal economist in the Federal Reserve Bank of Boston Research Department.
Email: Vaishali.Garga@bos.frb.org
Resources
Site Topics
Keywords
- residual seasonality ,
- January inflation ,
- frequency of price changes
JEL Codes
- E31 ,
- E32 ,
- E52
Citation
Cotton, Christopher D., Anna Durall, and Vaishali Garga. 2026. “Pricing in the New Year: Why Inflation Behaves Differently at the Start of the Year.” Federal Reserve Bank of Boston Current Policy Perspectives 26-1.