New England Economic Conditions through July 11, 2023 


Key Takeaways
- New England saw notable employment growth in May 2023, adding 11,600 jobs during the month and continuing to exceed its pre-pandemic employment benchmark. Employment in the leisure and hospitality sector remained 5.7 percent below its February 2020 level, but over the past year, the sector has helped drive overall employment growth in New England.
- Unemployment in New England was 3.0 percent in May 2023, which was below the national rate of 3.7 percent and represents a year-over-year decline of 0.5 percentage point. Labor force participation in the region outpaced the corresponding rate in the nation, although both rates remained relatively stationary.
- Year-over-year price growth for May 2023 was slower in New England (2.4 percent) compared with the United States overall (4.0 percent). Price growth in the region was driven by rising food and shelter prices, as all other product categories experienced a decline.
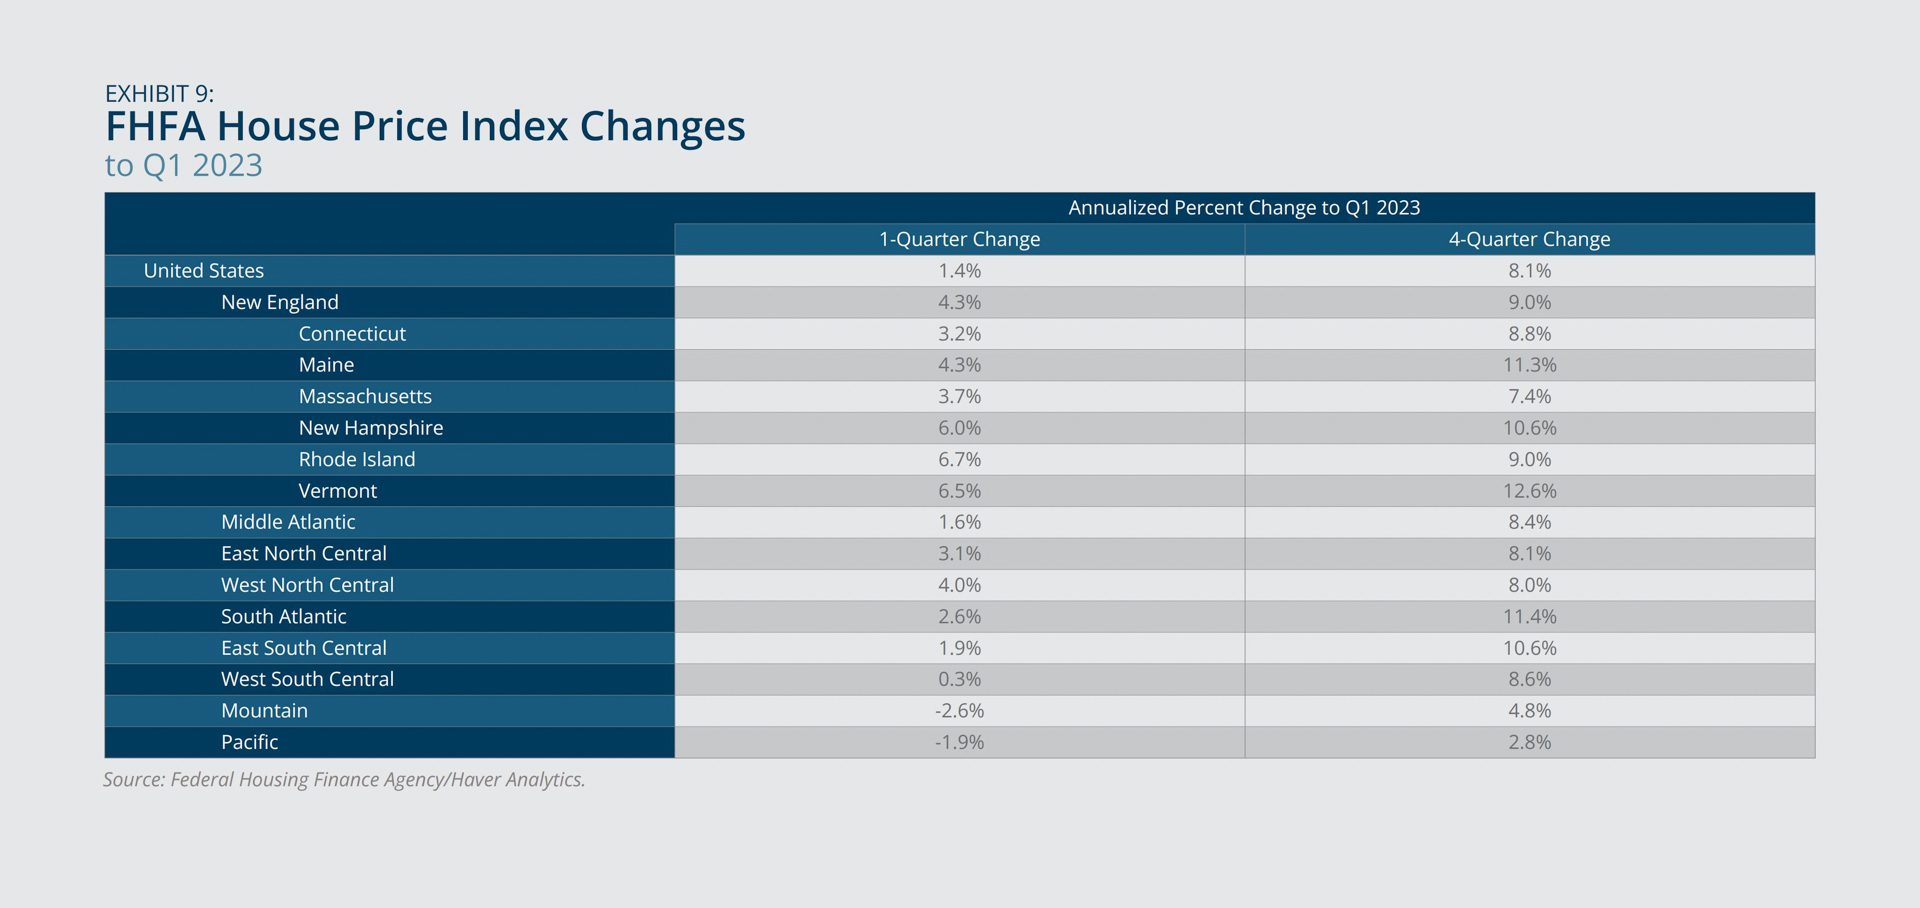
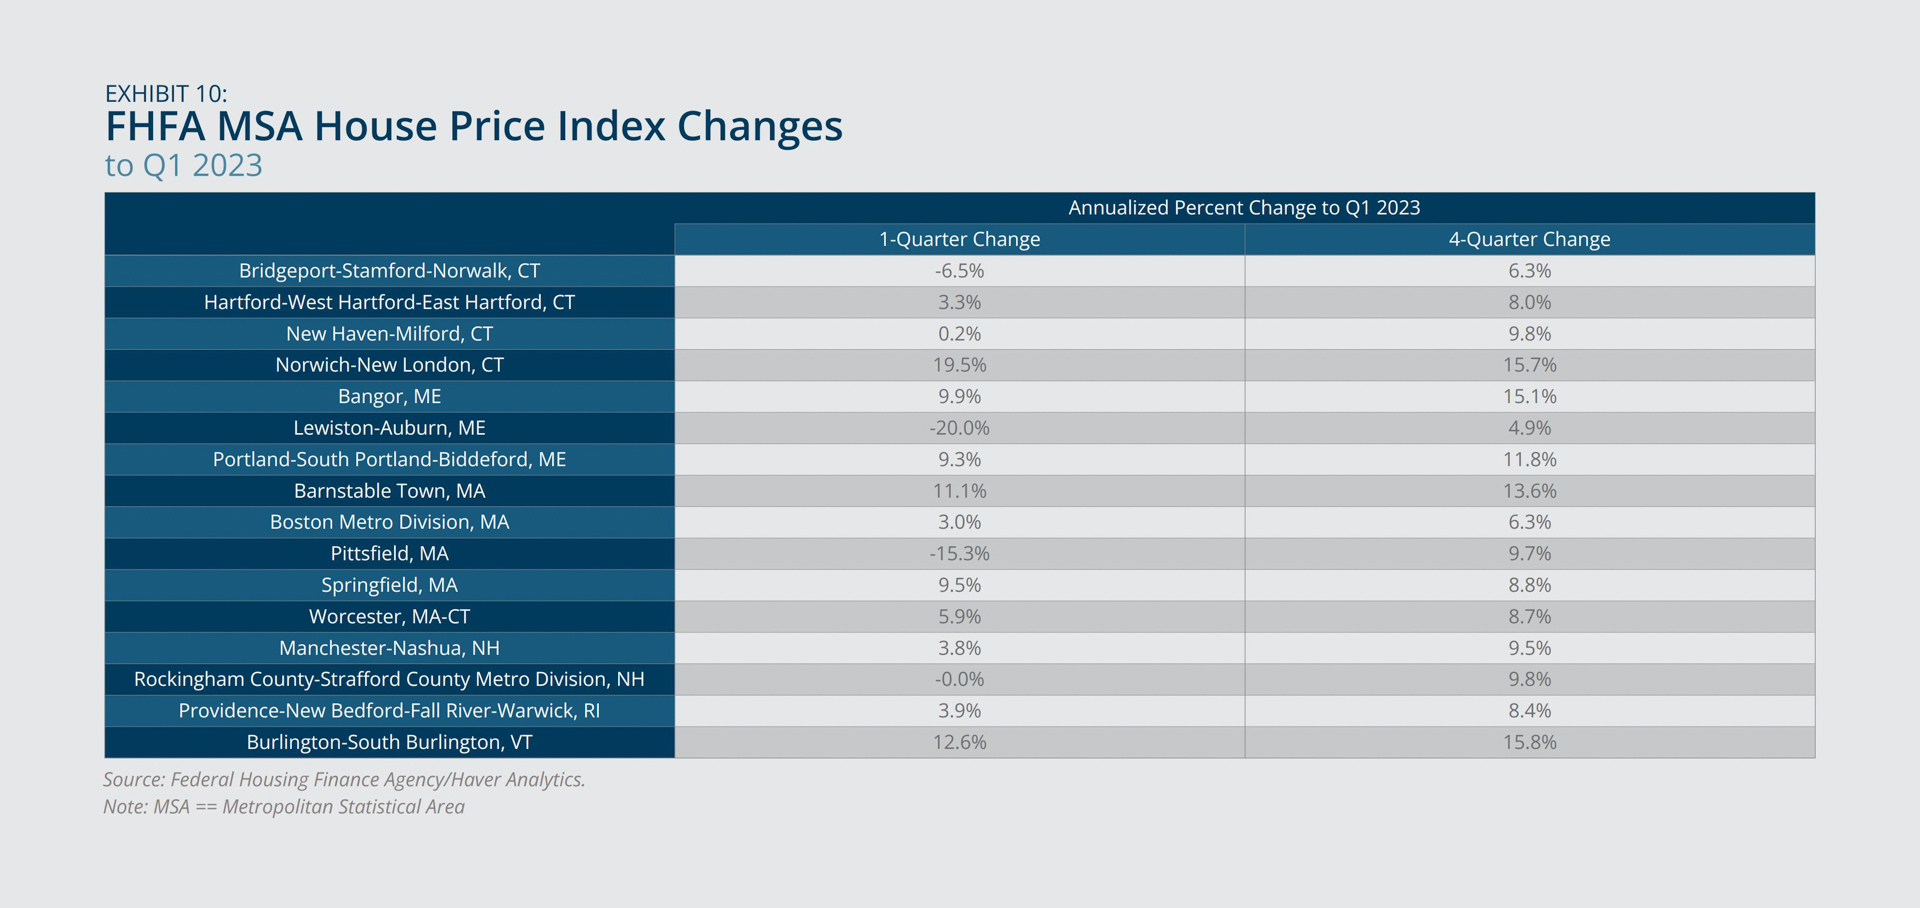
- New England house prices continued to increase year-over-year at the highest rates in Maine and Vermont and at the lowest rate in Massachusetts in the first quarter of 2023. In addition to this disparity between the north and south of the region, housing prices varied notably within states&mnash;for instance, among Maine metropolitan areas, ranging from 4.9 percent in Lewiston-Auburn to 15.1 percent in Bangor.
Sign up for new research and data on the New England economy.
Payroll Employment
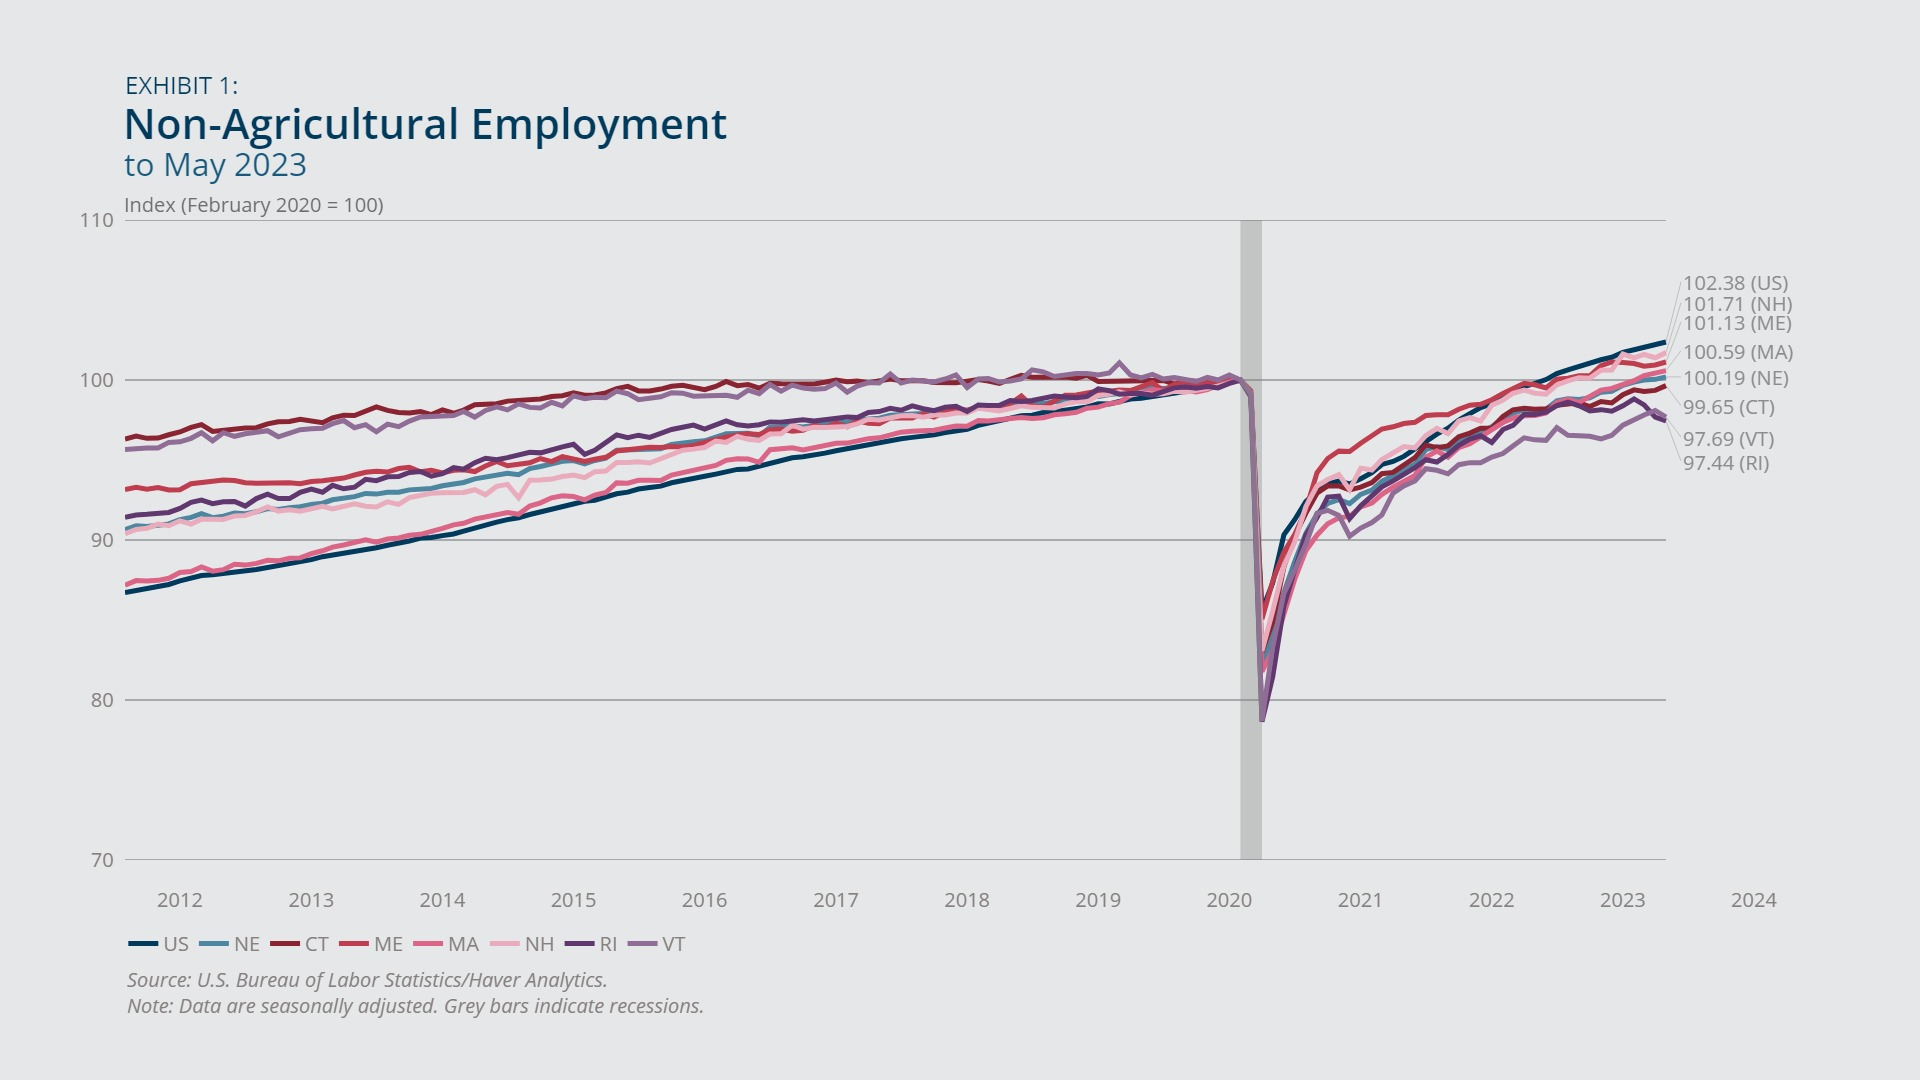
- The region exhibited notable employment growth in May 2023, adding 11,600 jobs during the month.
- Job growth in the leisure and hospitality sector is still recovering from the pandemic, although job growth in the sector over the past year has helped drive overall employment growth in New England.
Payroll employment in New England grew notably in May 2023, adding 11,600 jobs during the month. With this growth, the region continued to exceed its pre-pandemic employment benchmark (Exhibit 1). Employment growth since February 2020 remained slower in the region (0.2 percent) than in the nation as a whole (2.5 percent); however, the growth disparity was smaller over the past year (not shown). Employment in New Hampshire, Maine, and Massachusetts has grown beyond its pre-pandemic benchmarks. In Connecticut, Vermont, and Rhode Island, employment has not yet returned to its February 2020 levels, although employment in Connecticut is closely approaching its pre-pandemic benchmark (0.4 percent below the February 2020 level).
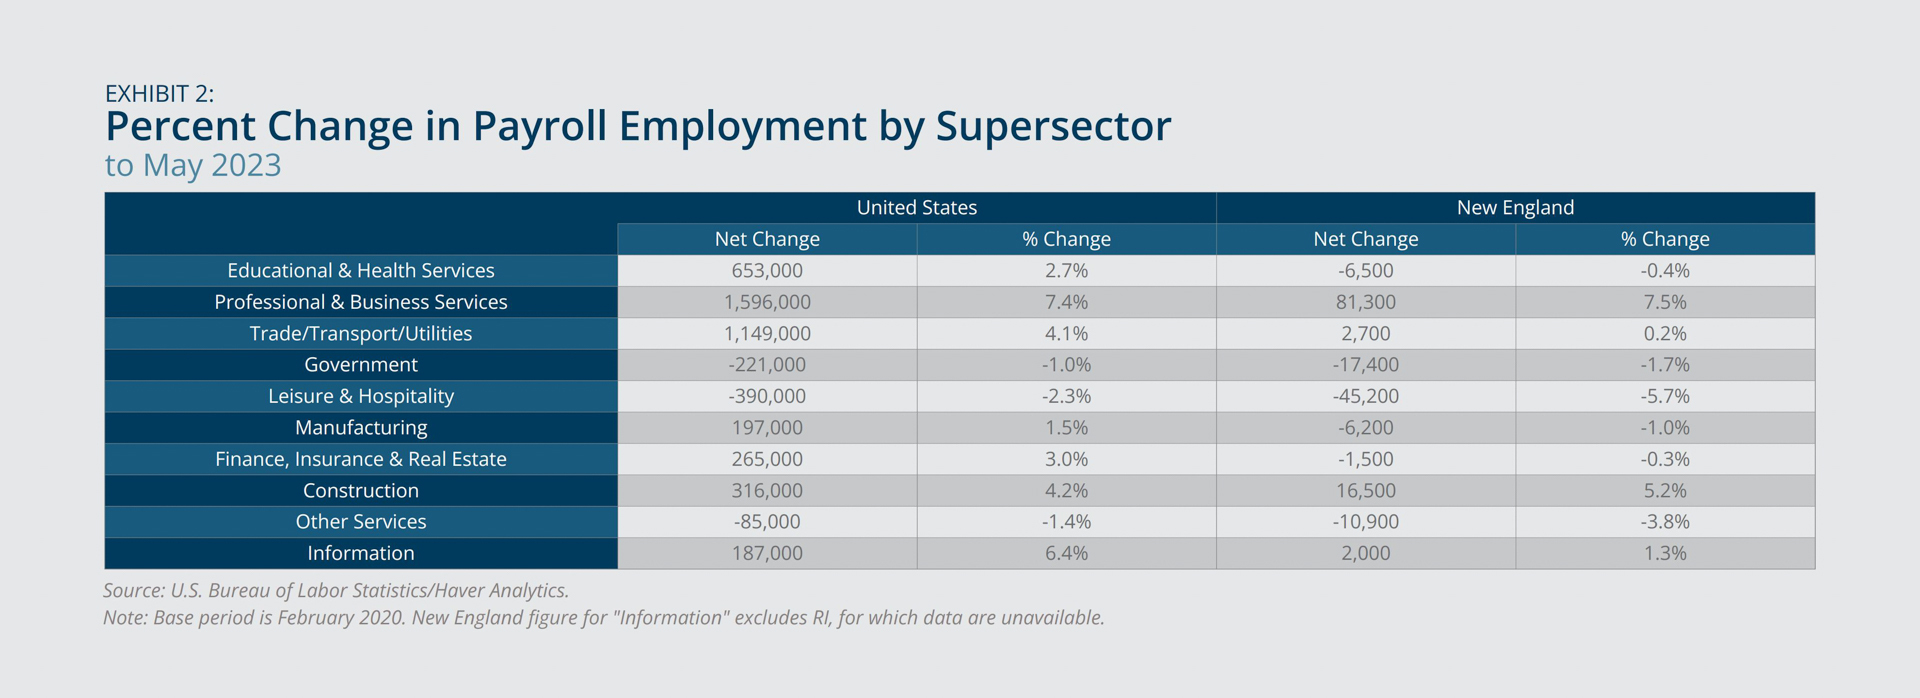
Employment growth in New England differed across sectors (Exhibit 2). The sector reflecting professional and business services exhibited the largest job growth since the start of the pandemic (7.5 percent), followed by the construction and information sectors (5.2 percent and 1.3 percent, respectively). However, over the past year, education and health services exhibited the largest job growth in the region, followed by professional and business services and leisure and hospitality (not shown). In contrast, employment in leisure and hospitality in May 2023 remained below its February 2020 benchmark (5.7 percent lower) and continued to represent the largest shortfall among sectors.

Federal Reserve Bank of Boston
Federal Reserve Bank of Boston
Unemployment and Labor Force Participation
- The low unemployment rate in New England was less than the US rate.
- Labor force participation in the region outpaced the national rate in May, but it has remained relatively stationary.
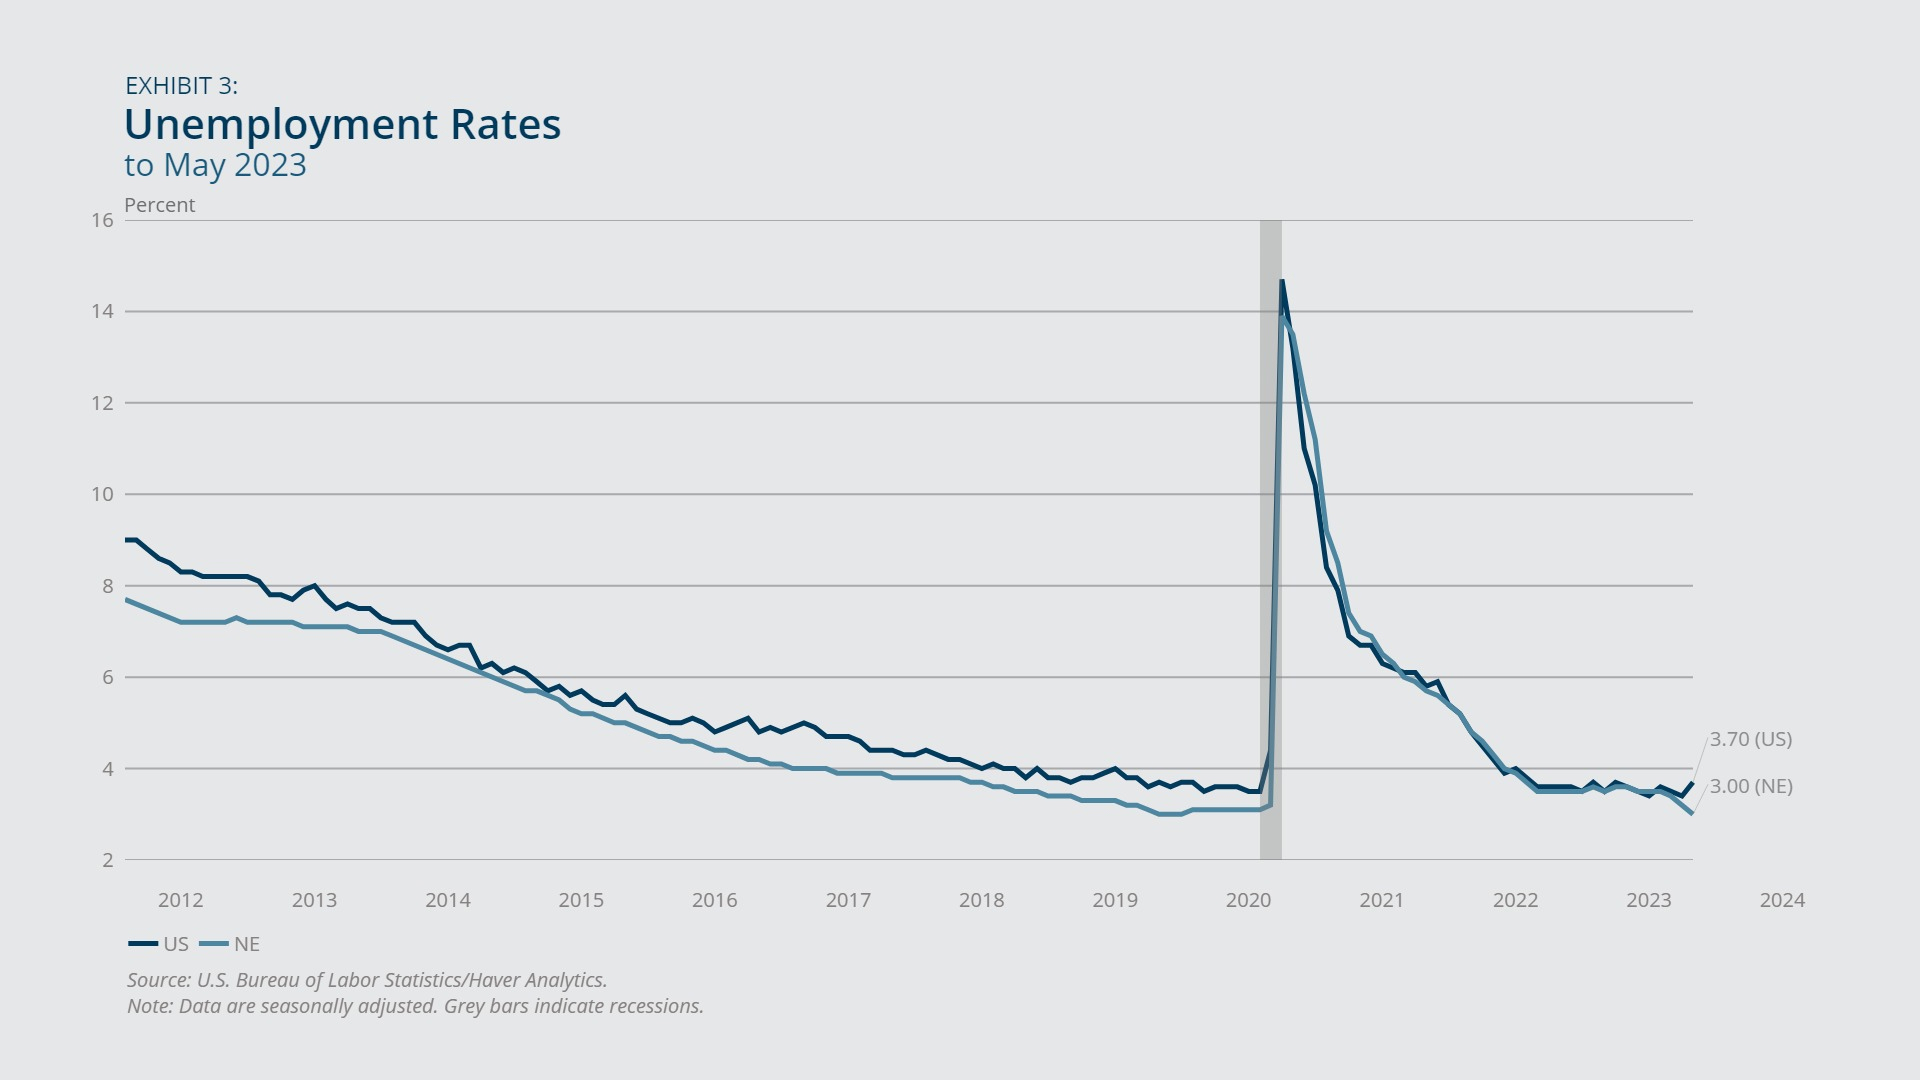
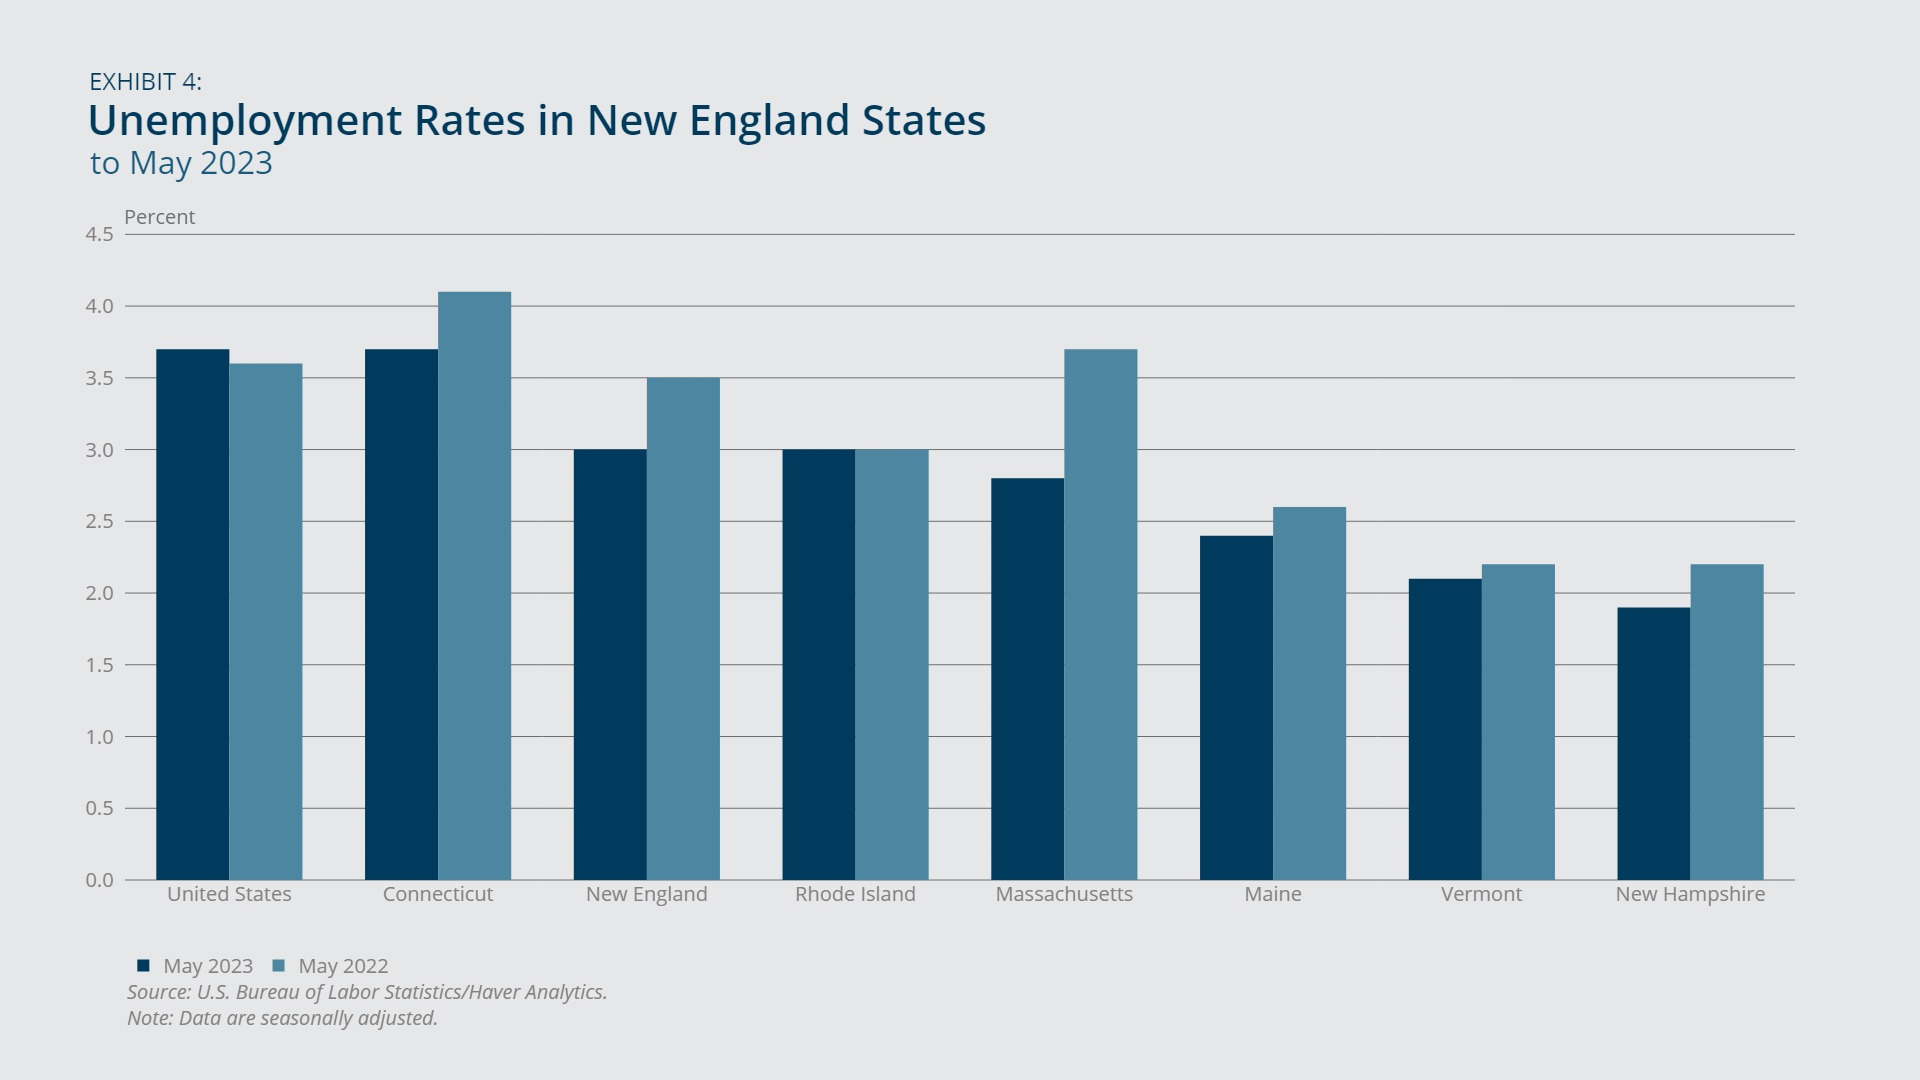
Unemployment in New England was 3.0 percent in May 2023, reflecting a year-over-year decline of 0.5 percentage point and falling below the concurrent national rate of 3.7 percent (Exhibit 3). All New England states experienced similar labor market tightness (Exhibit 4). New Hampshire had the region’s lowest unemployment rate (1.9 percent), while Connecticut had the highest rate (3.7 percent).
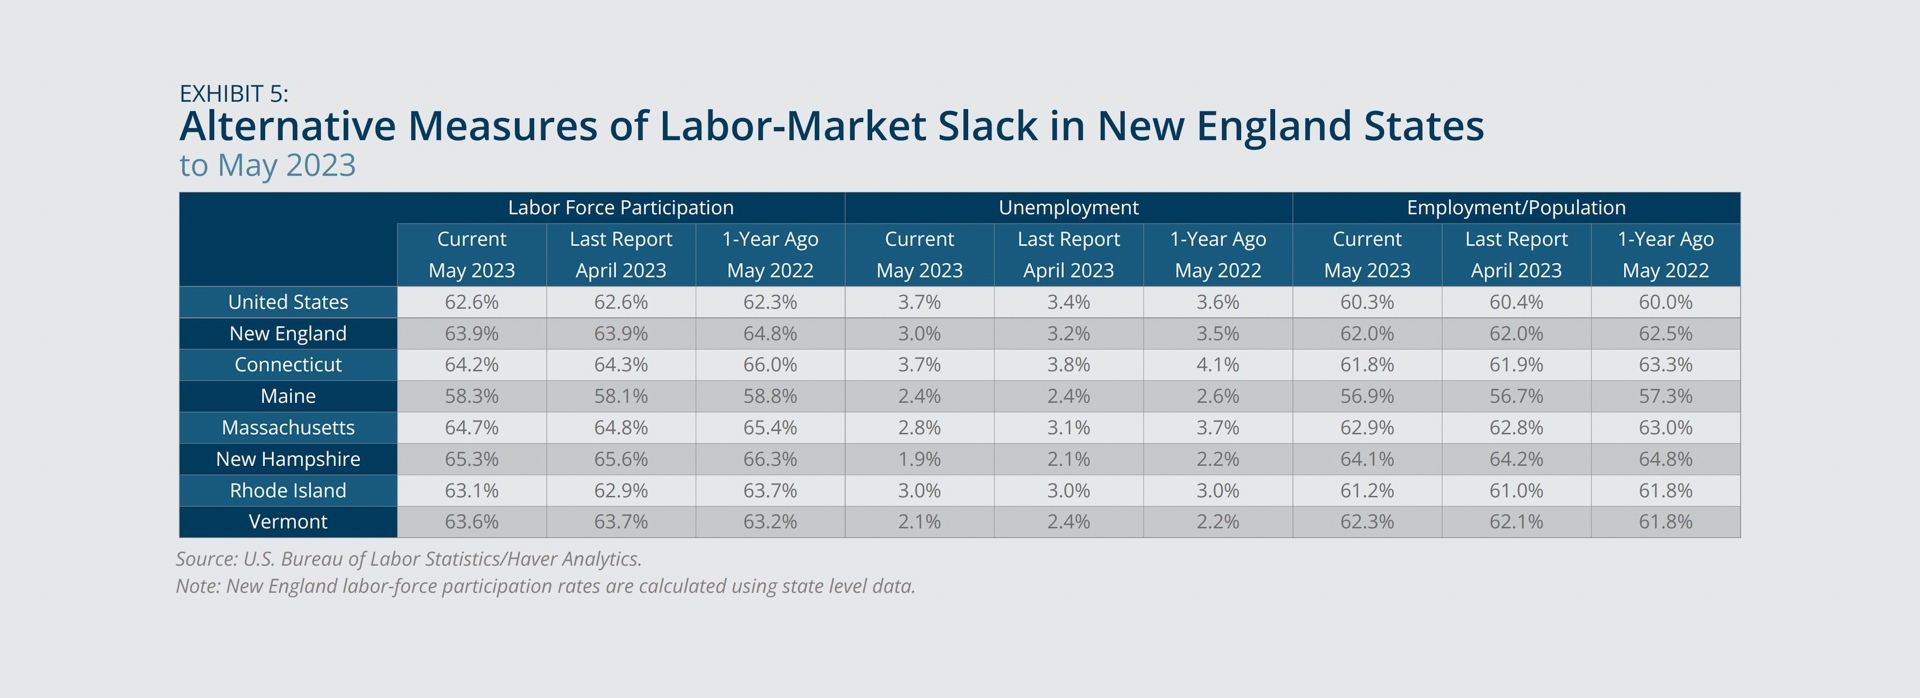
New England’s labor force participation rate of 63.9 percent in May 2023 exceeded the US rate of 62.6 percent. The region’s employment-to-population ratio also was higher than the nation’s (Exhibit 5). For both New England and the United States, participation rates remained unchanged from April 2023, and year-over-year growth was relatively moderate (an increase of 0.3 percentage point in the US rate and a decrease of 0.9 percentage point in the New England rate).
Federal Reserve Bank of Boston
Federal Reserve Bank of Boston
Federal Reserve Bank of Boston
Labor Costs
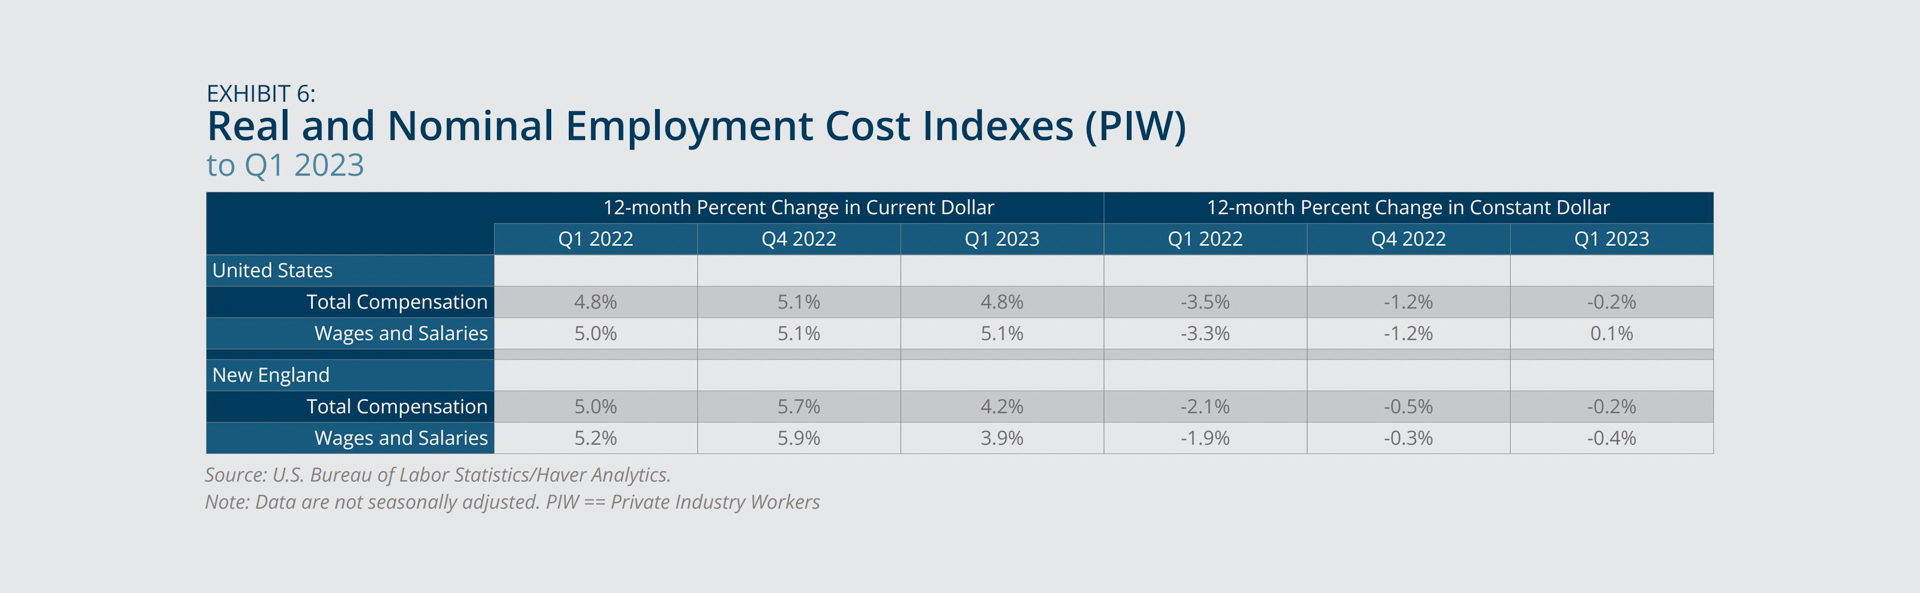
- While real labor costs fell for private-industry workers in New England, this decline was much smaller in size compared with one year prior.
In the first quarter of 2023, New England experienced year-over-year growth in nominal labor costs for private-industry workers, although this growth rate has declined since the first quarter of 2022 (Exhibit 6). While the region saw nominal growth in wages and salaries (3.9 percent) and total compensation (4.2 percent), accounting for inflation results in year-over-year decreases in those measures for the region’s private-industry workers (–0.4 percent for wages and salaries and –0.2 percent for total compensation). However, this decline in real labor costs is much smaller in size compared with the first quarter of 2022, reflecting falling inflation rates. This trend is also evident for the nation, with real wages and salaries showing positive growth in the first quarter of 2023 (0.1 percent). Similar metrics measured more recently also show positive growth.1
Federal Reserve Bank of Boston
Inflation
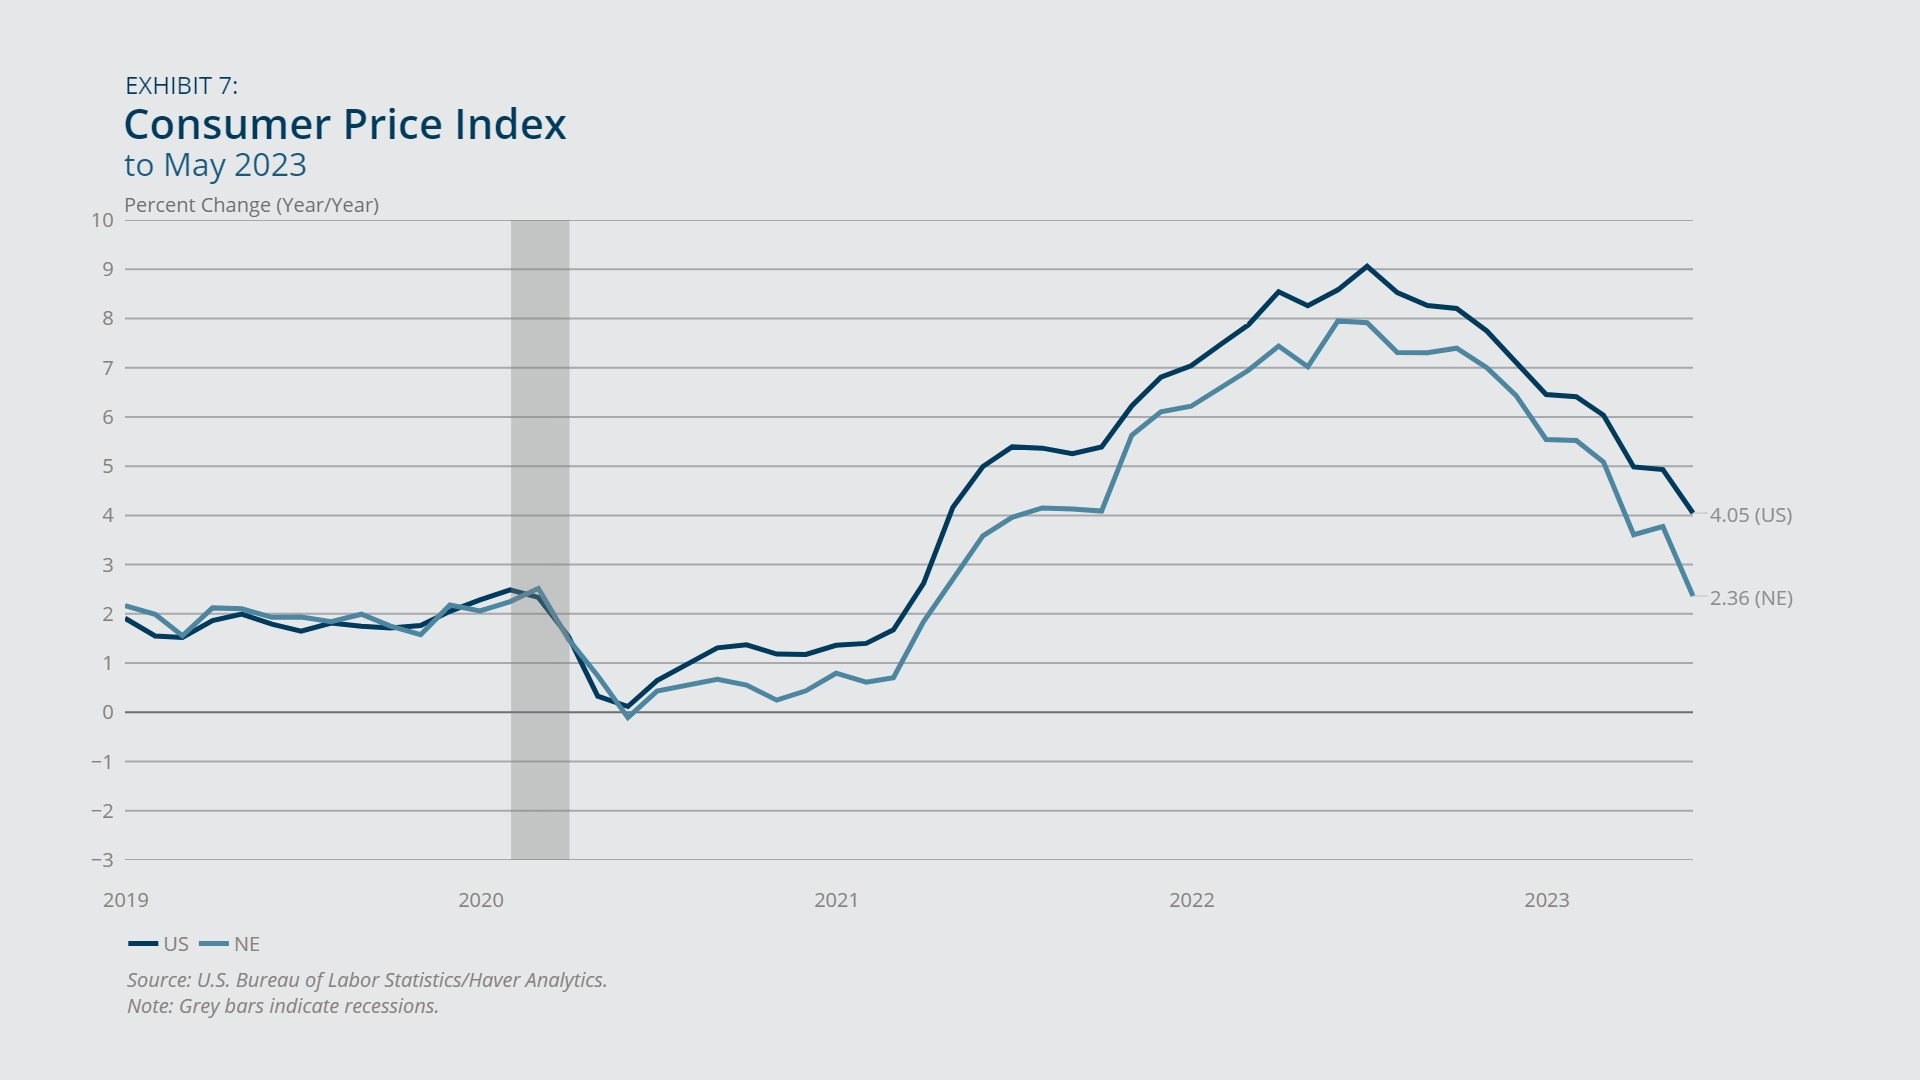
- Inflation was lower in New England than in the United States as a whole.
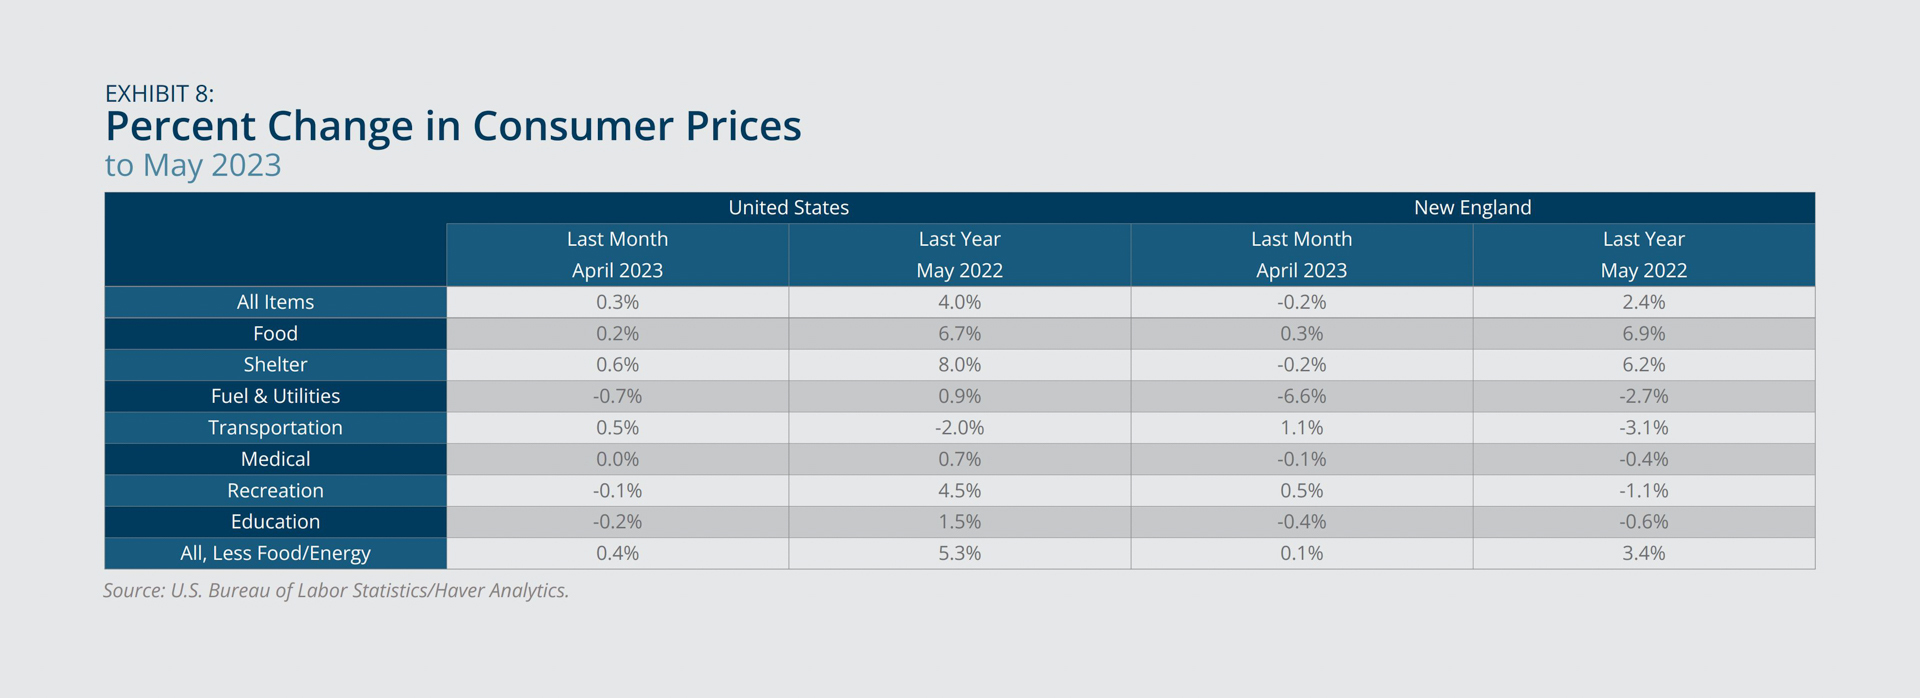
- Price growth in the region was driven by increases in food and shelter prices.
In May 2023, the inflation rate based on the Consumer Price Index was lower in New England compared with the United States, with year-over-year price growth of 2.4 percent versus 4.0 percent (Exhibit 7). Annual growth rates declined in May 2023 for the region (–1.4 percentage point) and the nation (–0.9 percentage point), following the general trend that began in the second half of 2022. Price growth in the region was driven by rising food and shelter prices, as all other product categories experienced a decline, especially transportation and fuel and utilities (Exhibit 8). In contrast, all product categories in the nation except for transportation experienced positive price growth. Core inflation in New England (3.4 percent) surpassed the overall inflation rate, reflecting the influence of climbing shelter prices.
Federal Reserve Bank of Boston
Federal Reserve Bank of Boston
House Prices
- New England experienced higher annual house-price growth compared with the nation.
- House-price growth was highest in the north of the region and lowest in the south.
House prices, as measured by the Federal Housing Finance Agency House Price Index, increased year-over-year for New England in the first quarter of 2023 (9.0 percent), exceeding the corresponding national rate (8.1 percent) (Exhibit 9). Among the region’s states, house-price growth was highest in Vermont and Maine and lowest in Massachusetts, reflecting a disparity between the north and south of New England that differs from historical trends. Among all US states and Washington, DC, the house-price growth in Vermont and Maine was ranked in the top 10 (fourth and eight, respectively), while growth in Massachusetts ranked 35th (not shown).
Notable additional variation in house-price growth occurred within states, across metropolitan areas (Exhibit 10). For instance, in Maine, house-price growth ranged from 4.9 percent in the Lewiston-Auburn metropolitan area to 15.1 percent in the Bangor metropolitan area.
Federal Reserve Bank of Boston
Federal Reserve Bank of Boston
Consumer Confidence
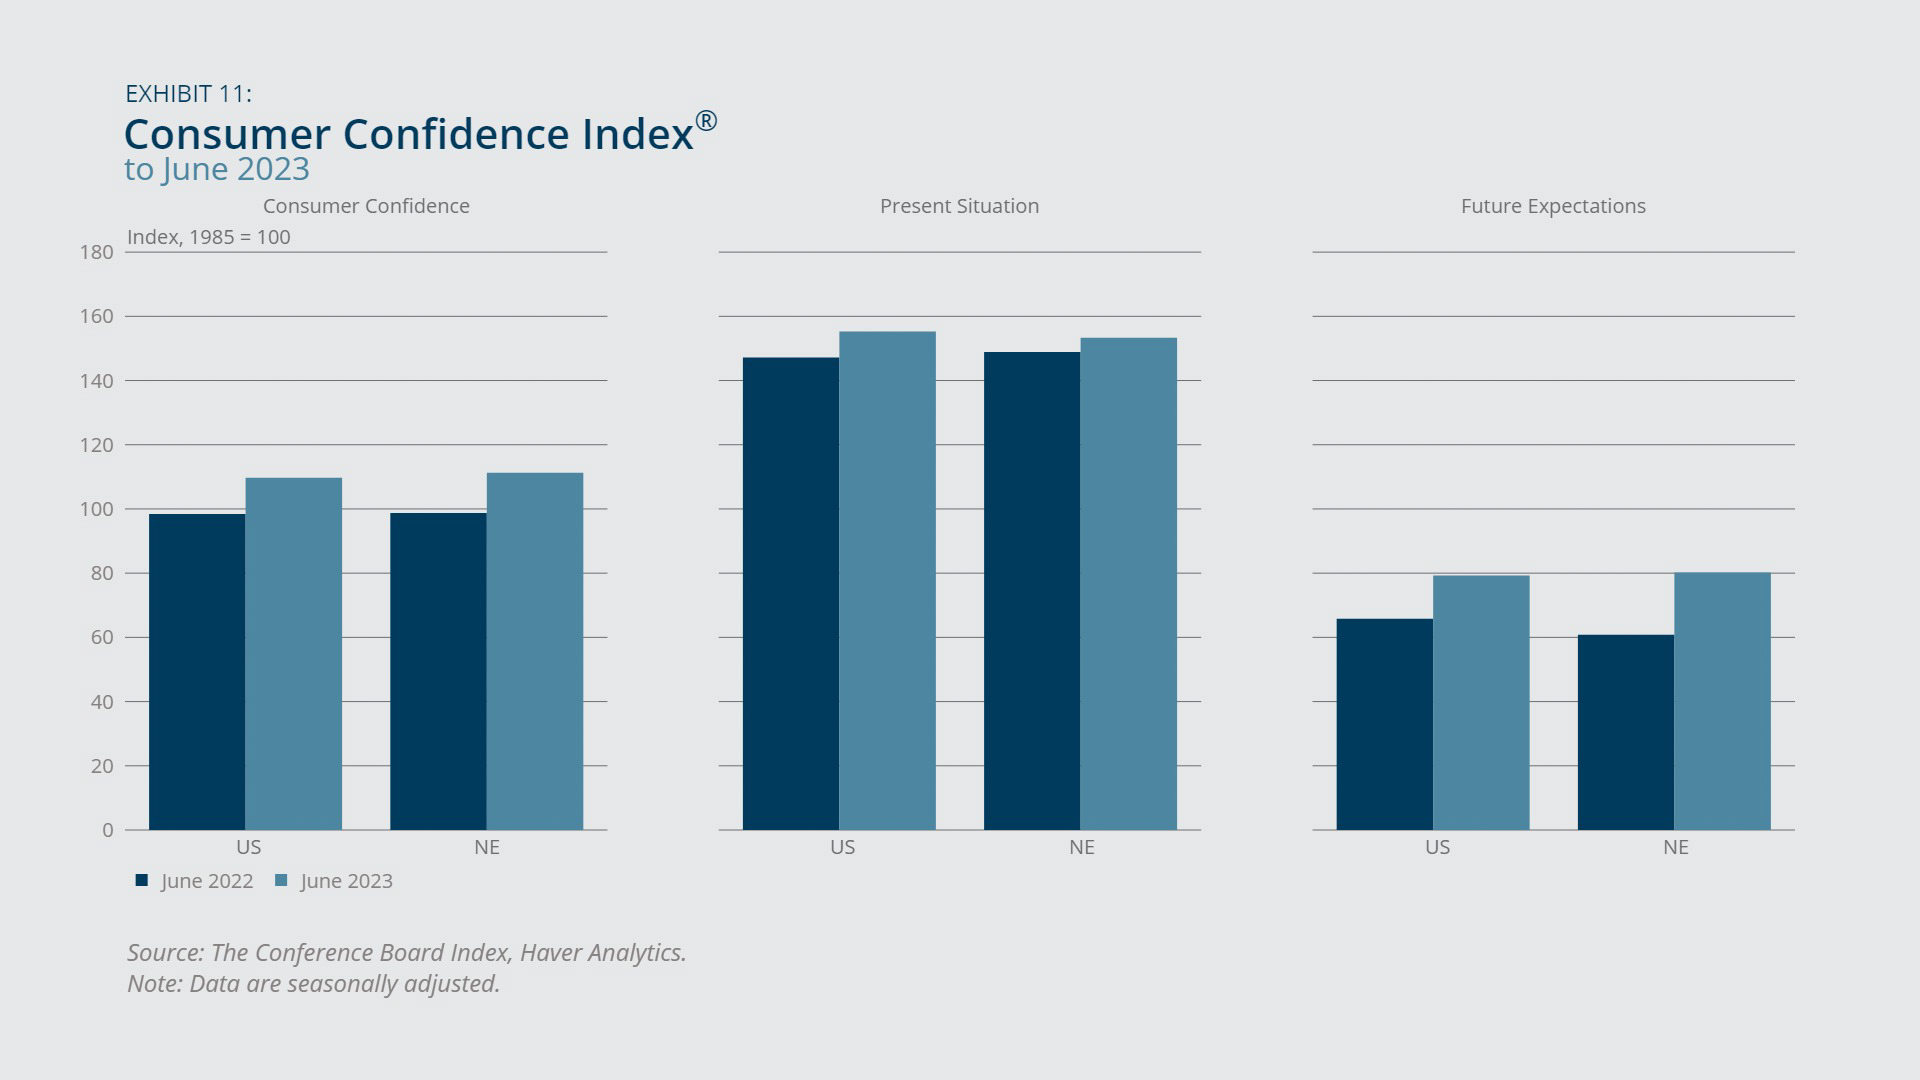
- Consumers in New England and the United States were more confident in June 2023 than they were a year earlier.
Consumer confidence experienced a year-over-year increase in both New England and the United States in June 2023 (Exhibit 11). This increase was driven by improved consumer sentiment about both the present situation and the future. Consumer confidence in the region reached its highest level since December 2022, which was also the last time future expectations increased year-over-year in New England (not shown).
Federal Reserve Bank of Boston
Endnotes
- Seasonally adjusted real average hourly earnings in the United States increased 0.2 percent year-over-year in May 2023. See Bureau of Labor Statistics, “Real Earnings Summary,” Economic News Release, June 13, 2023.

 About the Authors
Osborne Jackson,
Federal Reserve Bank of Boston
Osborne Jackson is a principal economist with the New England Public Policy Center in the Federal Reserve Bank of Boston Research Department.
Email: Osborne.Jackson@bos.frb.org
Acknowledgments
Matthew Sexton, Federal Reserve Bank of Boston
Gregory Longfield, Federal Reserve Bank of Boston