New England Economic Conditions through November 28, 2023 


Key Takeaways
- Employment growth in the region decelerated over the last 12 months, with growth rates remaining modestly below the national averages. Despite the slower employment growth, New England’s unemployment rate continued to decline; it fell below 3 percent in October 2023, reaching its lowest level since 2000. The low unemployment rate signals persistent worker shortages in the region.
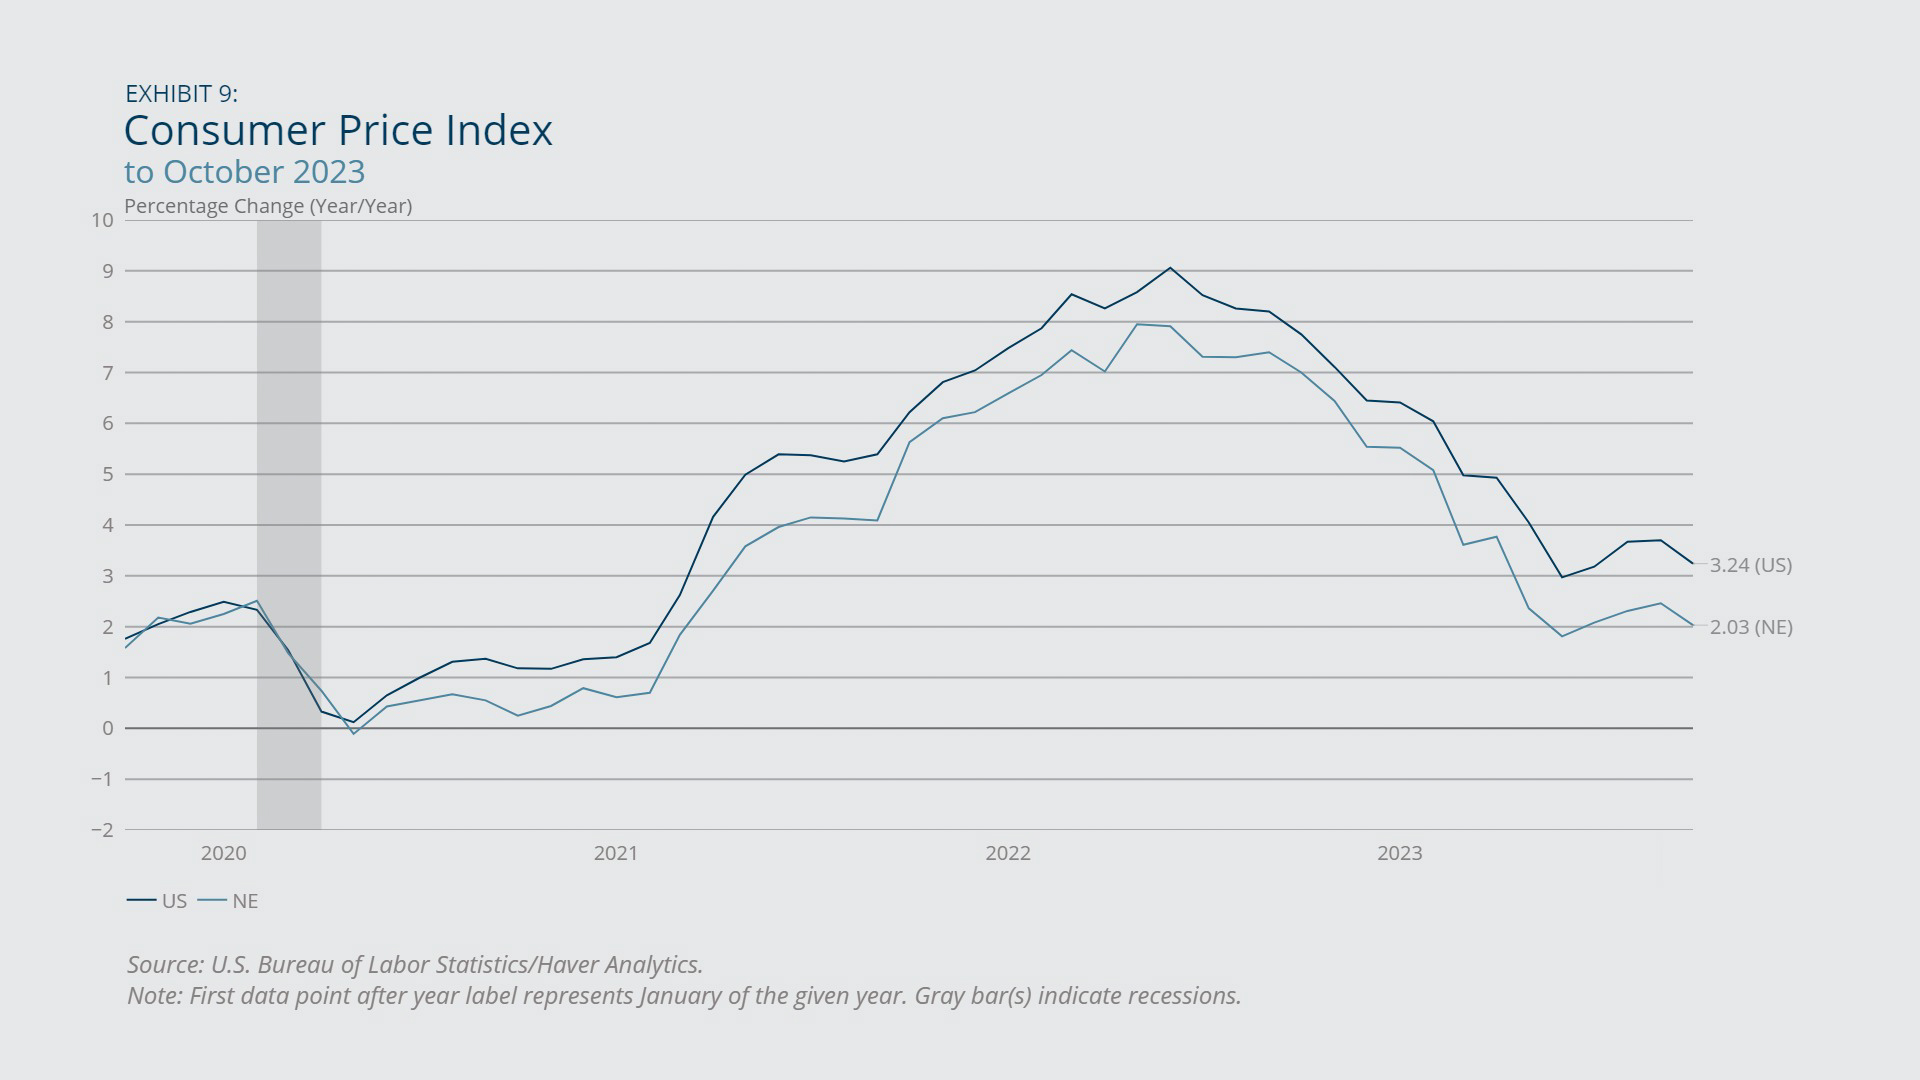
- Prices in New England remained stable from September through October 2023 after a temporary uptick in August 2023, bringing the region’s inflation rate back to 2 percent. While inflation moderated in all other expenditure categories, the shelter price index continued to grow at a speed three times as fast as the pre-pandemic rate, partially reflecting the region’s insufficient housing stock.
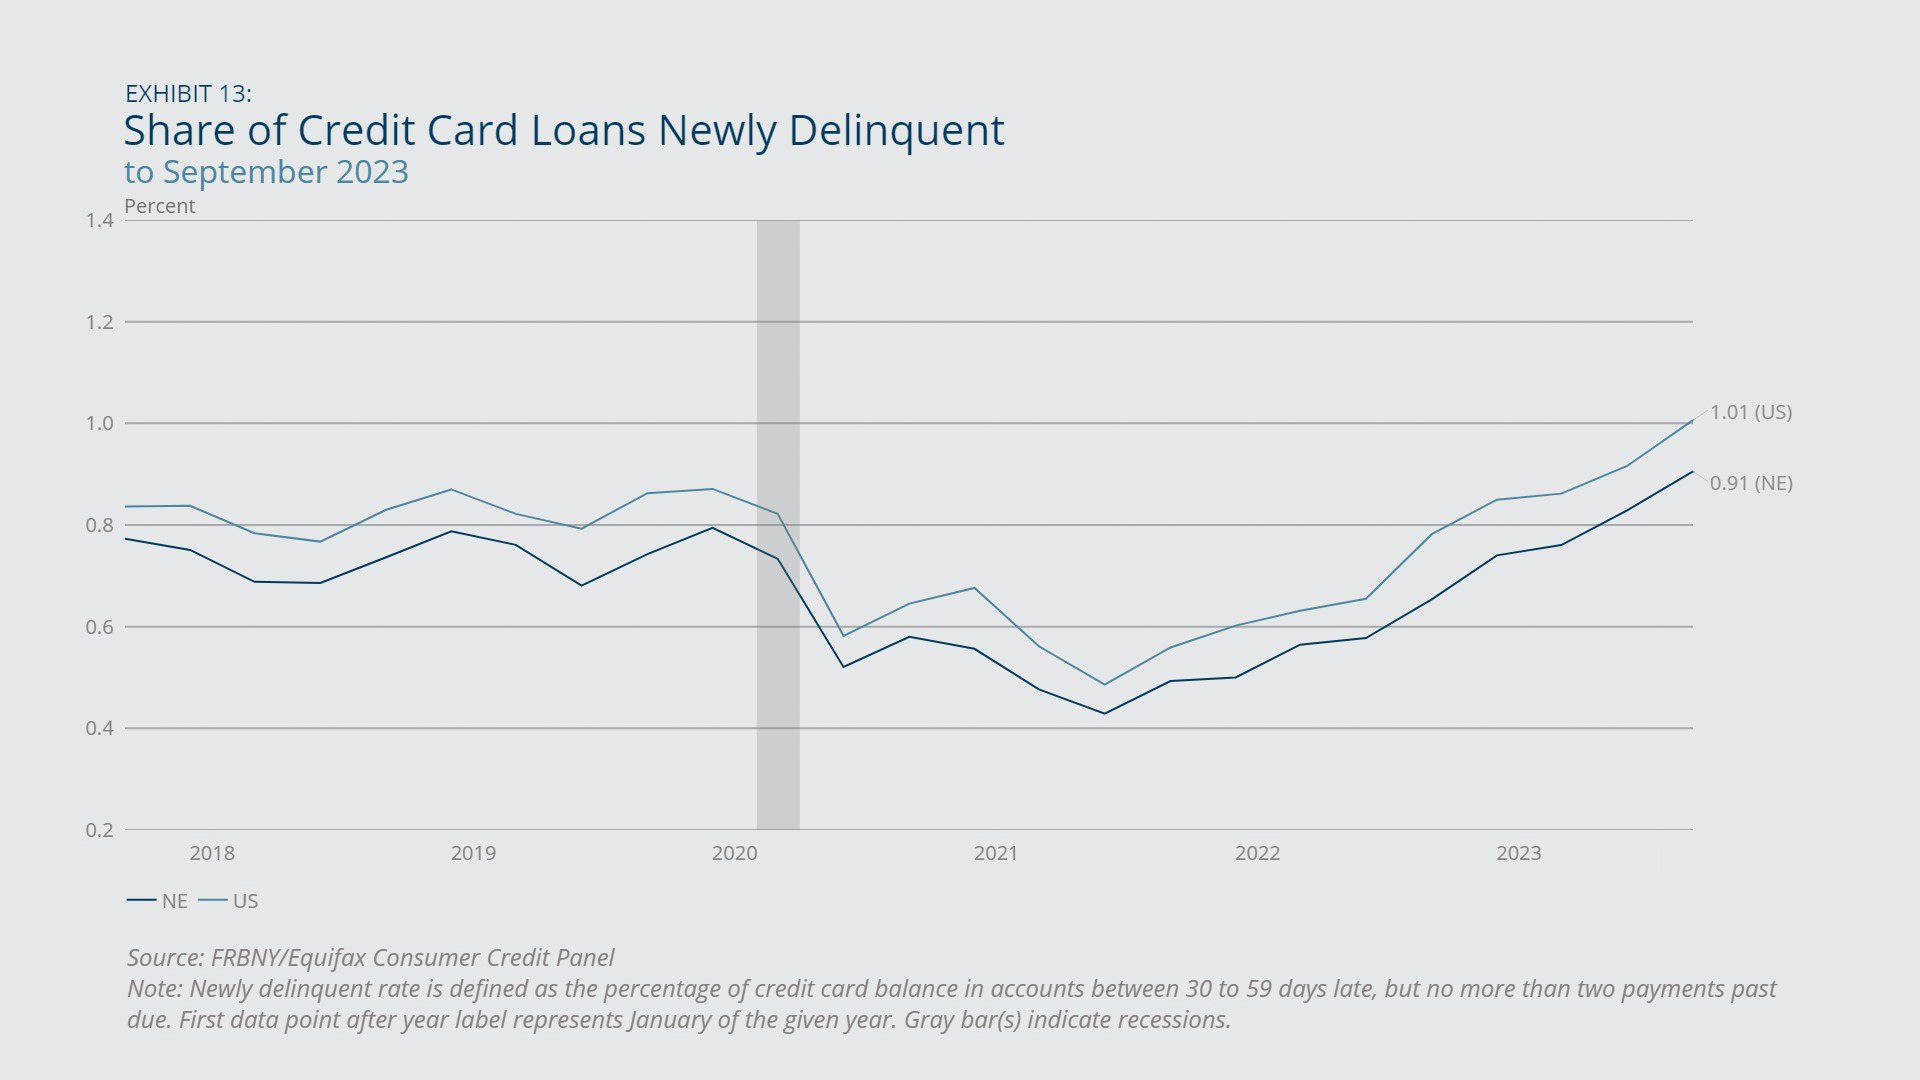
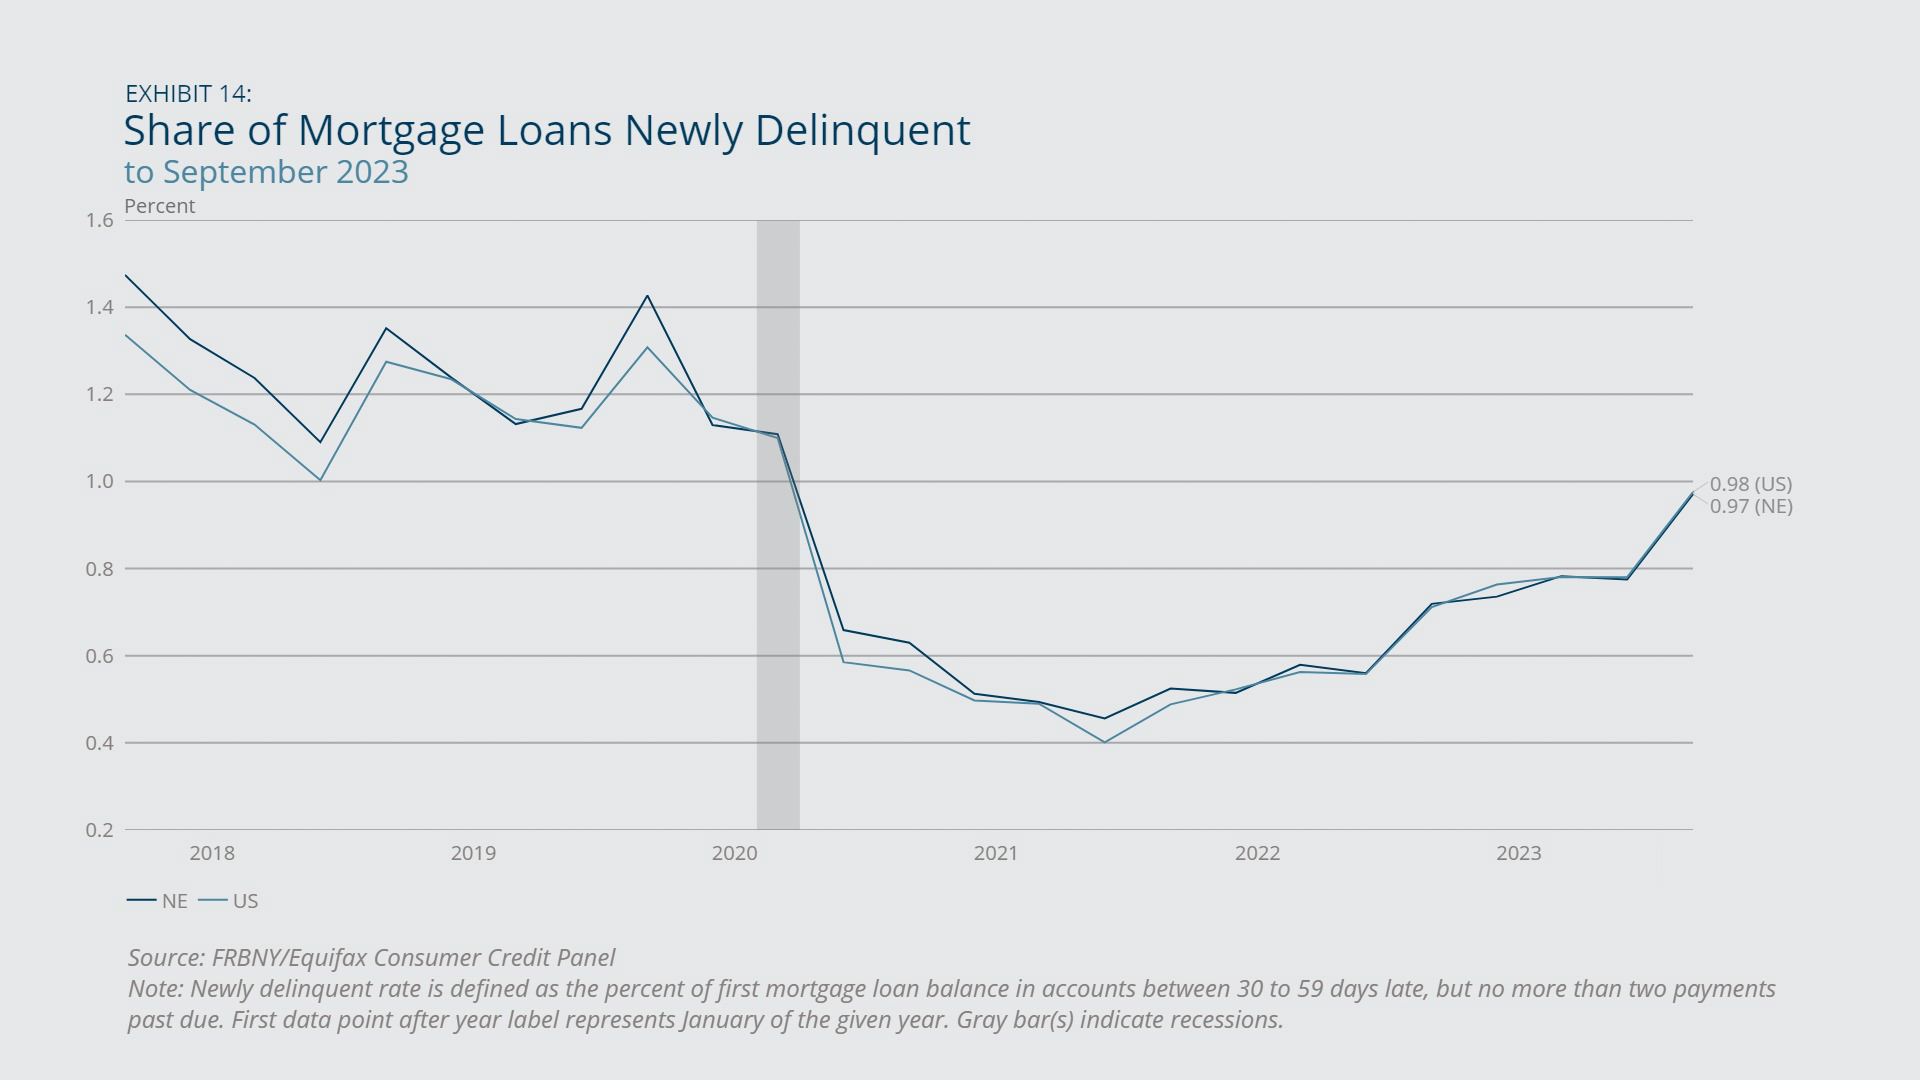
- The shares of credit card loan and mortgage loan balances in New England and across the country that were newly delinquent rose sharply from June 2021 through September 2023, while the US personal saving rate fell steadily. These changes signal that consumer finance has deteriorated since mid-2021 after it had improved considerably in 2020 and early 2021 due to pandemic-related government transfers.
Sign up for new research and data on the New England economy.
Payroll Employment
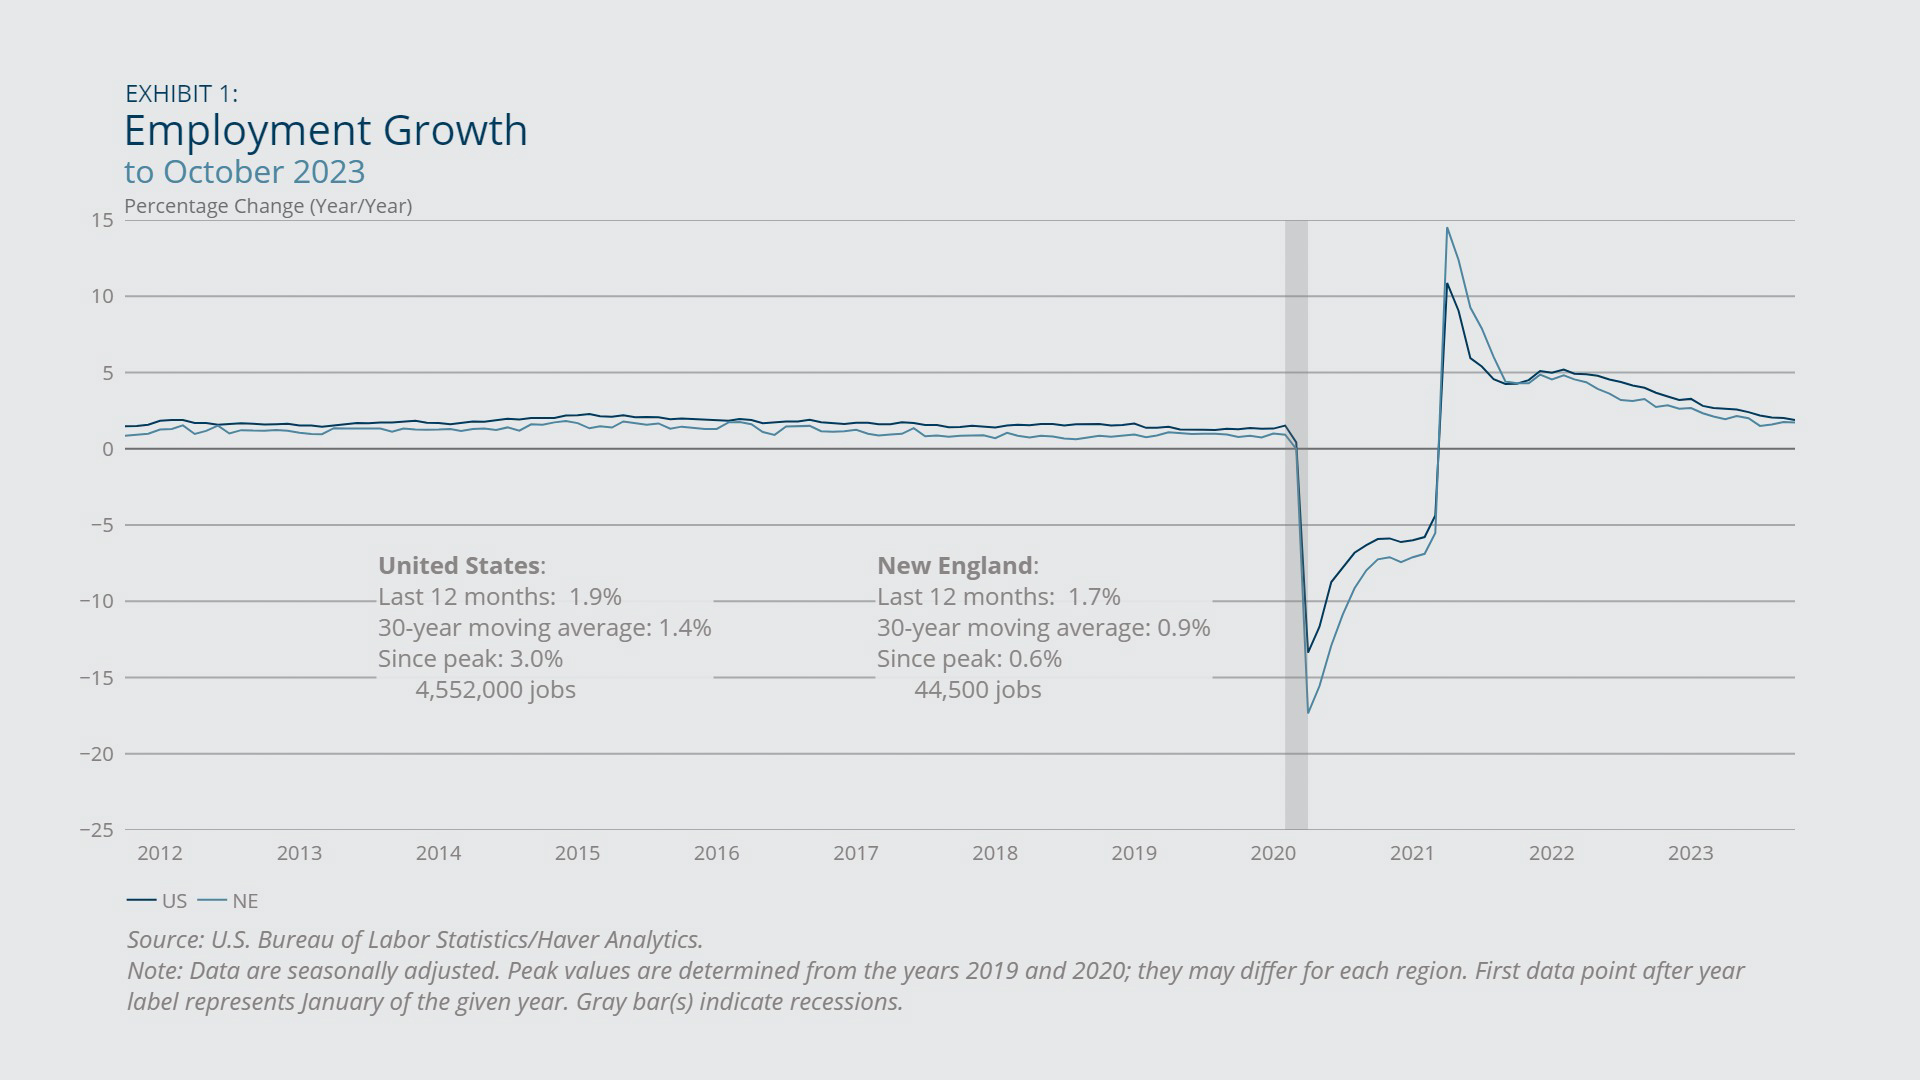
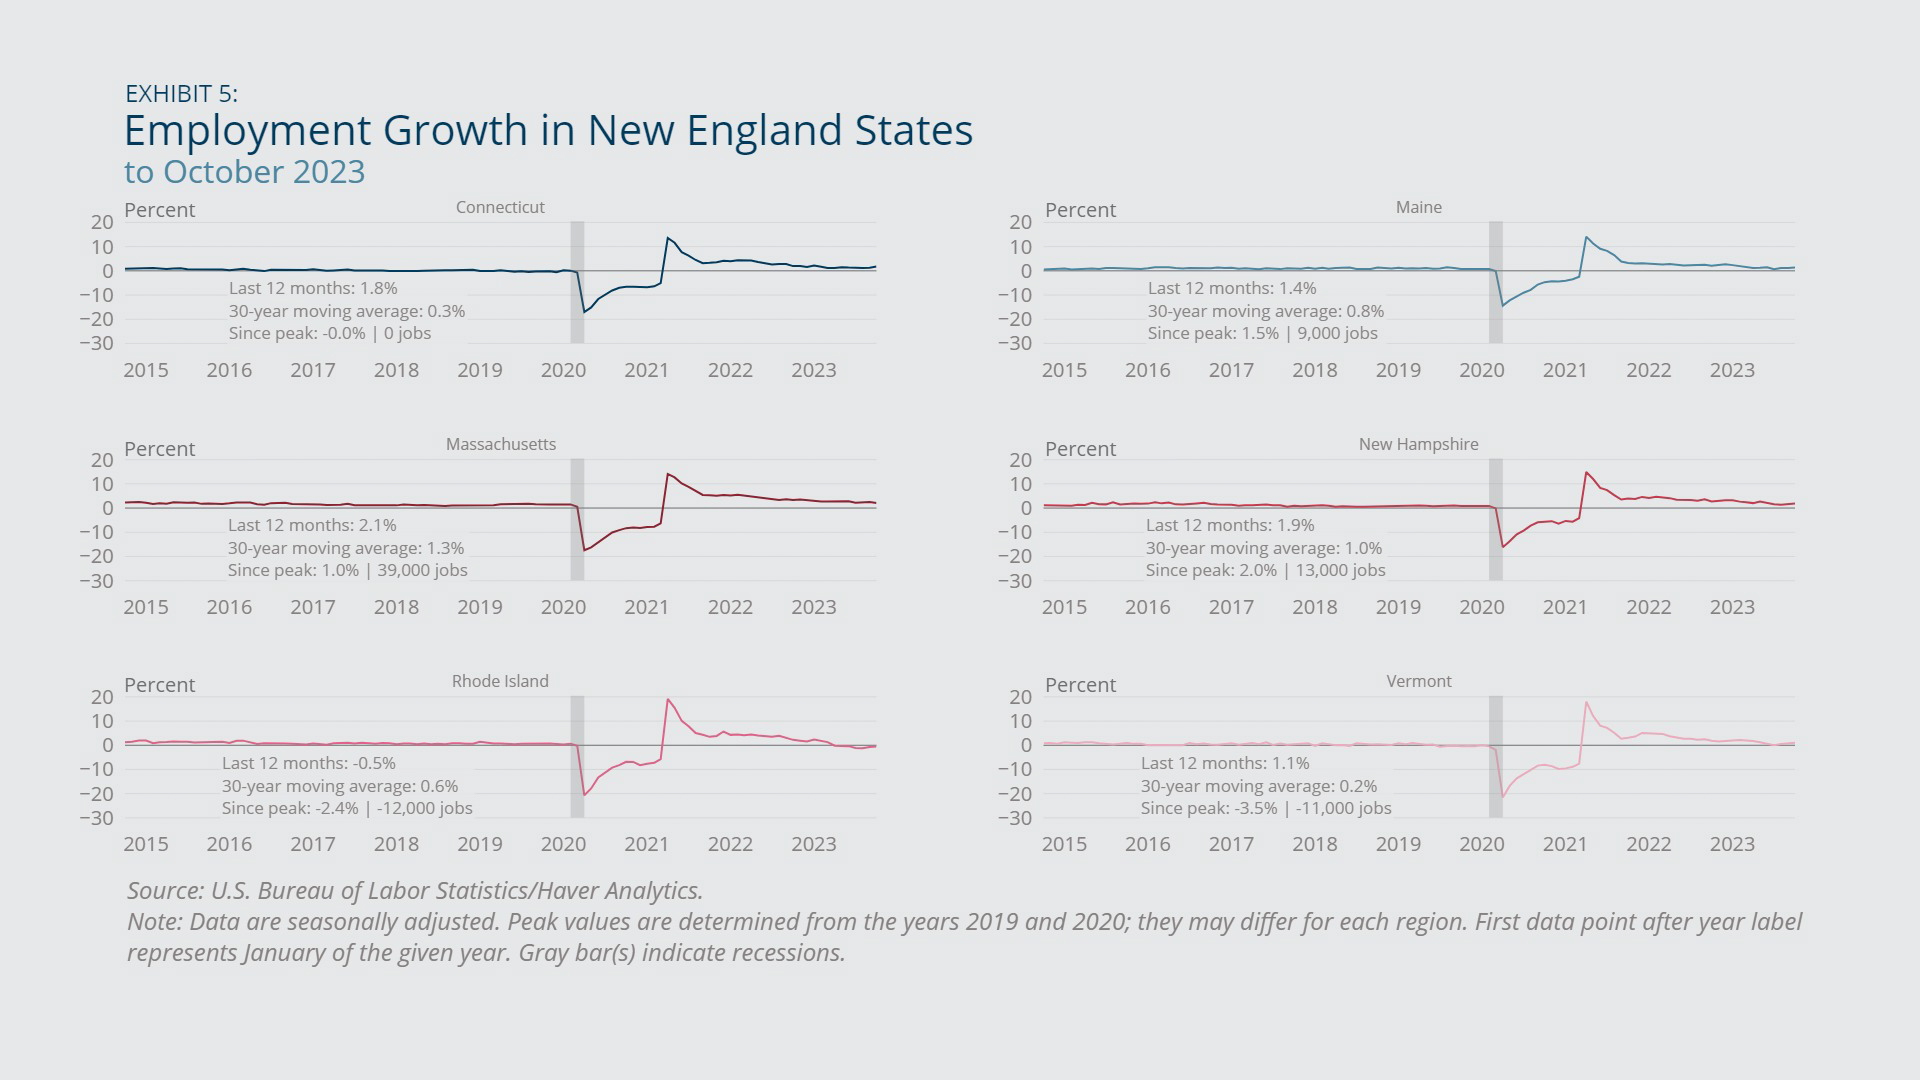
- Employment growth in the region decelerated over the last 12 months, with growth rates remaining modestly below the national averages.
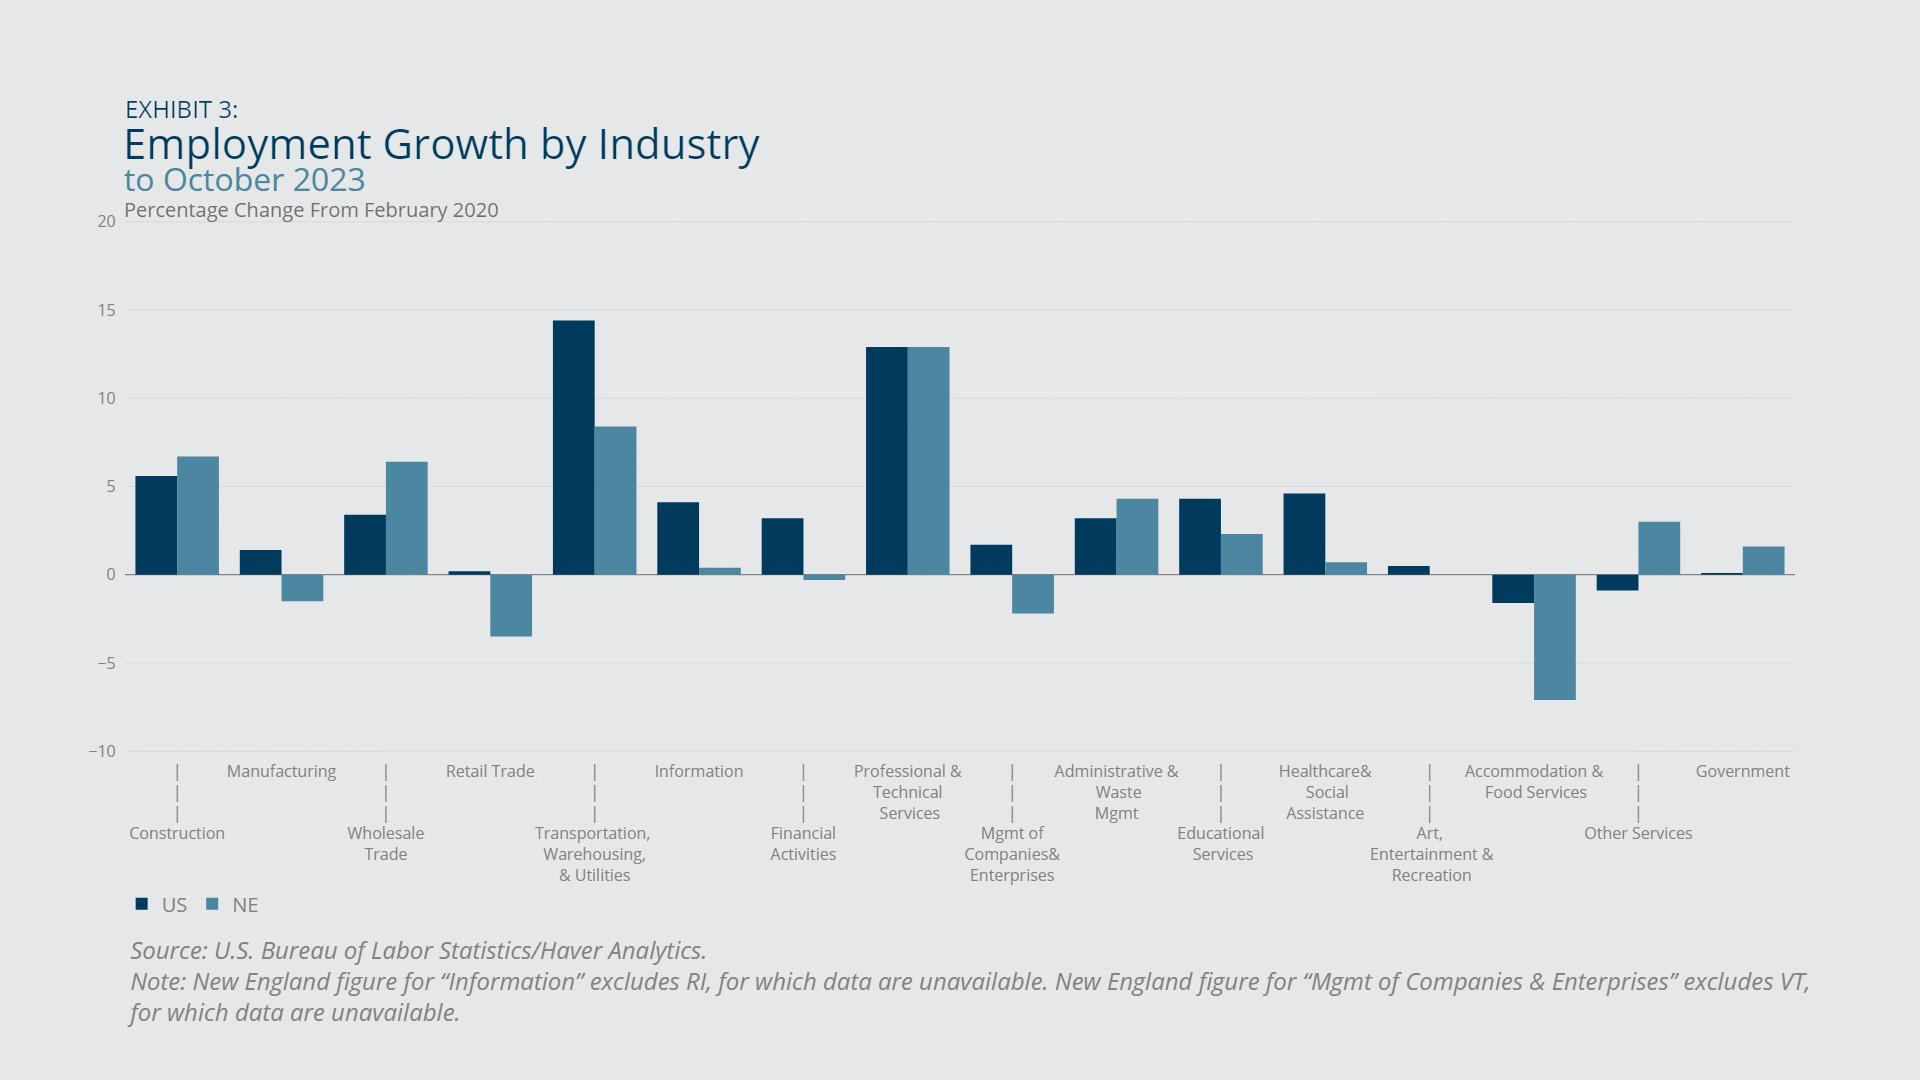
- Weaker employment growth in the retail, health care and social assistance, and accommodation and food services industries accounted for the region’s slower growth.
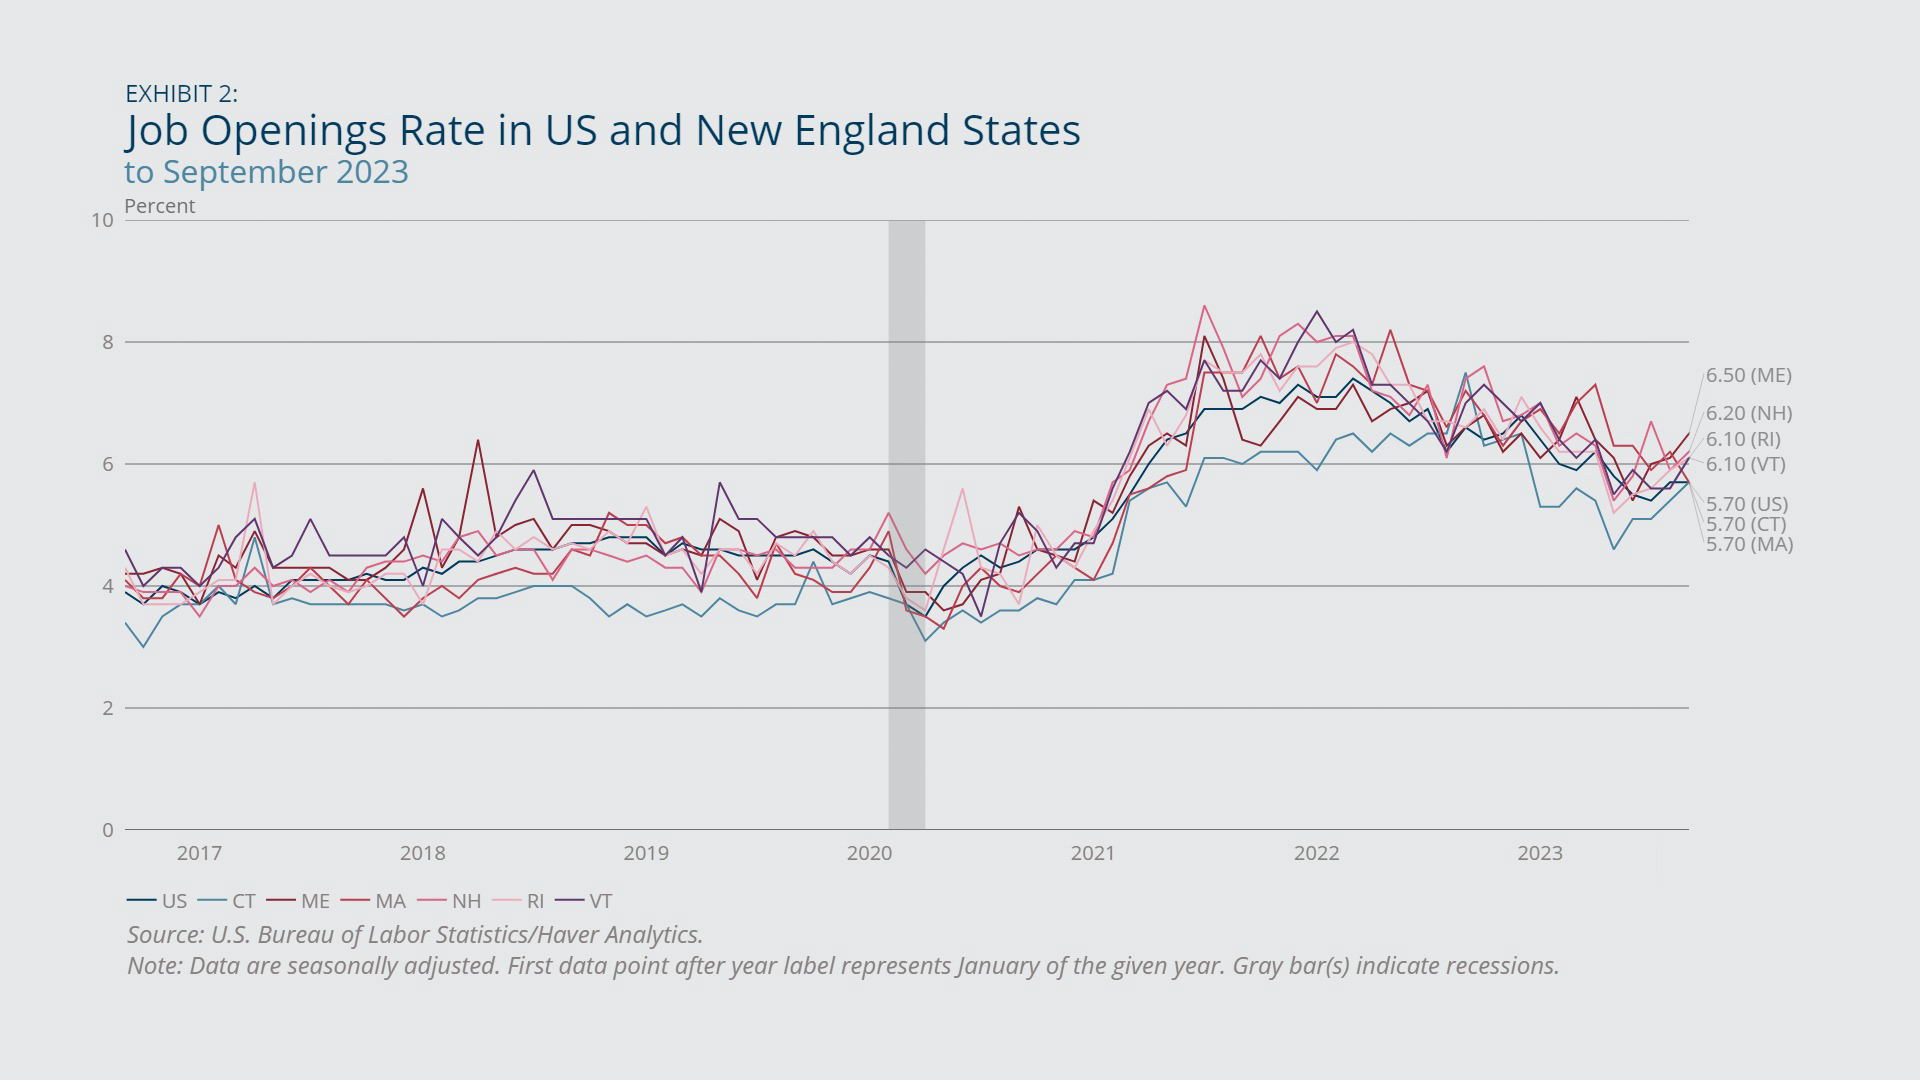
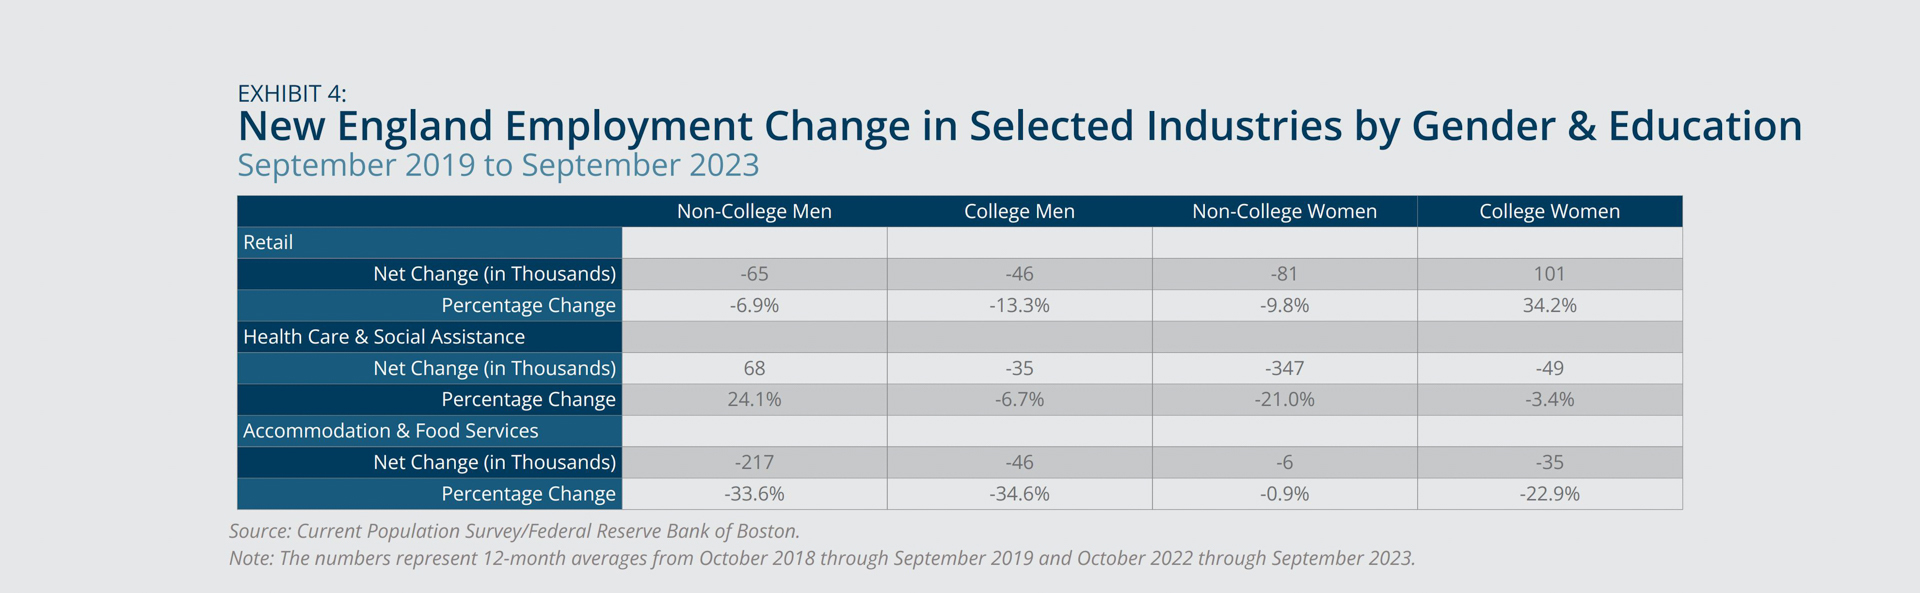
New England’s employment level continued to rise from August 2023 through October 2023, with employment-growth and job-opening rates both remaining above the long-term averages (Exhibit 1, Exhibit 2). Nevertheless, employment growth in the region decelerated over the last 12 months and lagged the national averages. Weaker employment growth in the retail, health care and social assistance, and accommodation and food services industries since the pandemic primarily accounted for the lag. (Exhibit 3). A closer look at household survey data suggests that difficulty retaining men (accommodation and food services, retail) and non-college-educated women (health care and social assistance, retail) led to the more modest growth in these industries (Exhibit 4). Massachusetts, New Hampshire, Connecticut, and Maine saw higher year-over-year employment growth than Rhode Island and Vermont. As of October 2023, those two states had not recovered the employment losses they sustained during the pandemic (Exhibit 5).

Federal Reserve Bank of Boston
Federal Reserve Bank of Boston
Federal Reserve Bank of Boston
Federal Reserve Bank of Boston
Federal Reserve Bank of Boston
Unemployment and Labor Force Participation
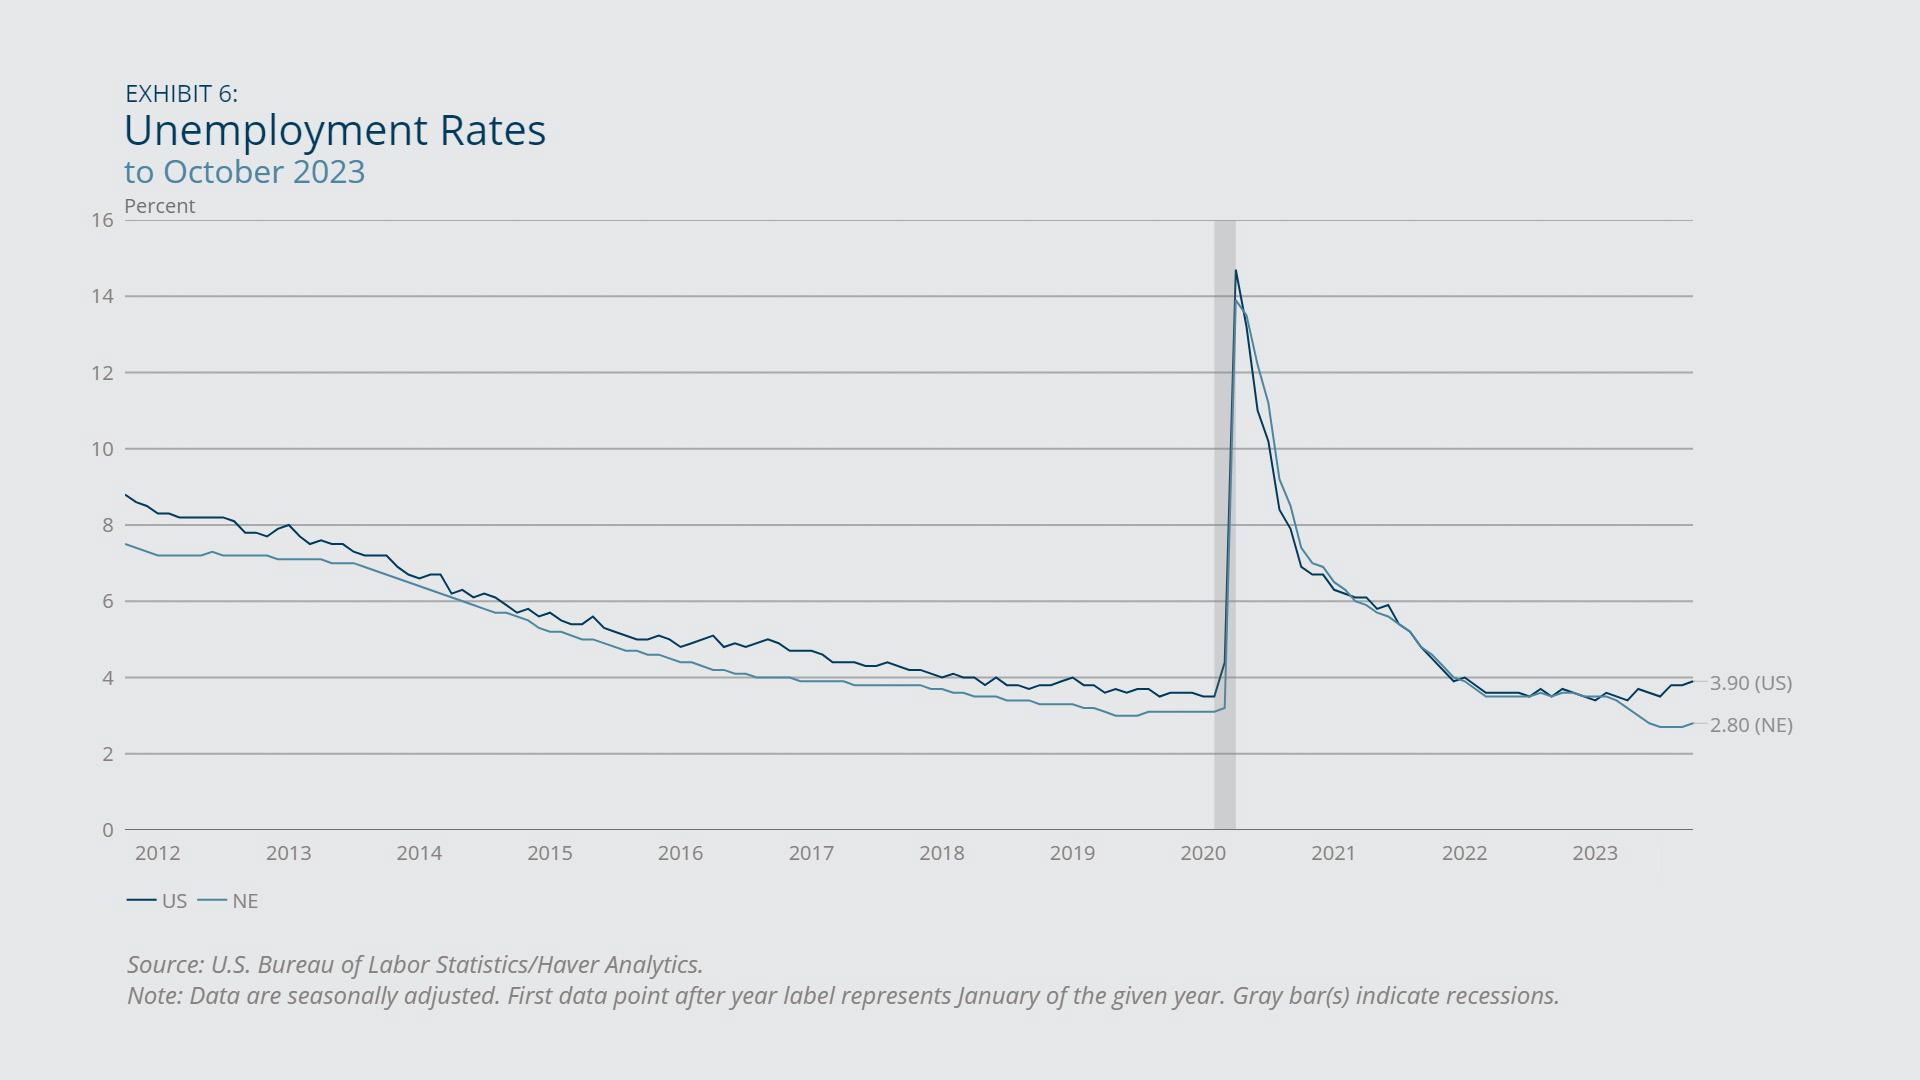
- The unemployment rate in New England deviated from the national trend by continuing to decline, reaching its lowest level since 2000. The low rate signals persistent worker shortage in the region.
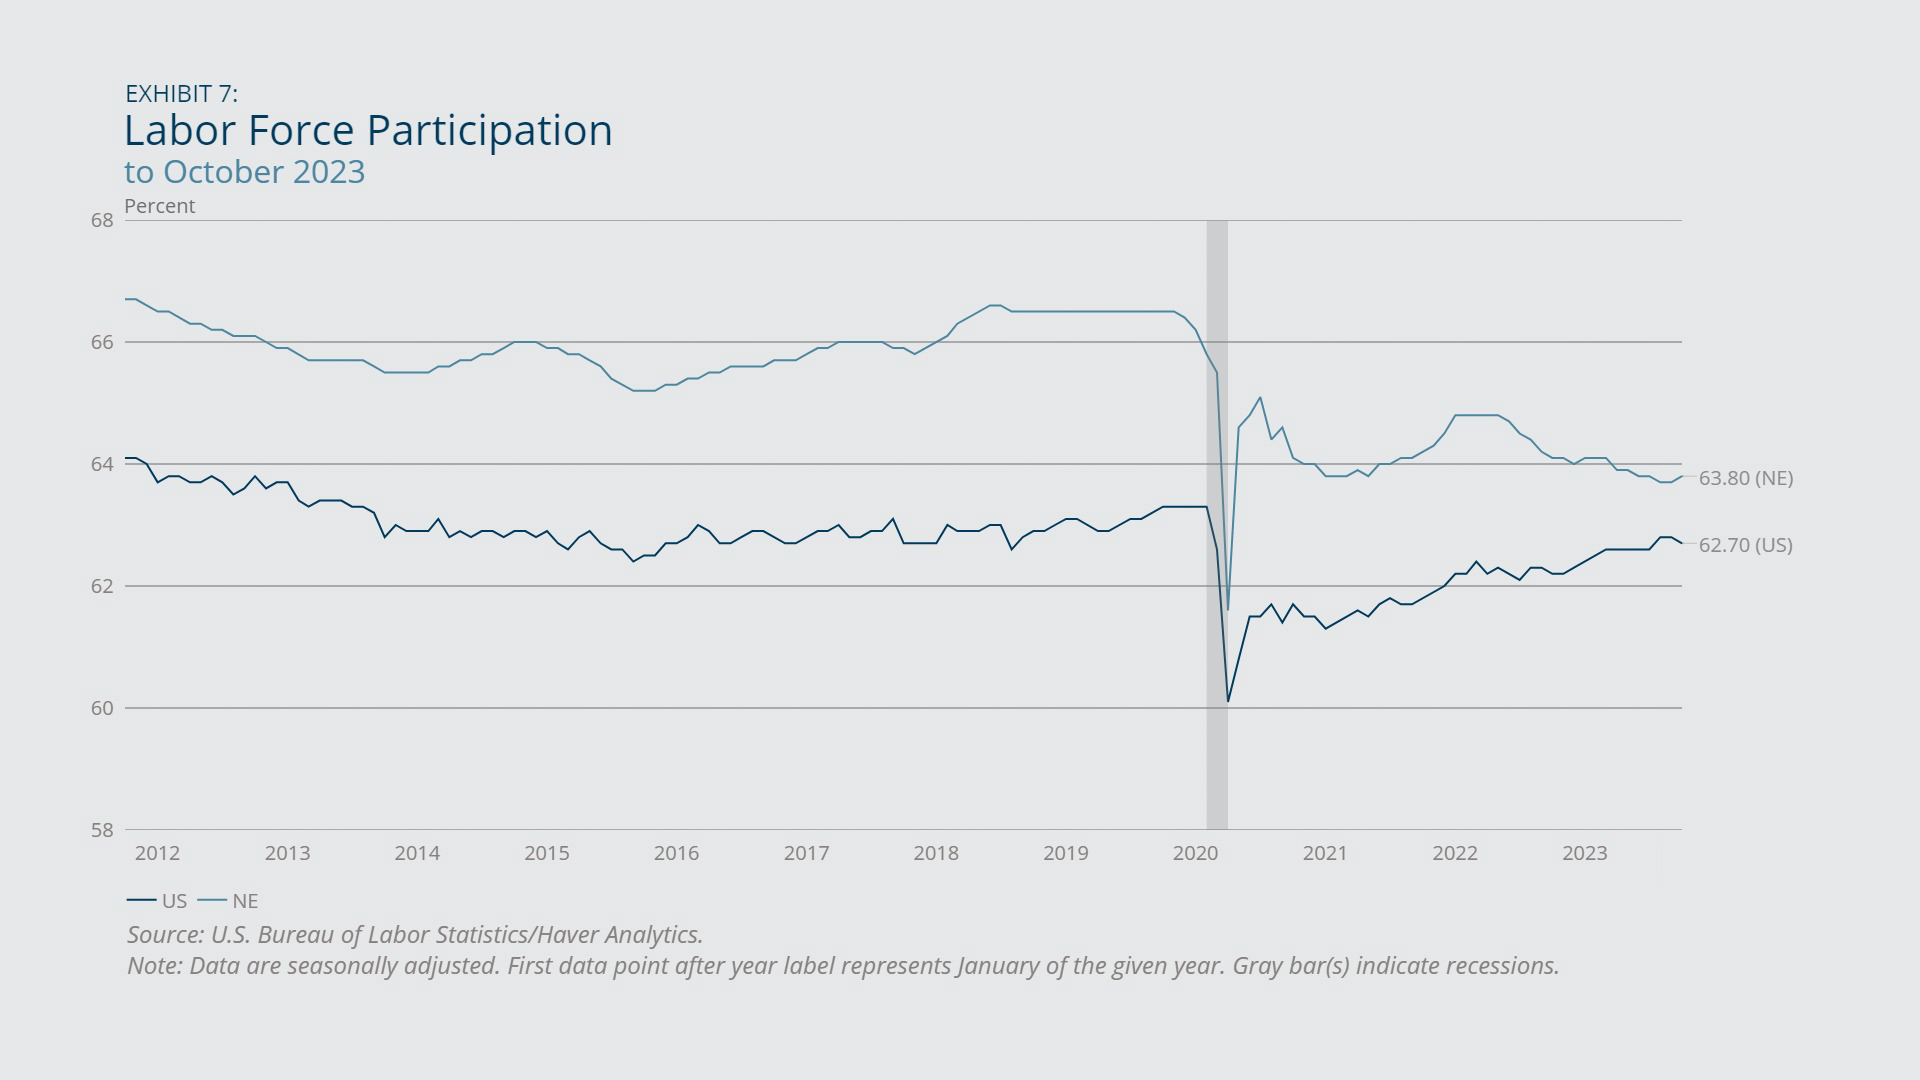
- The falling unemployment rate is partially tied to New England’s shrinking labor force. By contrast, the national labor force participation rate has recovered steadily since the pandemic.
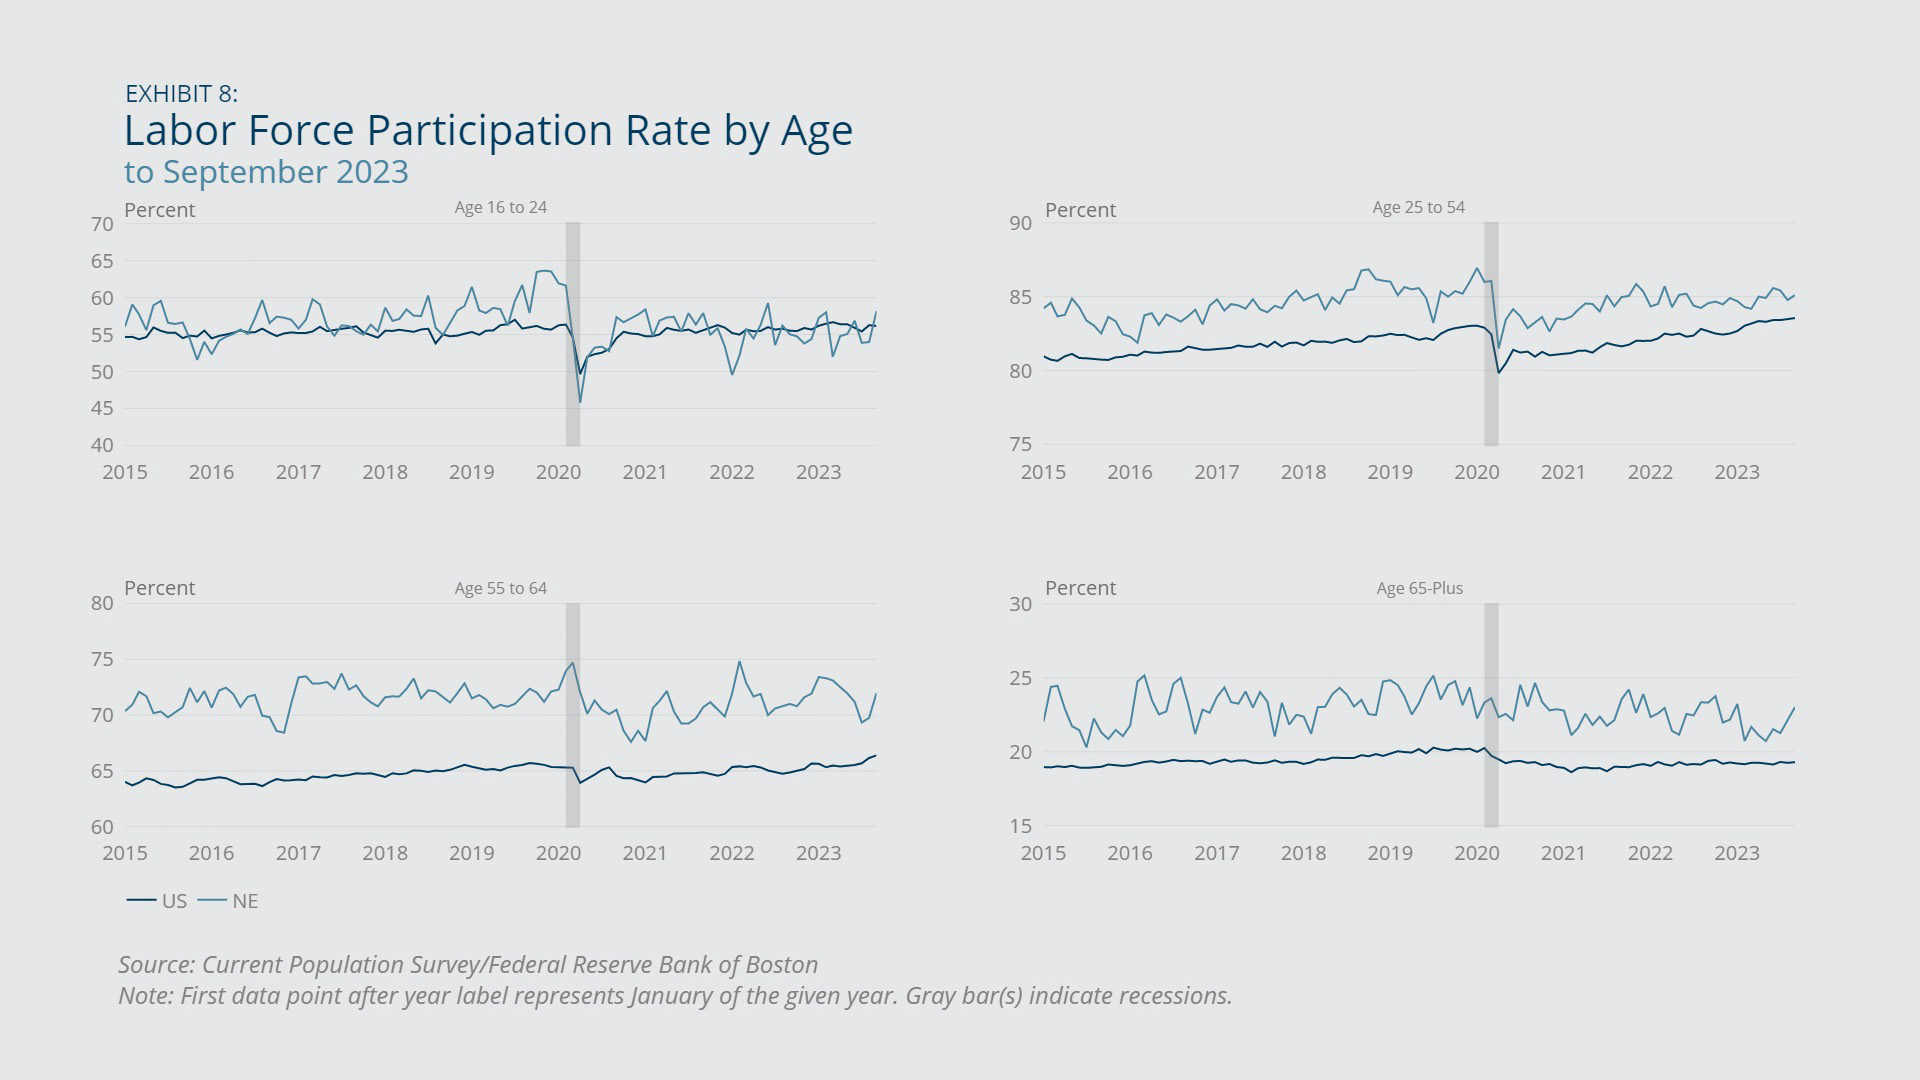
The unemployment rate in New England fell from 3.5 percent in January 2023 to 2.8 percent in October 2023 despite decelerating job growth (Exhibit 6). The 2.8 percent unemployment rate marked the lowest rate since 2000 and signaled a shortage of job seekers willing and able to fill vacancies. Over the same period, the US unemployment rate increased from 3.4 percent to 3.9 percent. The difference resulted from diverging trends in labor force participation between New England and the rest of the country (Exhibit 7). Across the United States, labor force participation has steadily recovered since 2021, with participation rates surpassing their pre-pandemic levels for all age groups except workers aged 65 and older (Exhibit 8). By contrast, in New England, an aging population, retirements, and weaker participation recovery across all age groups have led to a widening gap between the current and pre-pandemic labor force participation levels.
Federal Reserve Bank of Boston
Federal Reserve Bank of Boston
Federal Reserve Bank of Boston
Inflation
- Prices in New England remained stable from September through October 2023 after a temporary uptick in August 2023, bringing the region’s inflation rate back to 2 percent.
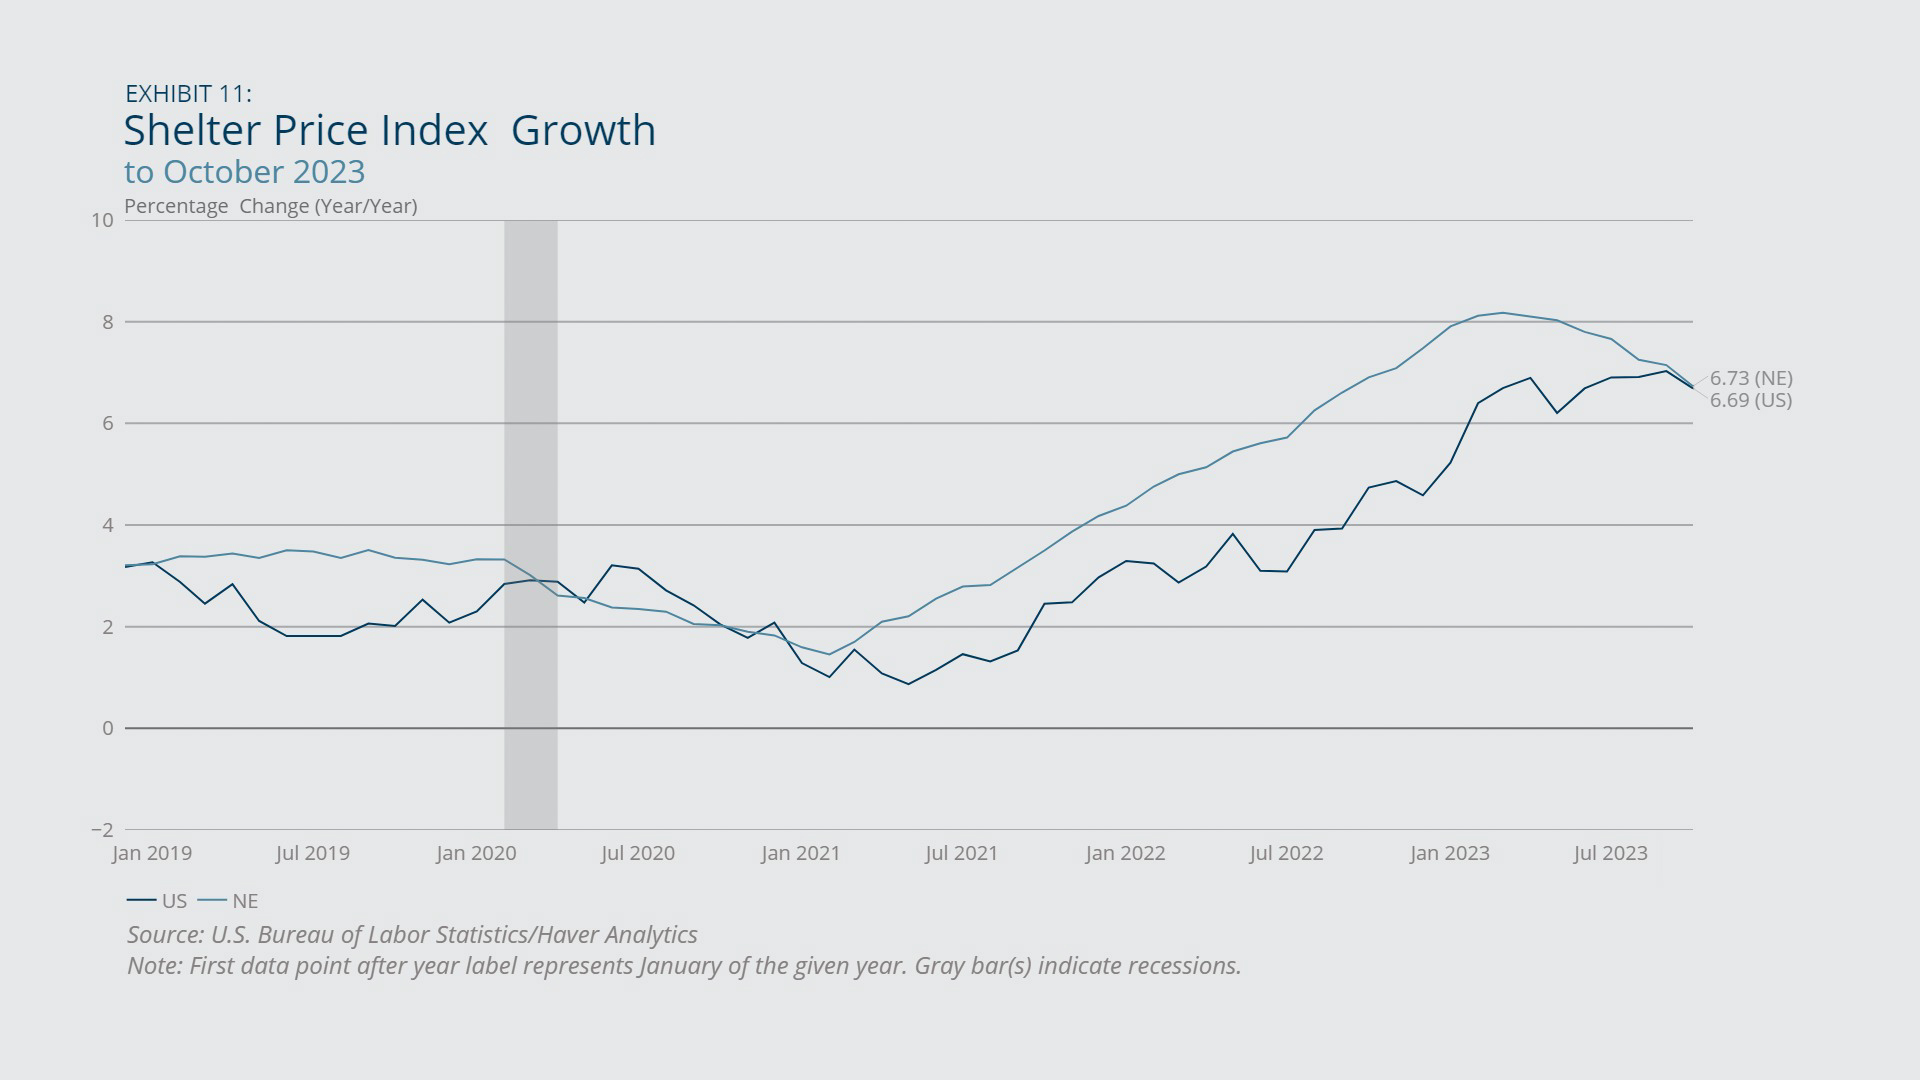
- While inflation moderated in all other expenditure categories in New England, the region’s shelter price index continued to grow at a speed three times as fast as the pre-pandemic rate.
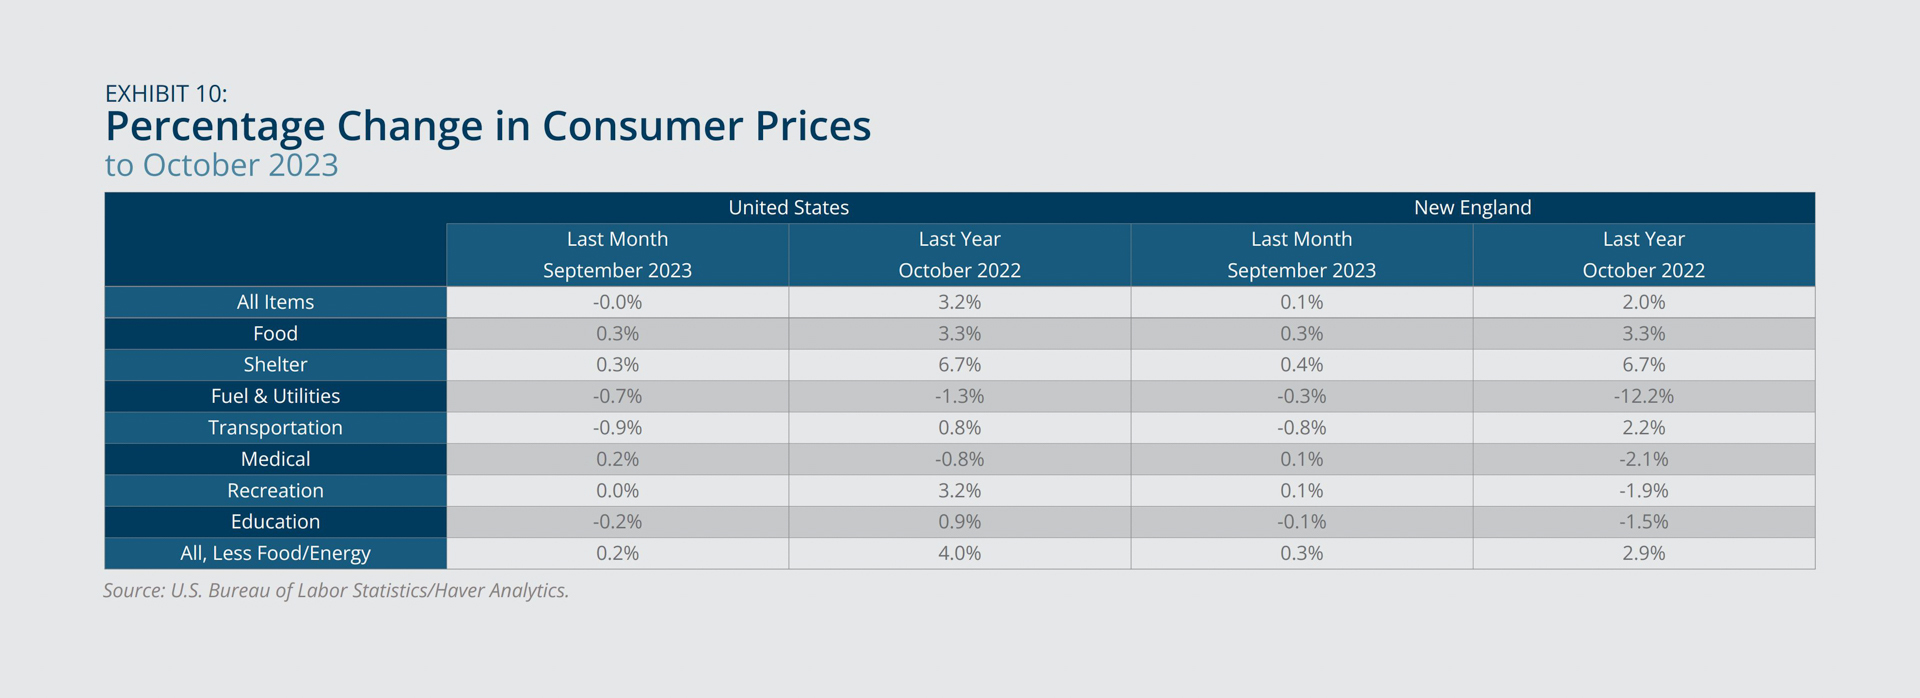
As of October 2023, the inflation rate, defined as the year-over-year change in the Consumer Price Index for All Urban Consumers (CPI-U), was 2.0 percent in New England, down from 7.0 percent a year earlier (Exhibit 9). The modest aggregate price increase was due to counteracting price changes in the shelter and food indexes (up 6.7 and 3.3 percent, respectively) and the fuel and utilities price index (down 12.2 percent) (Exhibit 10). While inflation moderated in all other expenditure categories, the region’s shelter price index, a measure primarily reflecting rental costs, showed no signs of softening and continued to grow at a speed three times as fast as the pre-pandemic rate (Exhibit 11). By contrast, national shelter price inflation fell steadily from February 2023 through October 2023.
Federal Reserve Bank of Boston
Federal Reserve Bank of Boston
Federal Reserve Bank of Boston
Wages and Salaries
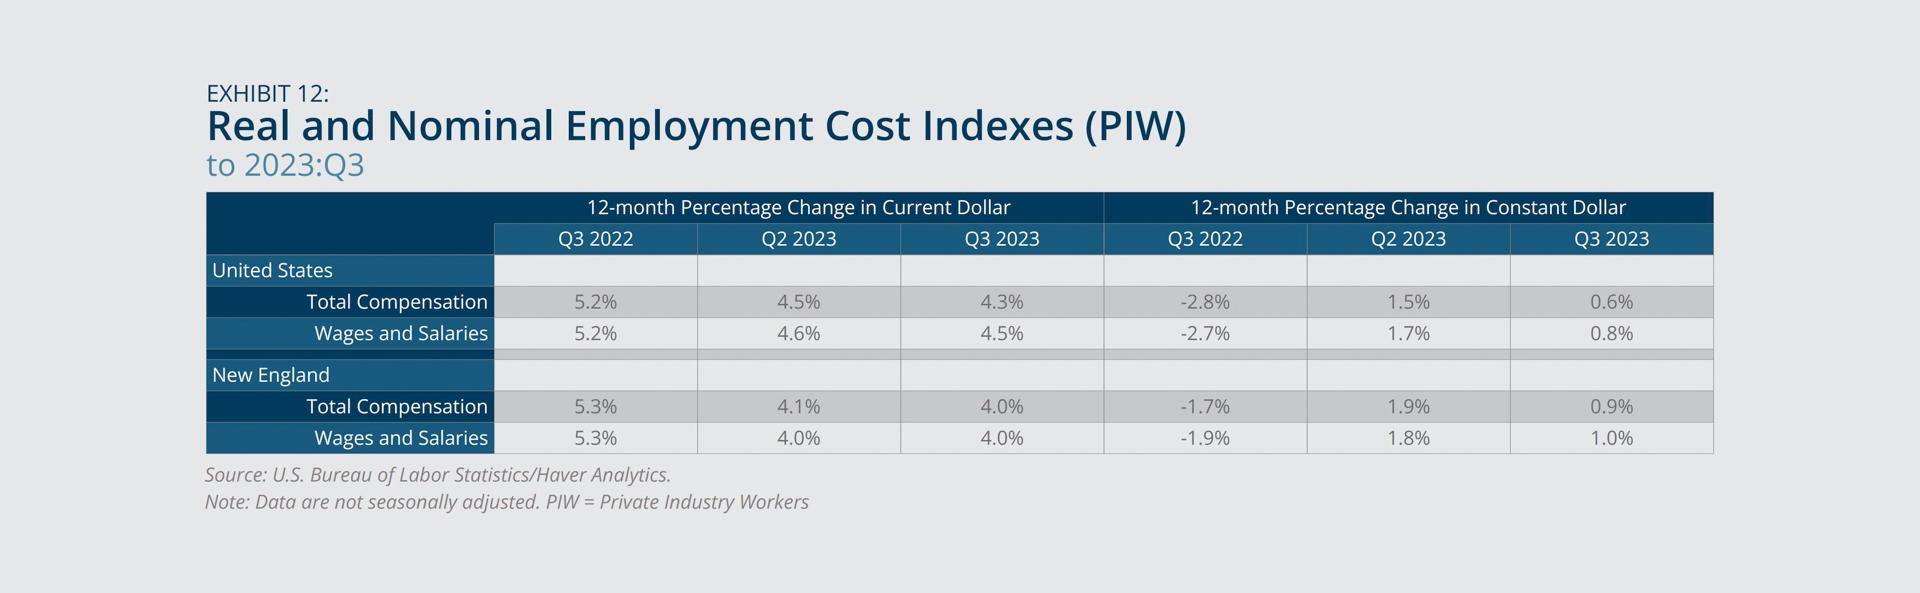
- In New England and across the United States, wage and salary growth has eased since 2023:Q1.
- Because inflation declined faster than wage growth, New England workers experienced gains in their inflation-adjusted real wages for the first time in two years in 2023:Q2.
Following a two-year hike, growth in nominal wages and salaries has moderated in both New England and across the United States since 2023:Q1. As of 2023:Q3, New England reported a 4.0 percent year-over-year growth rate in nominal wages and salaries, compared with the 5.3 percent growth rate a year ago (Exhibit 12). Despite the deceleration, New England’s wage growth exceeded inflation for the first time in two years in 2023:Q2, leading to positive gains in workers’ real wages for two consecutive quarters. The gains are largely attributable to the region’s lower inflation in the second and third quarters of 2023.
Federal Reserve Bank of Boston
Consumer Finance
- After a swift decline in 2020 and early 2021, the shares of credit card loan balances and first mortgage loan balances in New England that were newly delinquent rose sharply from June 2021 through September 2023.
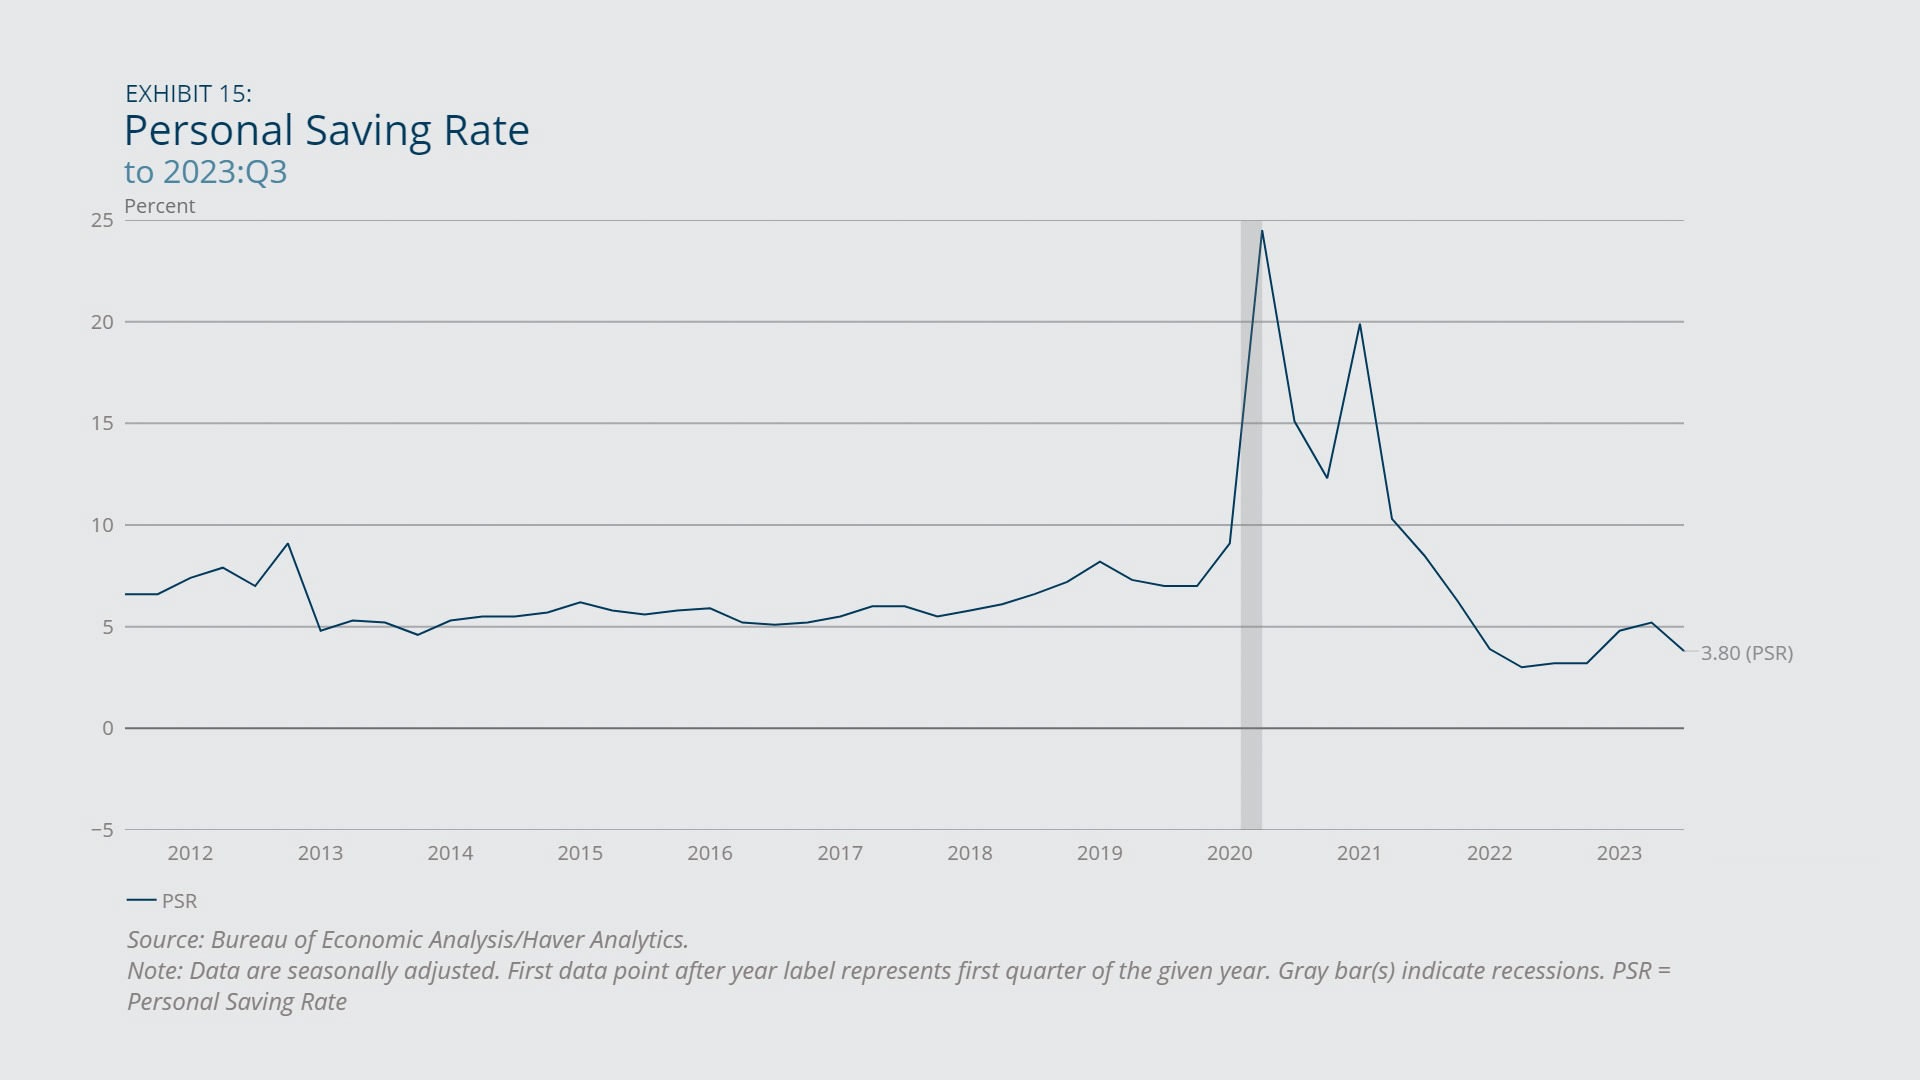
- The US personal saving rate has declined steadily since 2021:Q2 and remained lower than its pre-pandemic level as of 2023:Q3, reflecting slower personal income growth relative to spending growth.
From June 2021 through September 2023, the share of credit card loan balances in New England that were newly delinquent grew from 0.43 percent to 0.91 percent, exceeding their pre-pandemic, 2019 level by more than 0.15 percentage point (or 20 percent) (Exhibit 13). Over the same period, the share of first mortgage loan balances in the region that were newly delinquent grew from 0.46 percent to 0.97 percent (Exhibit 14). The parallel trends signal that consumer finance has deteriorated since mid-2021 after it had improved considerably in 2020 and early 2021 due to pandemic-related government transfers. Across the United States, the personal saving rate, defined as the percentage of disposable personal income saved, also has declined (Exhibit 15). As of 2023:Q3, the US personal saving rate was 3.8 percent, compared with 7.0 percent in 2019:Q3. The decreased saving rate reflects slower personal income growth relative to spending growth across US households.
Federal Reserve Bank of Boston
Federal Reserve Bank of Boston
Federal Reserve Bank of Boston

 About the Authors
Pinghui Wu,
Federal Reserve Bank of Boston
Pinghui Wu is a senior economist with the New England Public Policy Center at the Federal Reserve Bank of Boston.
Email: Pinghui.Wu@bos.frb.org
Acknowledgments
Gregory Longfield, Federal Reserve Bank of Boston
Lucy McMillan, Federal Reserve Bank of Boston
Resources
Site Topics
Keywords
- Regional economy ,
- Economic Conditions ,
- New England