New England Economic Conditions Through June 3, 2025 


Key Takeaways
- New England’s unemployment rate increased 0.7 percentage point from April 2024 to April 2025. At 4.1 percent, the regional rate inched closer to the US rate of 4.2 percent. The labor force participation rate in New England has leveled off for several months and has not recovered to the pre-pandemic level.
- In April 2025 in New England, inflation was nearly 3 percent, as measured by the year-over-year change in the Consumer Price Index. Shelter prices in the region rose more than 6 percent from a year prior. That increase was only partially offset by a 2 percent decline in transportation prices.
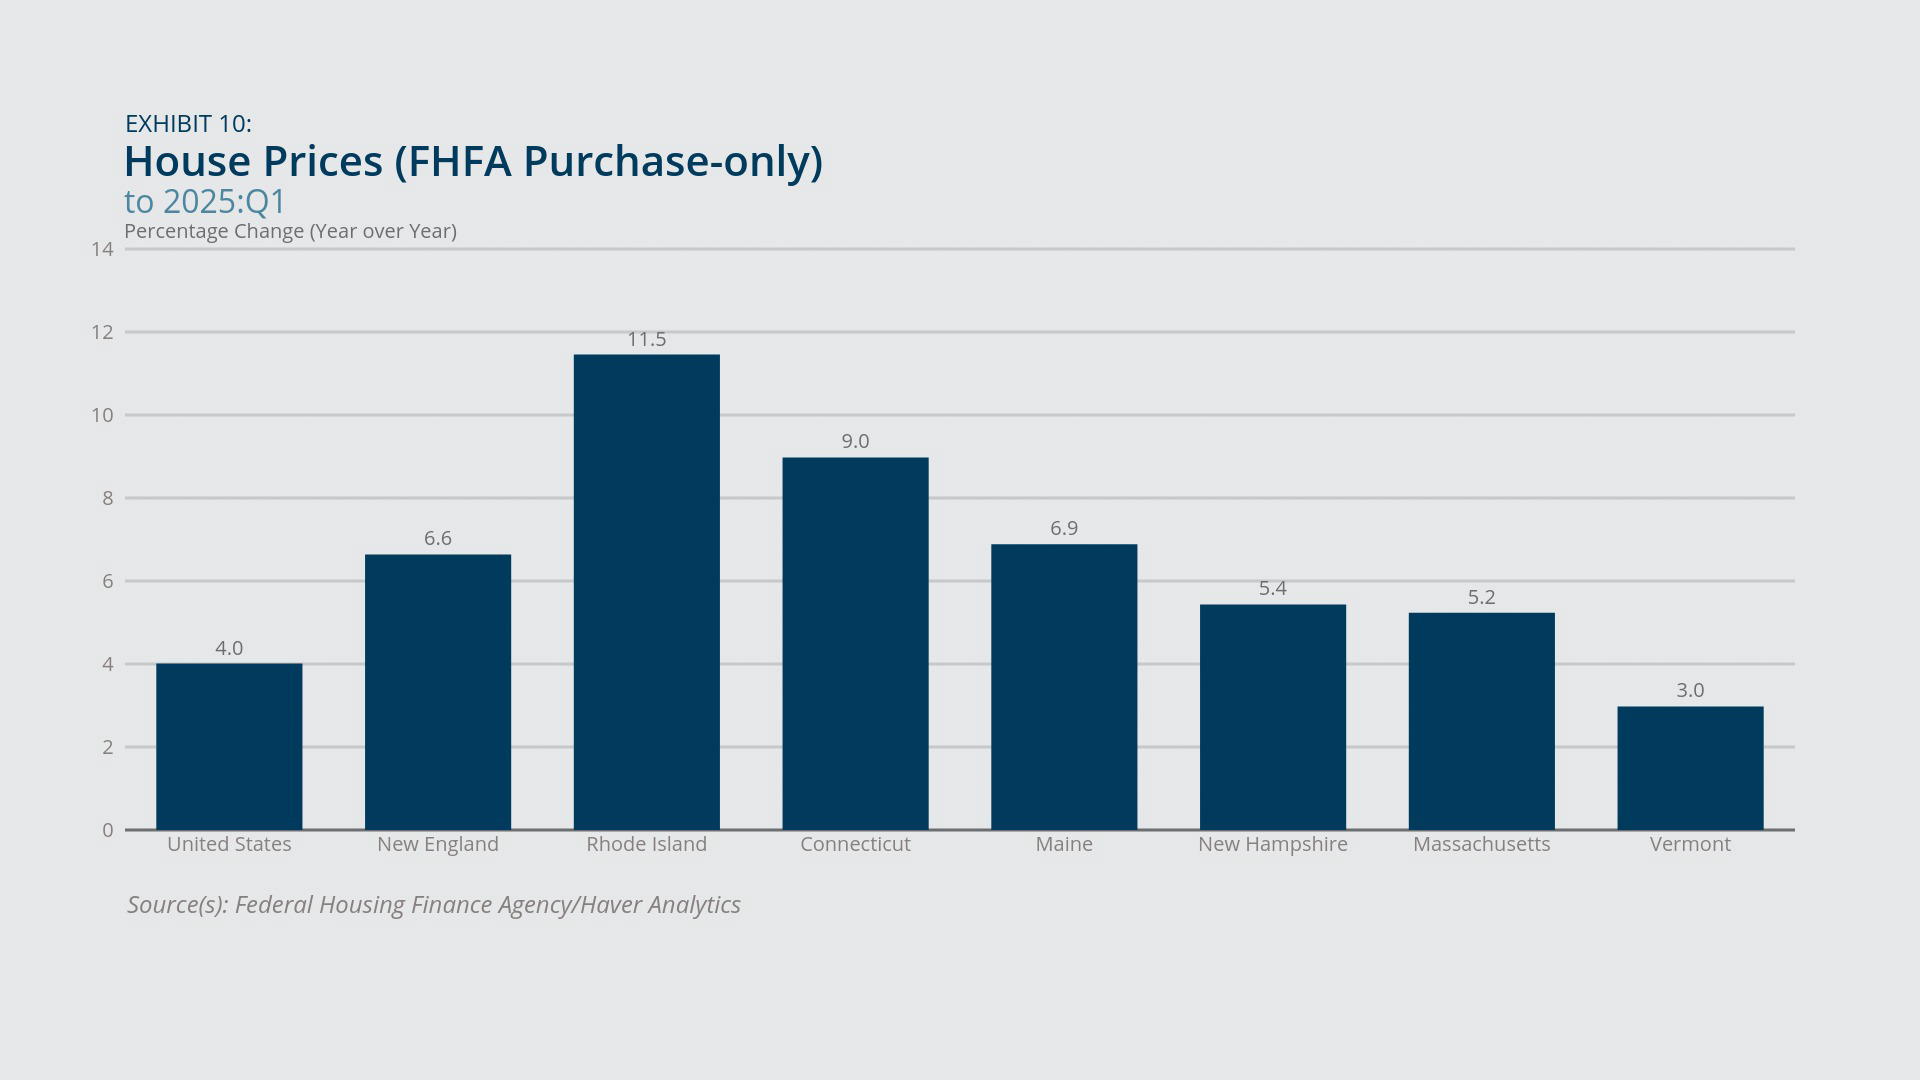
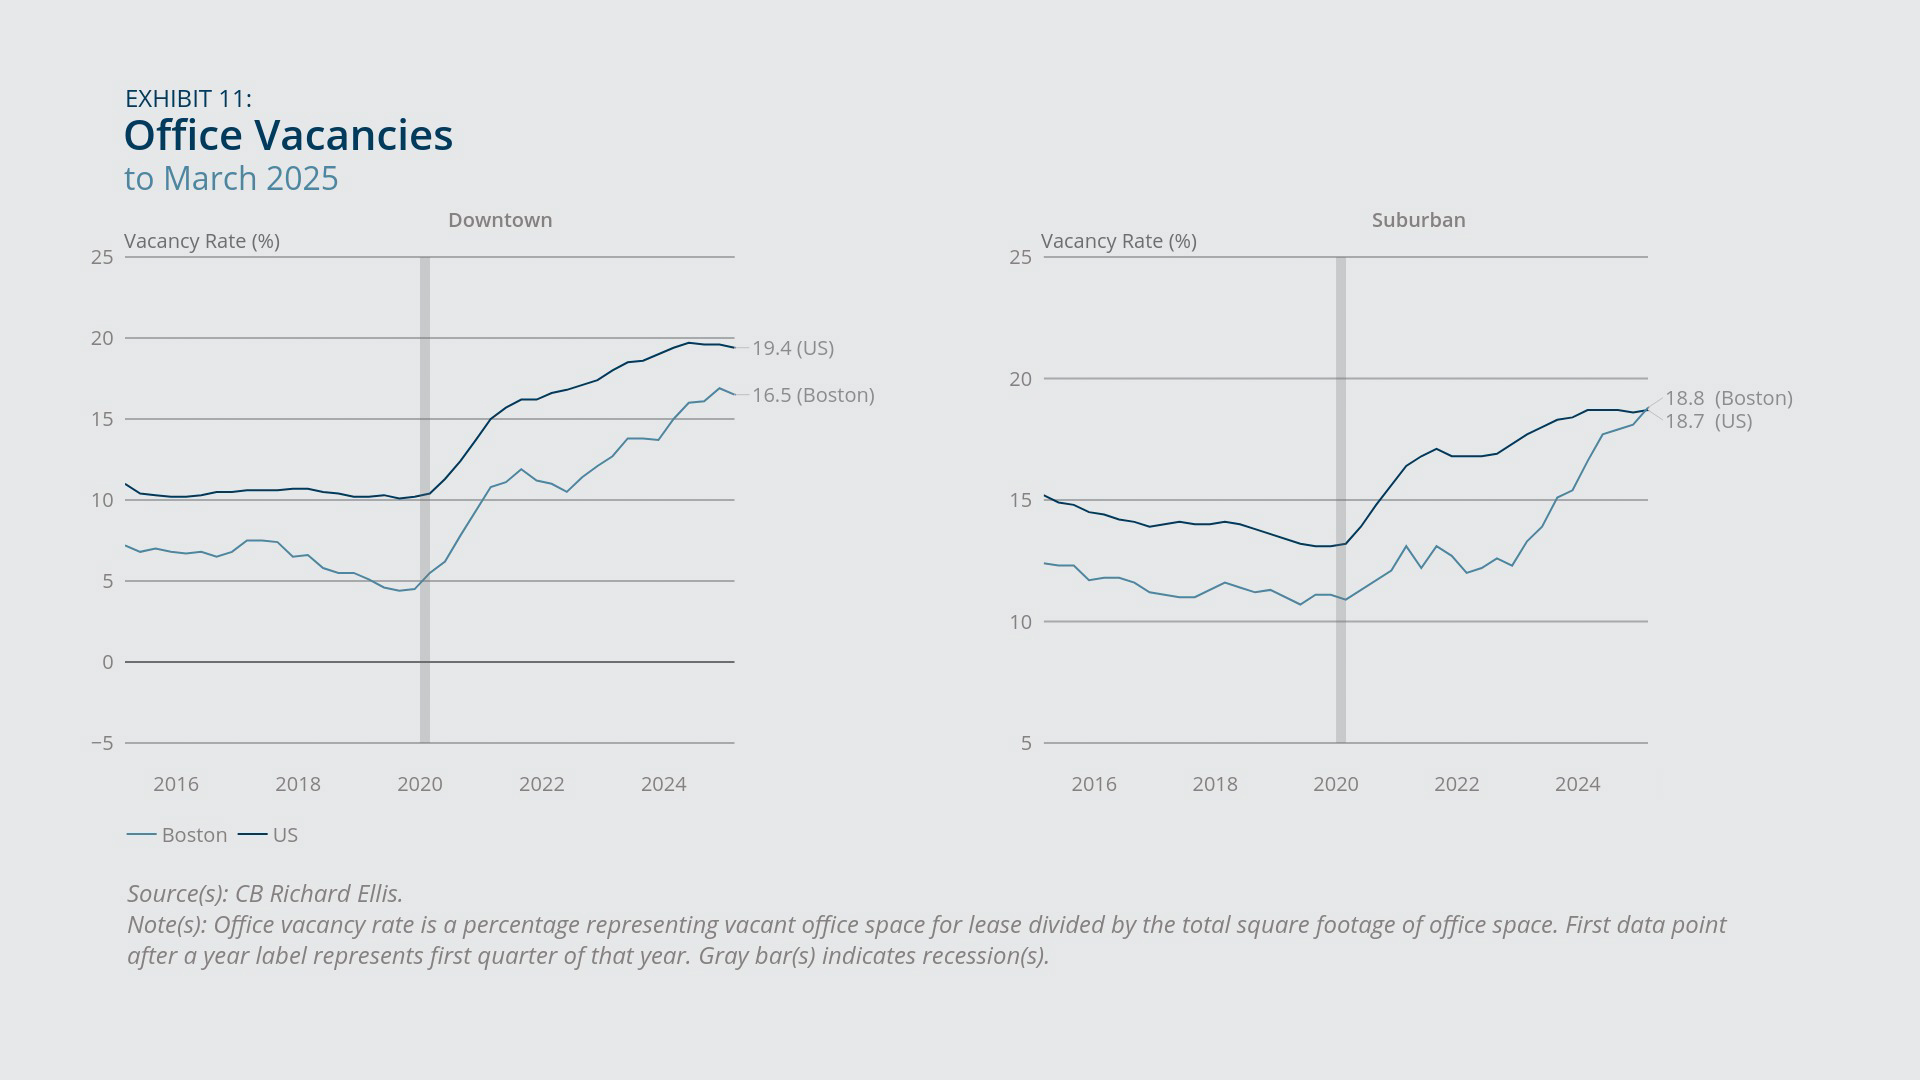
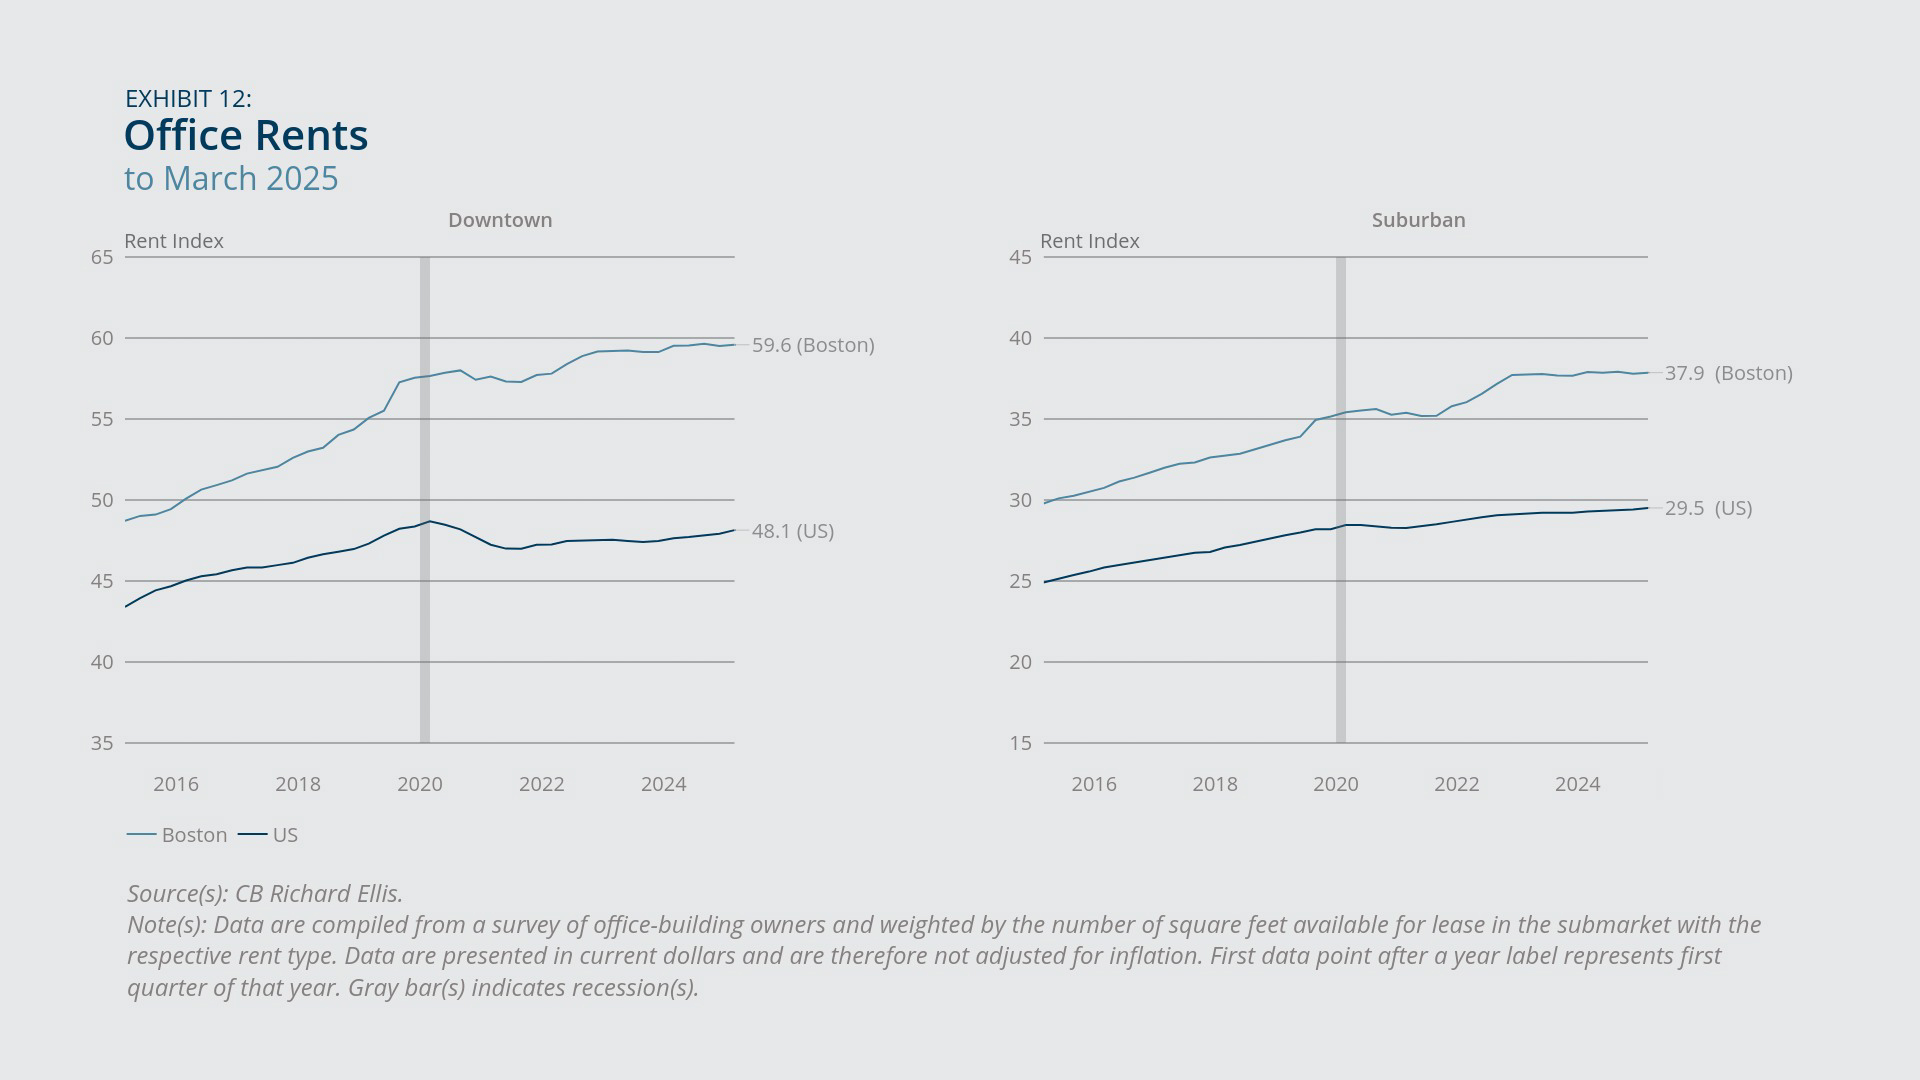
- House prices in New England grew faster than those in the country as a whole from 2024:Q1 to 2025:Q1. However, the office market remained soft in Boston, especially the suburban area, which saw a rising vacancy rate and slightly declining rents.
Sign up for new research and data on the New England economy.
Payroll Employment
- New England’s payroll employment in April 2025 was 0.5 percent higher than a year prior.
- The educational- and health-services sector grew faster than other supersectors in New England from April 2024 to April 2025 despite the uncertainty surrounding federal funding.
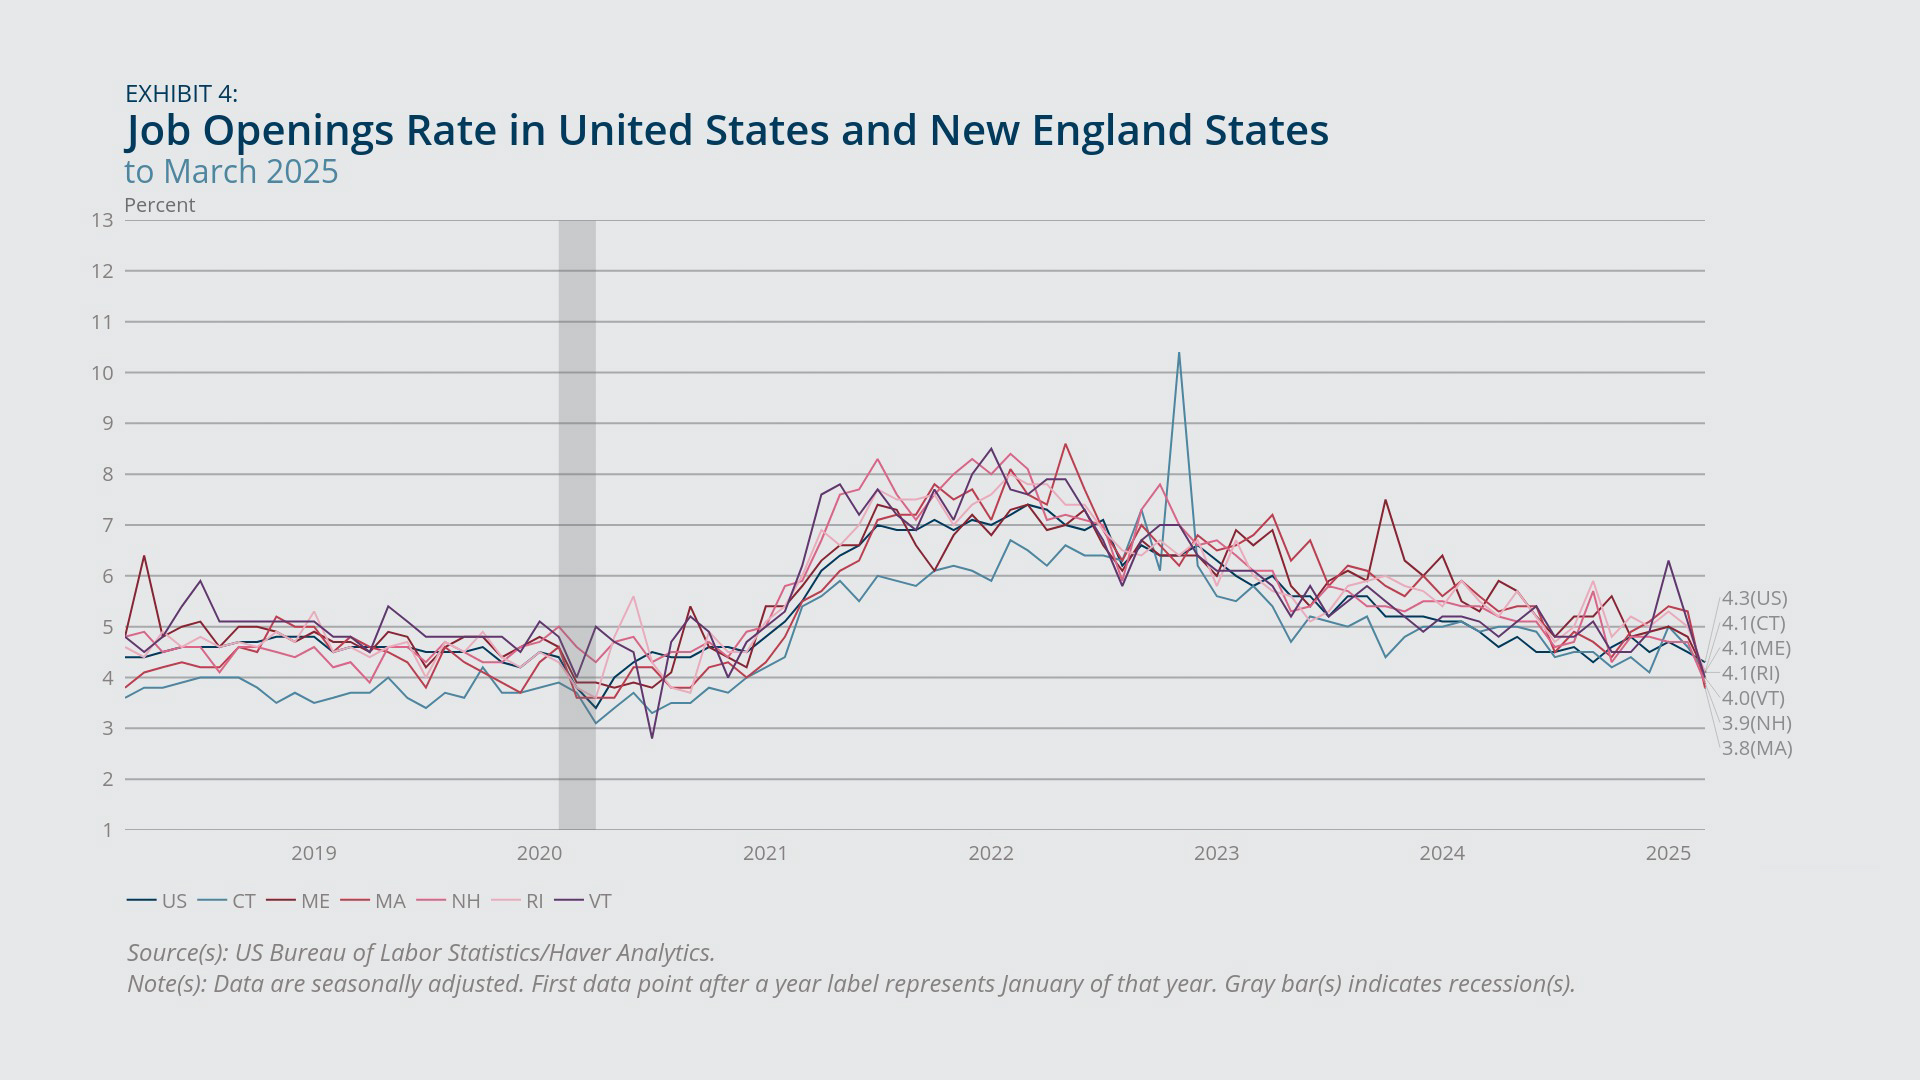
- Each New England state experienced a decrease in its job openings rate from March 2024 to March 2025 that was larger than the decrease in the US rate for that period.
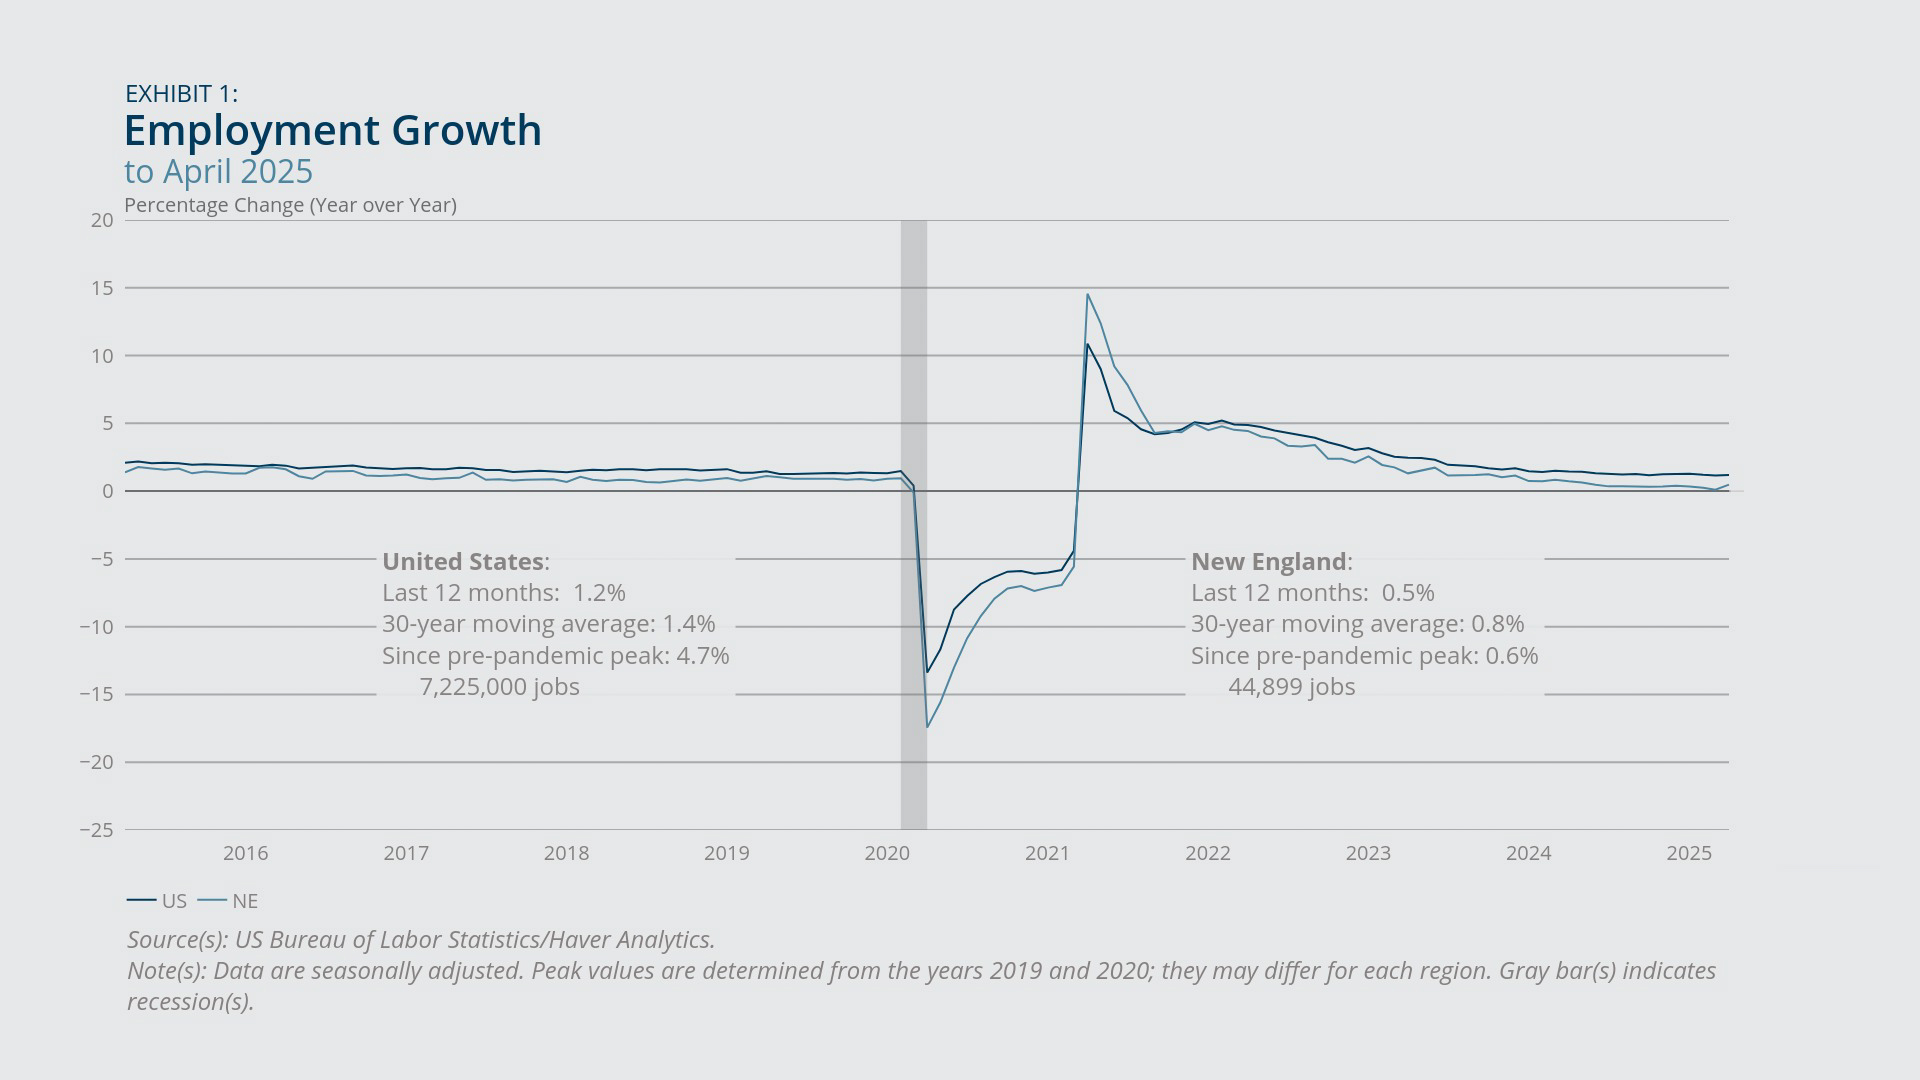
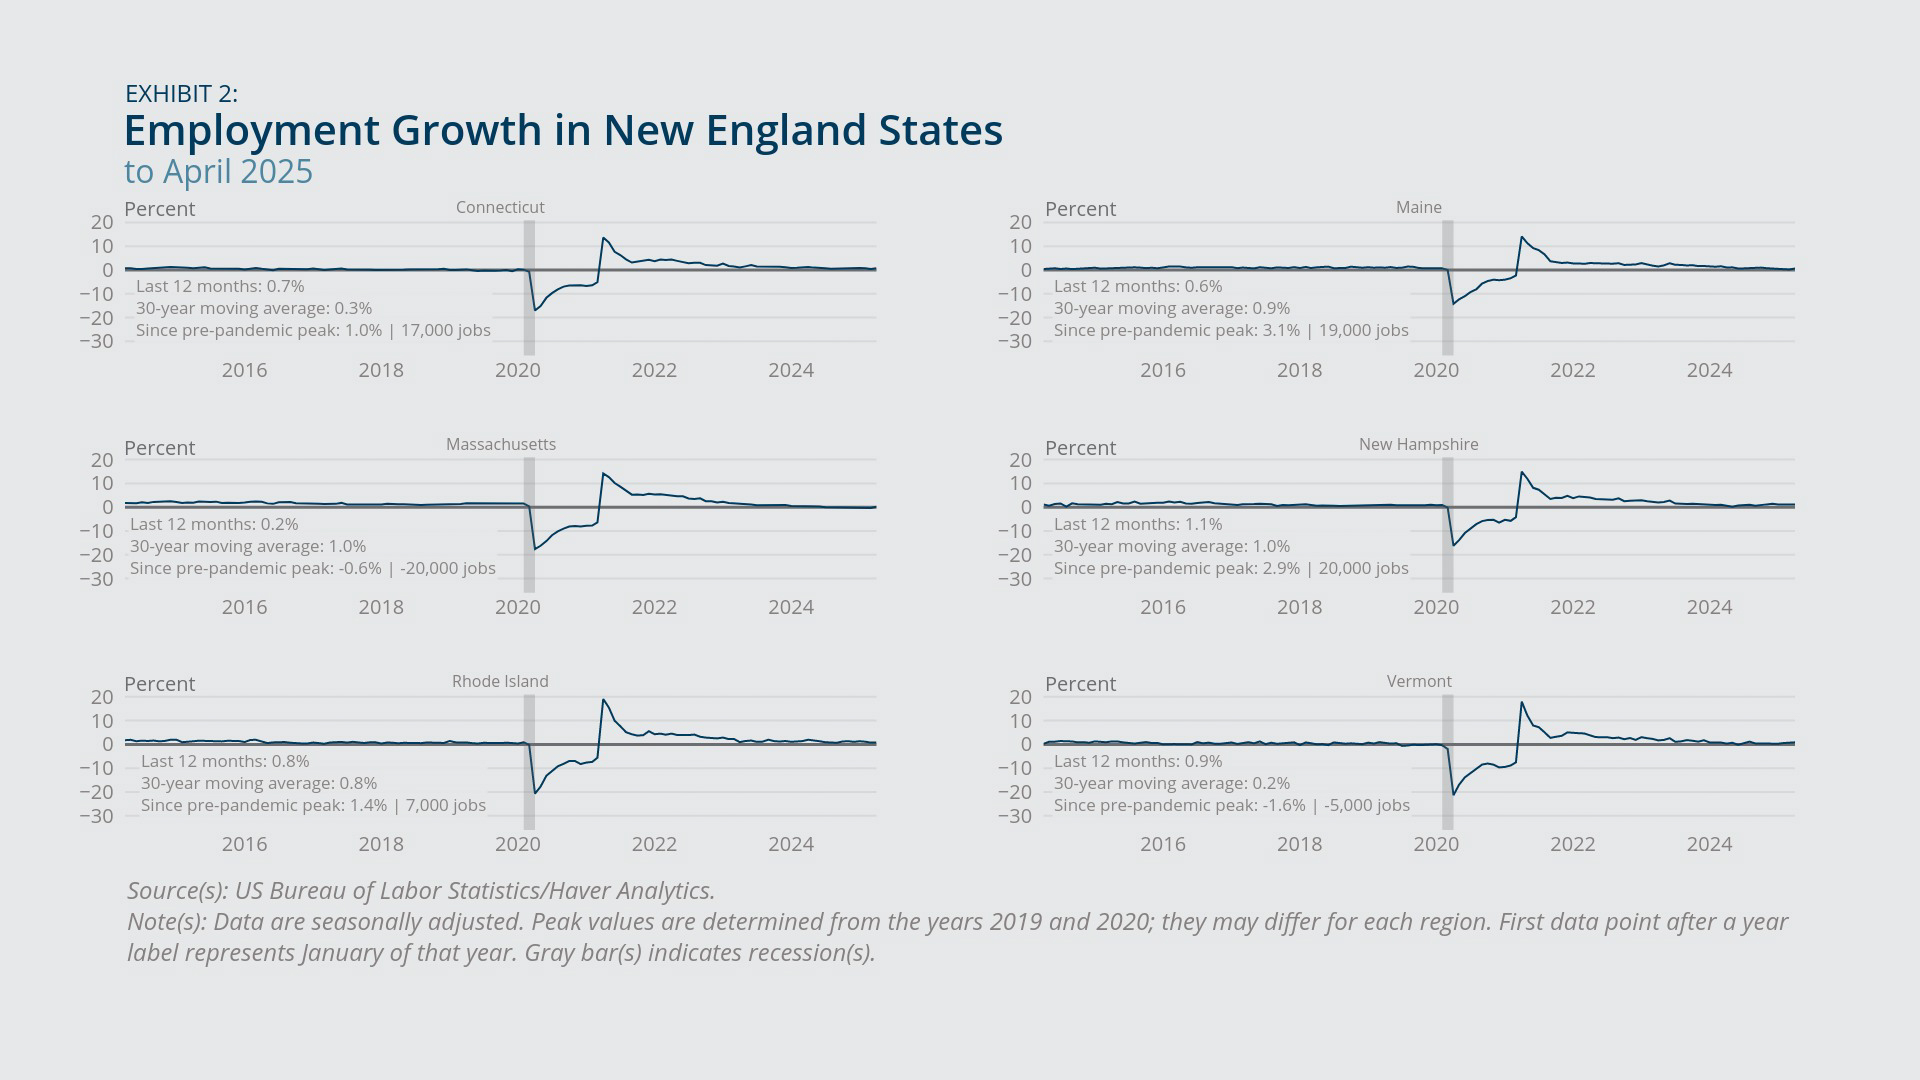
Since late 2021, year-over-year employment growth for New England has been trending gradually downward (Exhibit 1). It reached 0.5 percent for April 2025, which was lower than both its 30-year moving average rate of 0.8 percent and the US rate of 1.2 percent for the same month.1 Each state in the region still managed to post an increase in employment for April 2025 compared with a year prior. State-level year-over-year employment growth ranged from 0.2 percent for Massachusetts to 1.1 percent for New Hampshire (Exhibit 2).
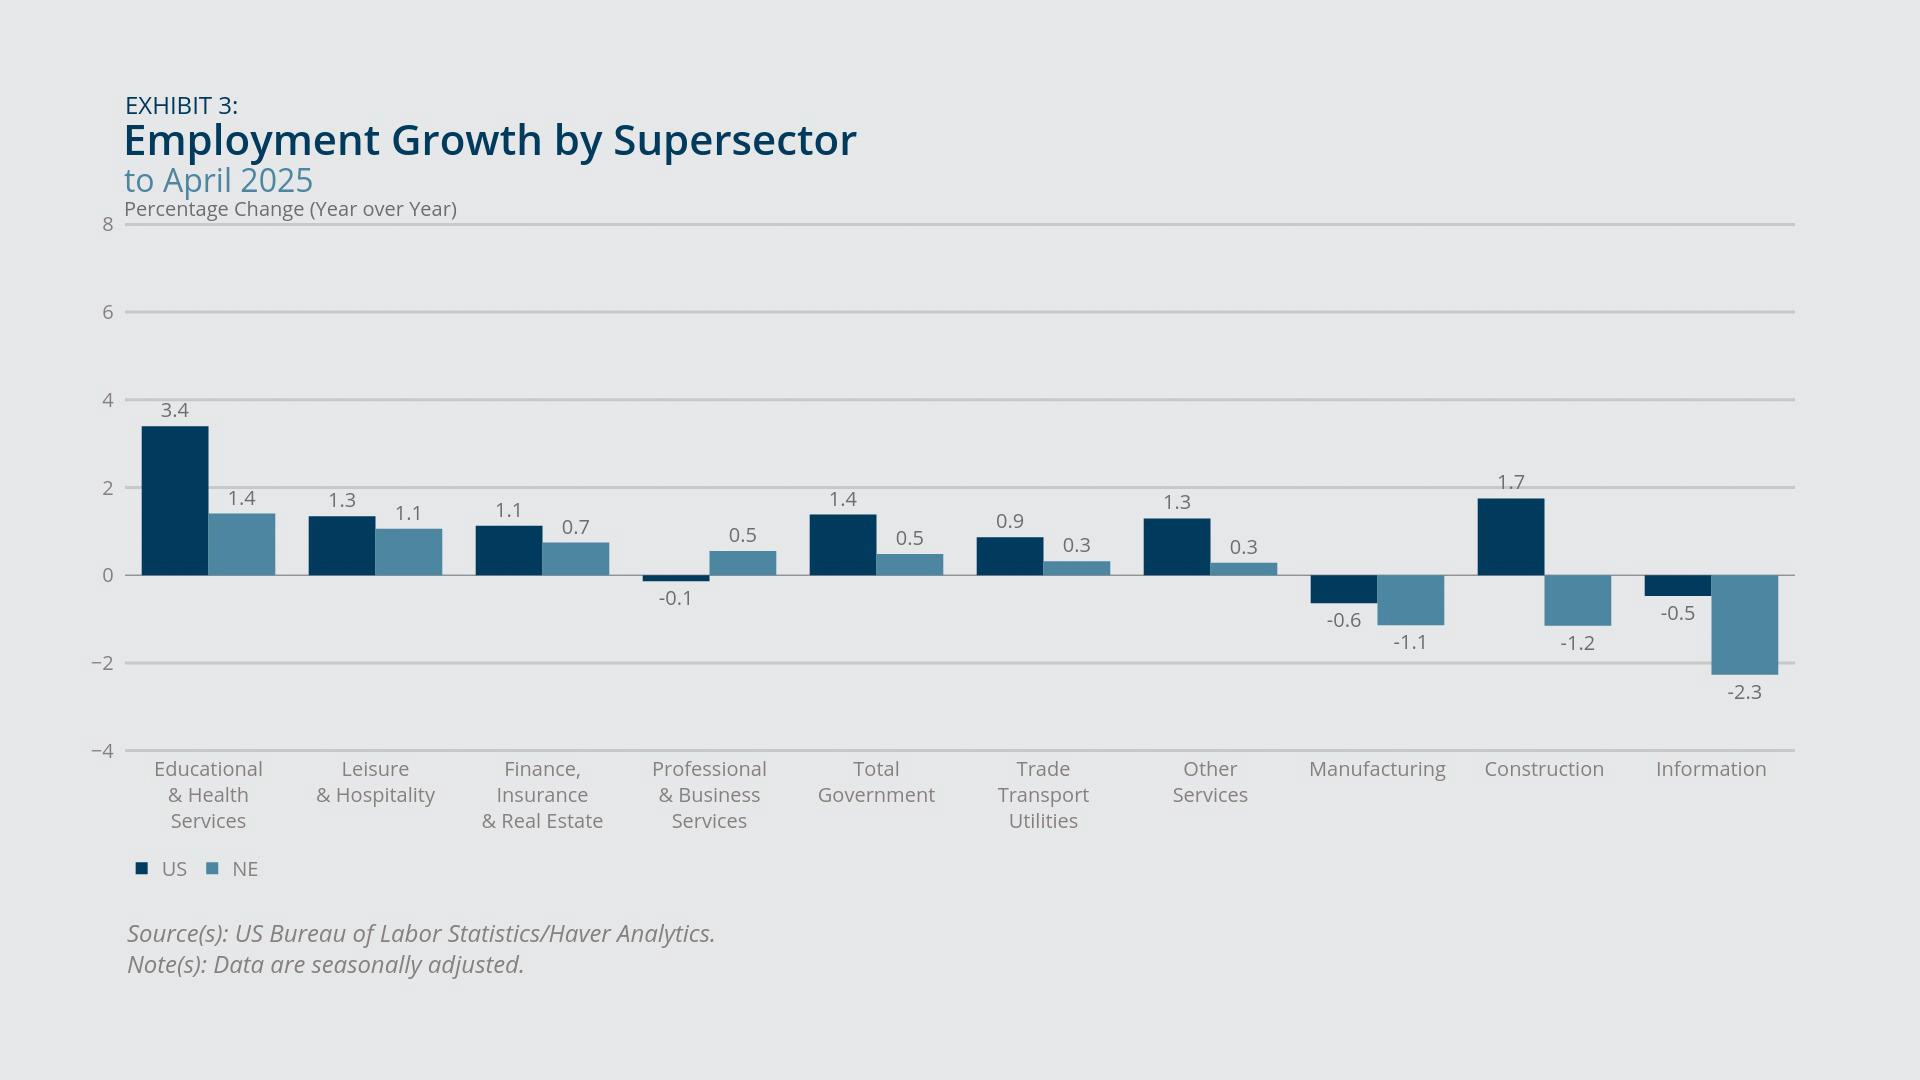
The educational- and health-services sector led all supersectors both in New England and across the country in employment growth from April 2024 to April 2025 (Exhibit 3). The supersector’s growth in the region was driven almost entirely by a 1.8 percent increase in health-care and social-assistance employment. Employment in educational services increased only 0.1 percent during the same period. Due to federal funding cuts, Harvard, MIT, and some other colleges implemented hiring freezes in recent months.2 The information sector, the construction sector, and the manufacturing sector in New England experienced job losses over that period.
Each New England state experienced a decline in its job openings rate from March 2024 to March 2025 (Exhibit 4). The decrease ranged from 0.8 percentage point for Connecticut to 1.8 percentage points for Massachusetts. They were larger than the decrease of 0.6 percentage point for the United States during that period.

Federal Reserve Bank of Boston
Federal Reserve Bank of Boston
Federal Reserve Bank of Boston
Federal Reserve Bank of Boston
Household Employment
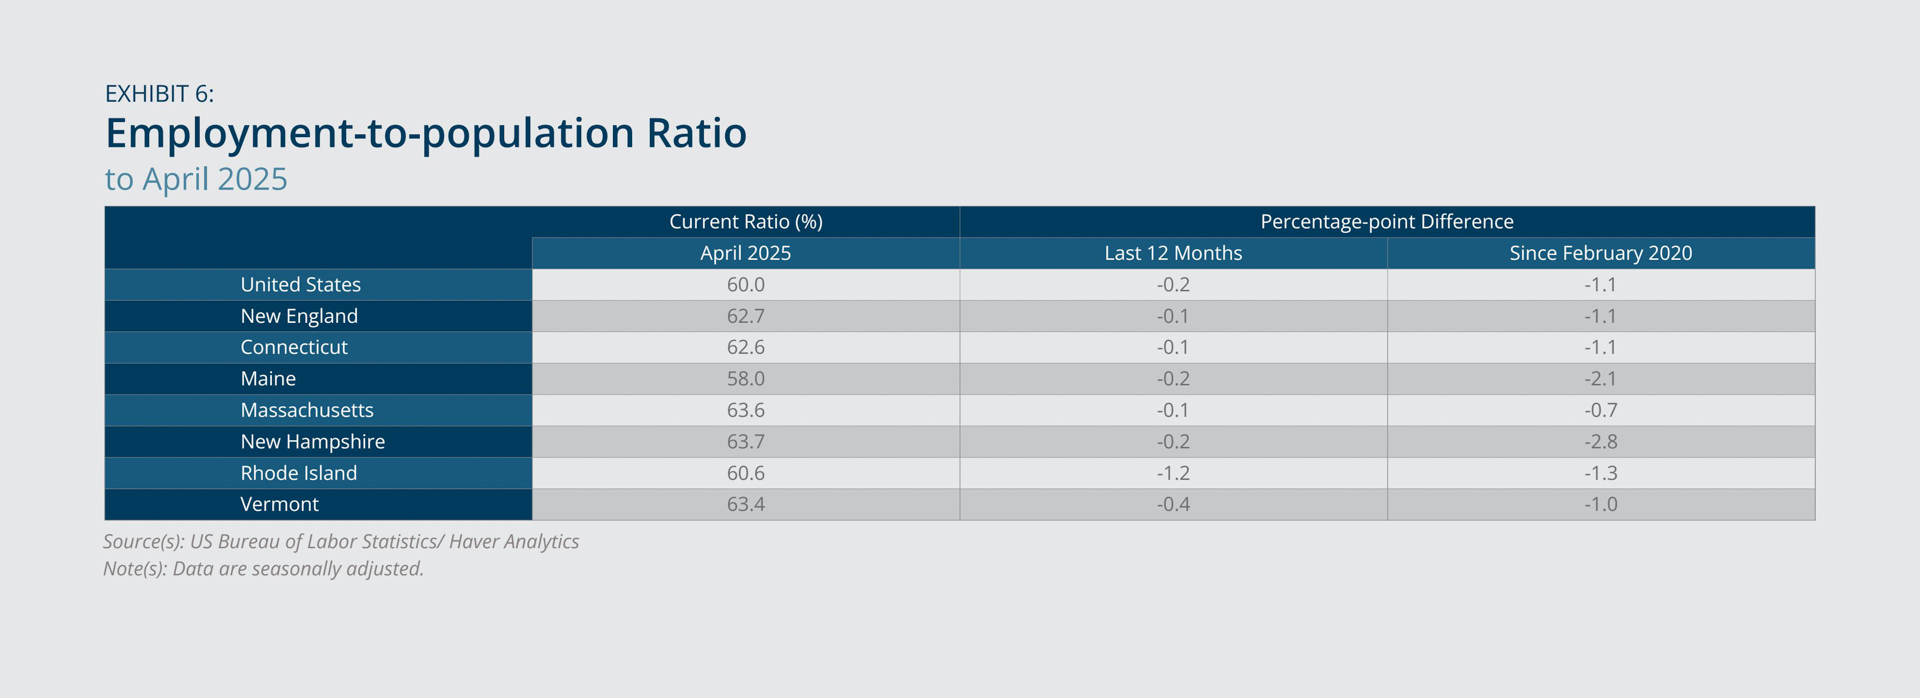
- New England experienced an increase in its unemployment rate and a decrease in its employment-to-population ratio over the 12-month period ending in April 2025.
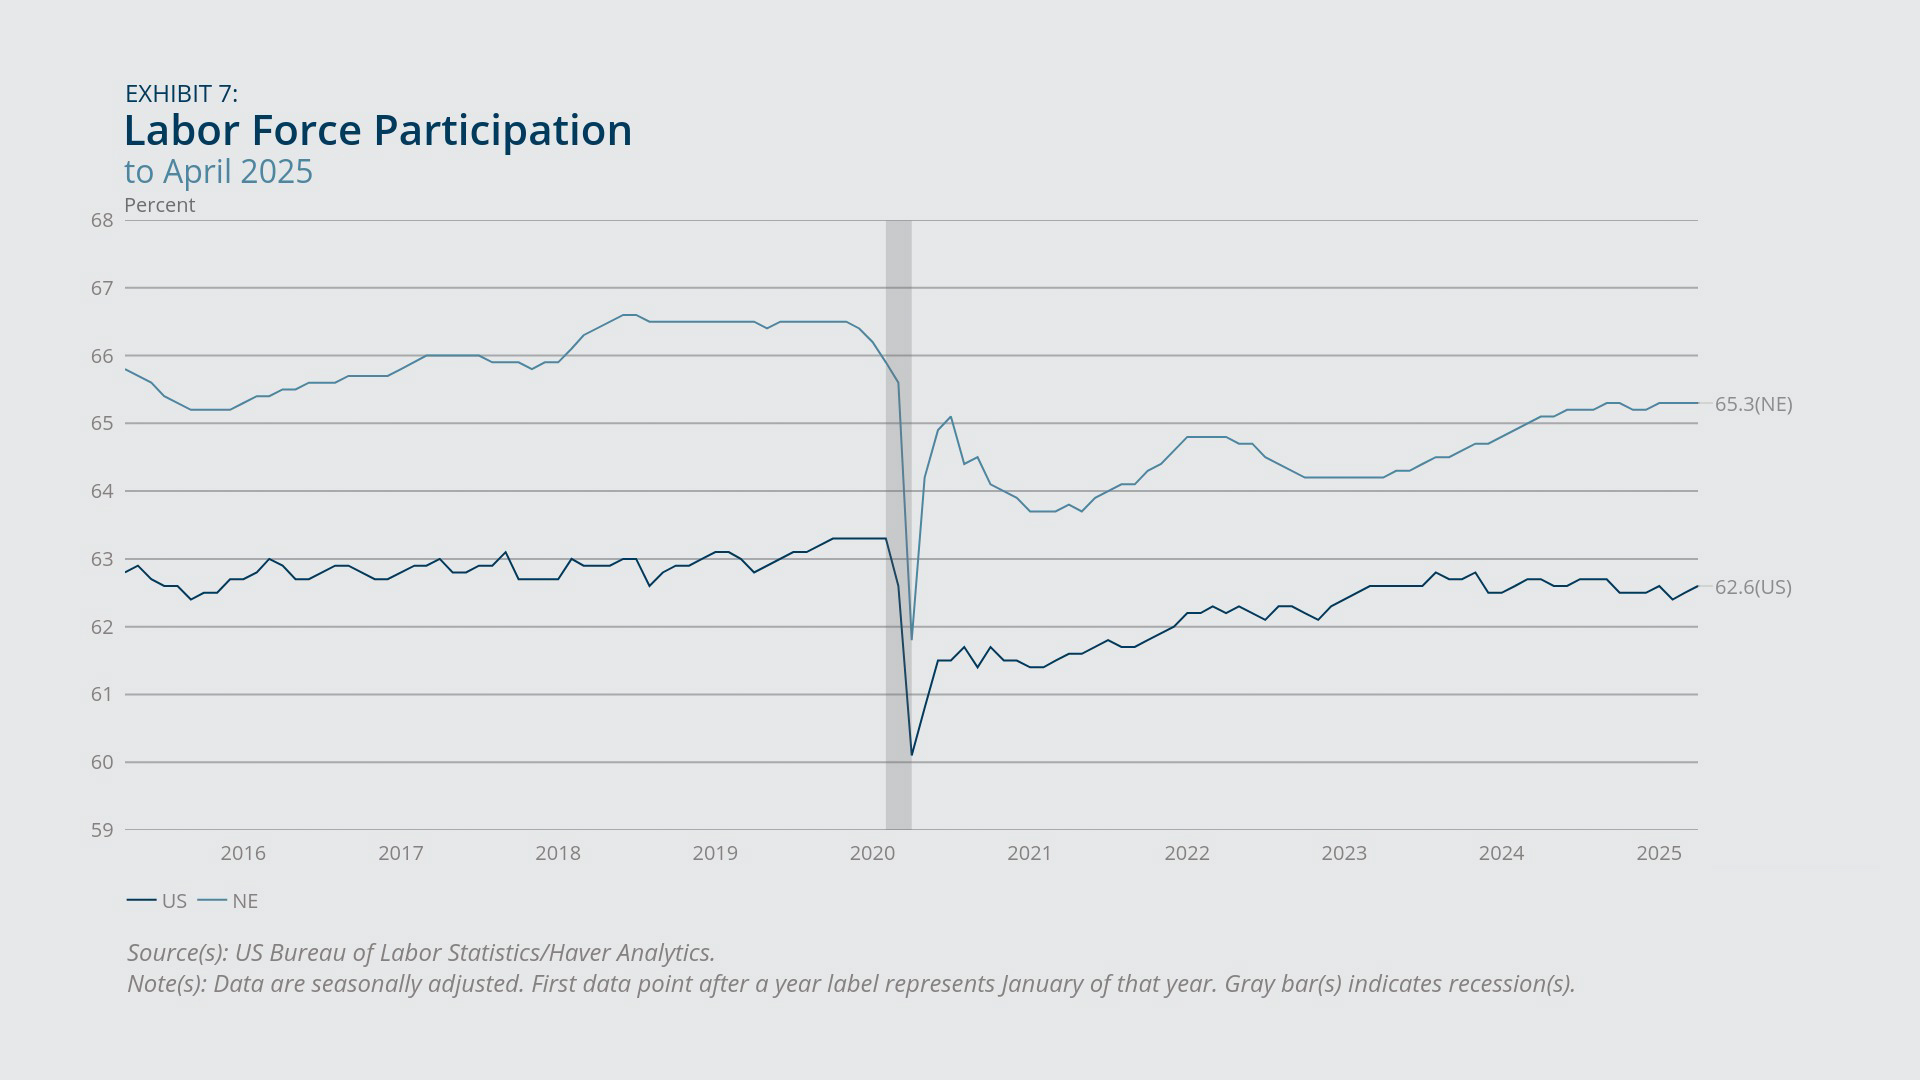
- In recent months, the labor force participation rate in New England remained stable and below the pre-pandemic level.
New England and the United States both saw their unemployment rates increase from April 2024 to April 2025, by 0.7 and 0.3 percentage point, respectively (Exhibit 5). Each state in the region posted an increase in its unemployment rate for April 2025 compared with a year prior. Vermont and New Hampshire had the third- and seventh-lowest unemployment rates in the country, respectively.3 Conversely, Rhode Island had the fifth highest state unemployment rate in the country that month.
In April 2025, New England’s employment-to-population ratio decreased 0.1 percentage point from a year prior, while the national ratio decreased 0.2 percentage point over the same 12-month period (Exhibit 6). Compared with other New England states and the United States, Rhode Island experienced a much larger drop of 1.2 percentage points.
In addition, labor force participation in New England has remained largely flat since last fall (Exhibit 7). As a result, it was still well below the pre-pandemic level. The US rate leveled off even earlier, in 2023.
Federal Reserve Bank of Boston
Federal Reserve Bank of Boston
Federal Reserve Bank of Boston
Inflation
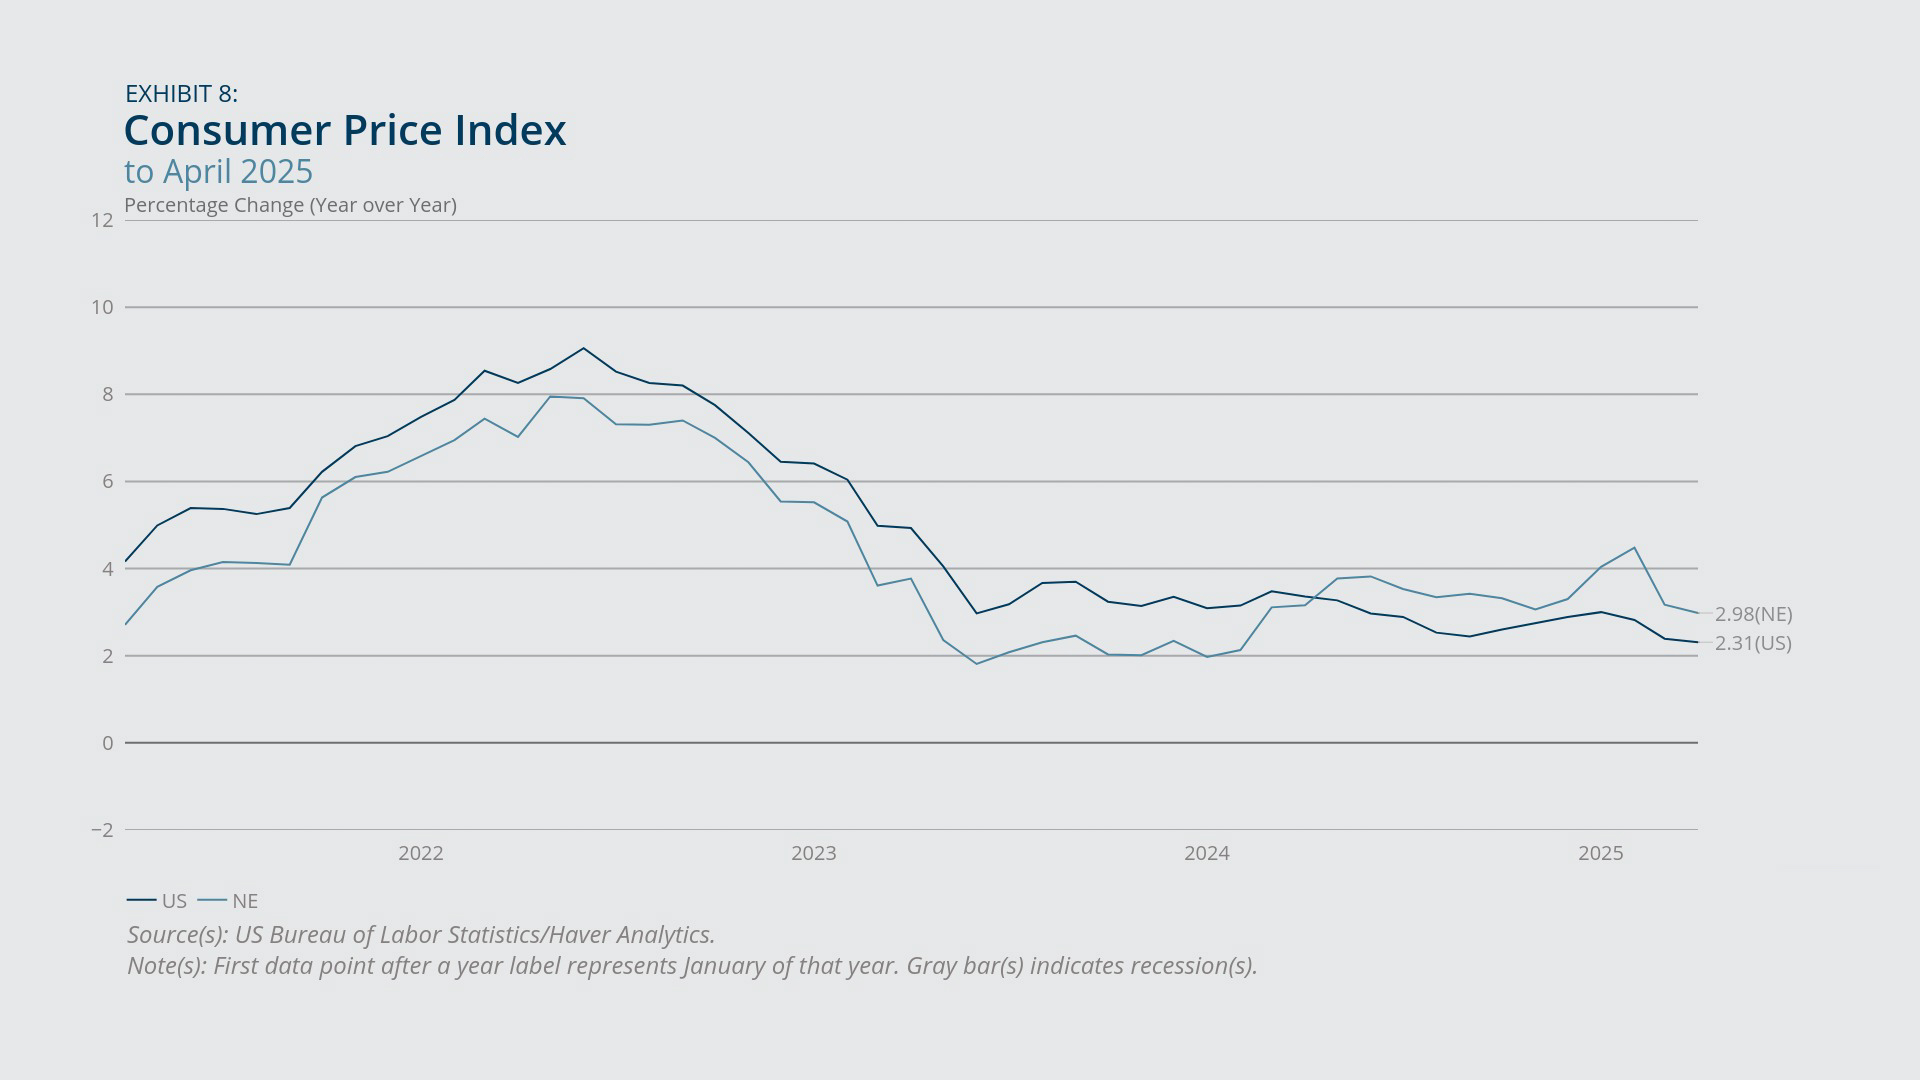
- New England saw a large drop in overall inflation from February 2025, but the rate remained considerably higher than the US inflation rate in April 2025.
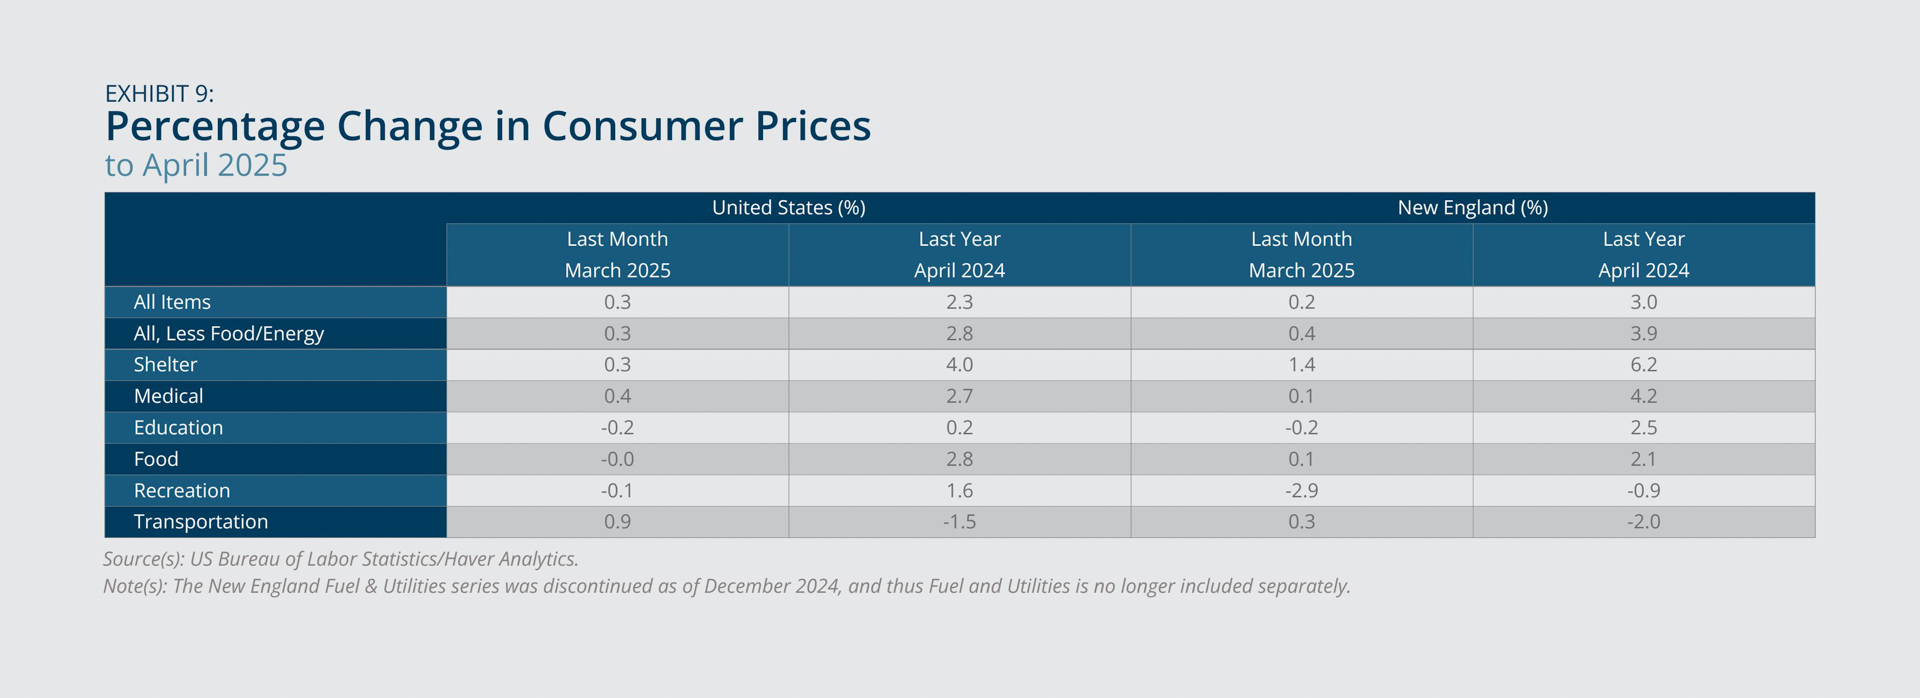
- Shelter prices in New England increased more than 6 percent from April 2024 to April 2025, while transportation prices decreased 2 percent.
According to the year-over-year change in the Consumer Price Index, New England saw a decrease of 1.5 percentage points in overall inflation from February to April 2025 (Exhibit 8). Despite the recent drop, the regional rate was still nearly 3 percent, which was higher than the national rate of 2.3 percent for April 2025.
The relatively high inflation in New England was mostly driven by a large year-over-year increase in shelter prices, which rose more than 6 percent from April 2024 to April 2025 (Exhibit 9). By contrast, transportation prices in the region dropped 2 percent compared with a year prior. The decrease is entirely attributable to a 13.4 percent drop in gasoline prices.
Federal Reserve Bank of Boston
Federal Reserve Bank of Boston
Real Estate Markets
- Compared with the country as a whole, New England saw stronger year-over-year house-price growth for 2025:Q1.
- The office vacancy rate rose in both downtown and suburban Boston, while Boston’s suburban office rents declined slightly from a year prior.
New England saw stronger annual house-price growth in 2025:Q1 compared with the nation (Exhibit 10). Rhode Island and Connecticut claimed the No. 1 and No. 3 spots nationwide with a year-over-year increase of 11 percent and 9 percent, respectively.4
The office market in the Boston area told a different story. Boston’s downtown and suburban office vacancy rates in 2025:Q1 were higher than the rates in 2024:Q1 by 1.5 and 2.2 percentage points, respectively (Exhibit 11). The US downtown and suburban office vacancy rates did not change from a year prior. As a result, Boston’s suburban office vacancy rate exceeded the US rate for the first time in the past 10 years.
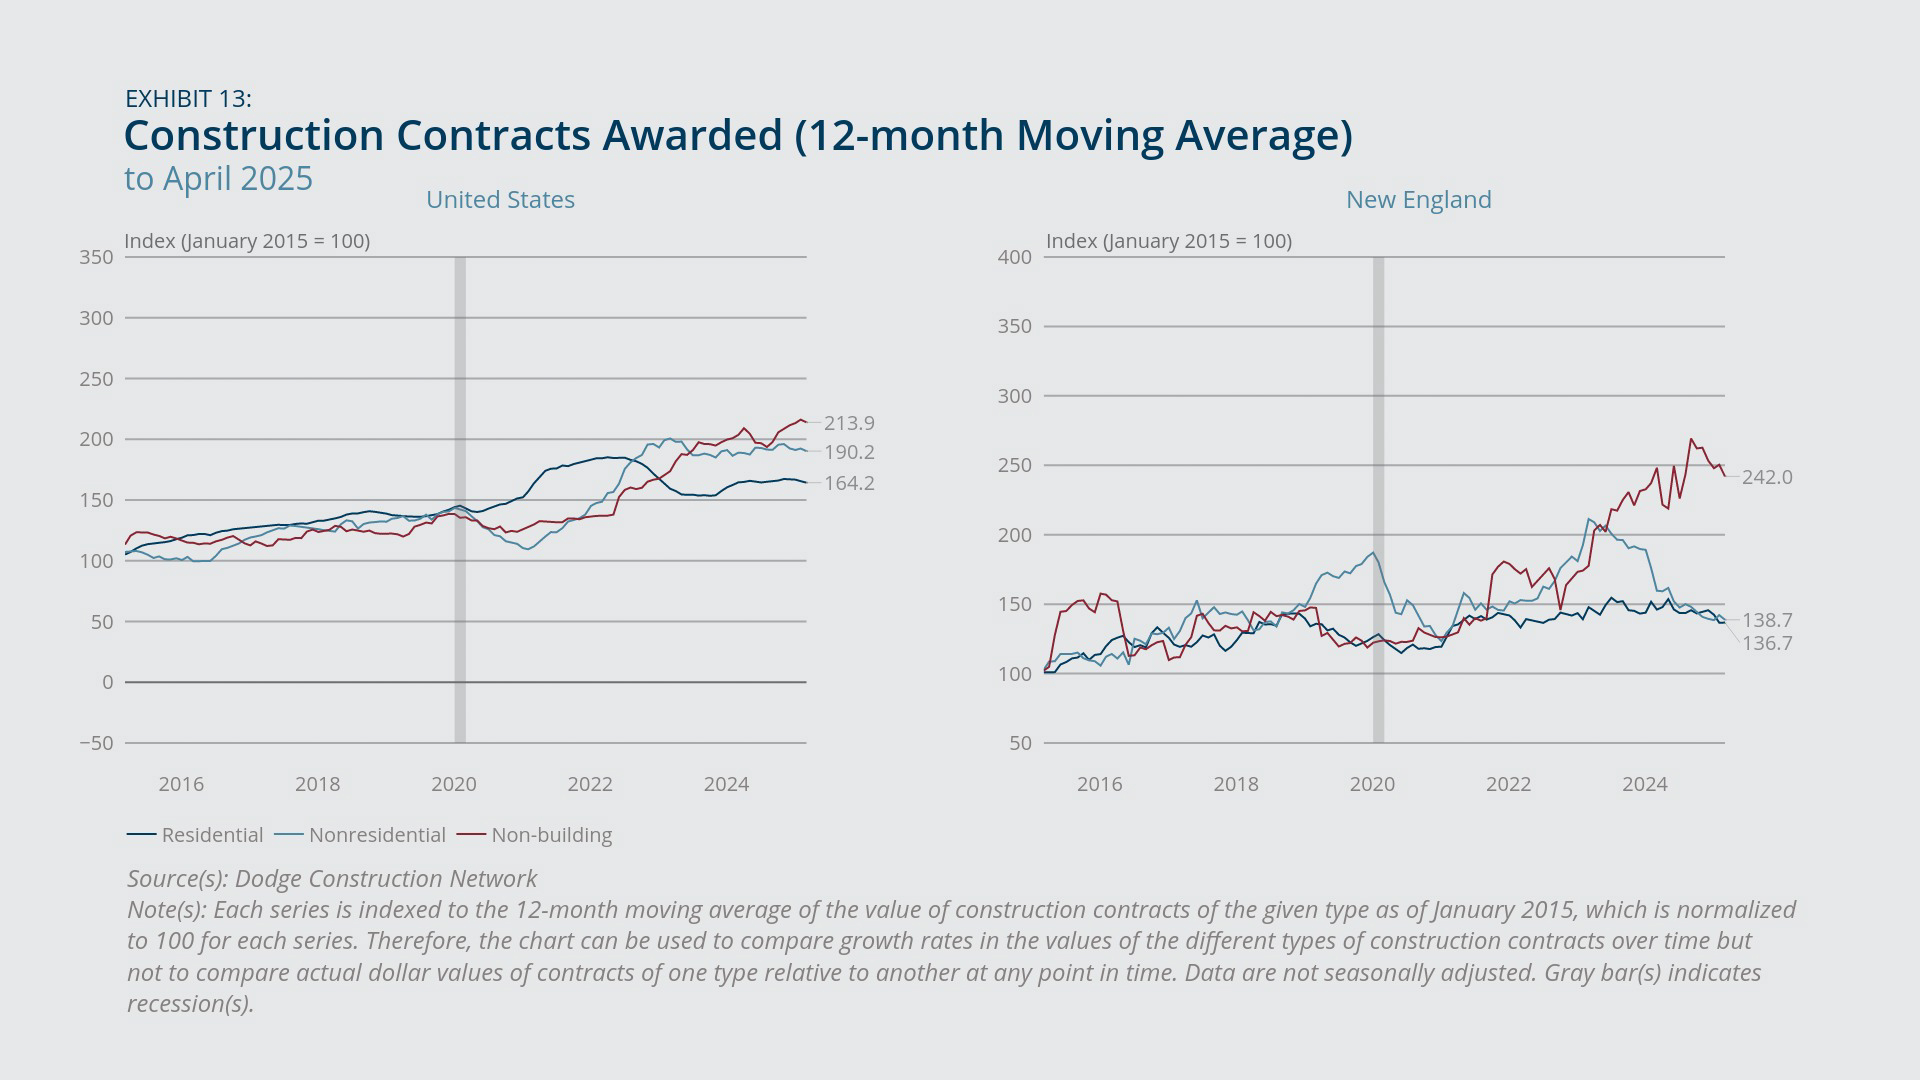
Rising vacancy rates put downward pressure on office rents in the Boston area. Therefore, its suburban office rent dropped 0.1 percent year-over-year (Exhibit 12). Facing a low demand for the office market, New England saw the value of nonresidential construction contracts awarded continue a declining trend that started in 2023 (Exhibit 13).
Federal Reserve Bank of Boston
Federal Reserve Bank of Boston
Federal Reserve Bank of Boston
Federal Reserve Bank of Boston
Endnotes
- While regional employment growth was slower than national employment growth, that trend is consistent with the historical norm. The regional rate was generally lower than the national rate in the period before the COVID-19 pandemic, as shown in Exhibit 1. New England’s 30-year moving average rate is also less than the US 30-year moving average rate. The slower regional employment growth is partly driven by population growth that is slower than the national rate.
- See Rachel Treisman, “Universities across the U.S. Freeze Hiring as Federal Funding Hangs in the Balance,” National Public Radio, March 12, 2025; Josh Moody, “Federal Funding Uncertainty Prompts Hiring Freezes,” Inside Higher Ed, February 19, 2025; Juliet Schulman-Hall, “As Johns Hopkins Cuts 2,200 Jobs, Mass. Colleges Mull if They Are Next,” MassLive, March 14, 2025.
- US Bureau of Labor Statistics, Local Area of Unemployment Statistics, https://www.bls.gov/web/laus/laumstrk.htm (accessed May 28, 2025).
- Federal Housing Finance Agency, “U.S. House Prices Rise 4.0 Percent over the Prior Year; Up 0.7 Percent from the Fourth Quarter of 2024,” news release, May 27, 2025.

 About the Authors
Bo Zhao,
Federal Reserve Bank of Boston
Bo Zhao is a principal economist with the New England Public Policy Center in the Federal Reserve Bank of Boston Research Department.
Email: Bo.Zhao@bos.frb.org
Acknowledgments
Kelly Jackson, a senior data analyst in the Federal Reserve Bank of Boston Research Department, prepared the exhibits for this memo.
Resources
Keywords
- Regional economy ,
- Economic Conditions ,
- New England ,
- NEPPC