New England Economic Conditions through September 2, 2025 


Key Takeaways
- New England’s labor market displayed ongoing sluggishness in July, with only weak (0.4 percent) employment growth from one year earlier and year-over-year job losses in three sectors. Nonetheless, the unemployment rate was unchanged from the previous month, and various evidence pointed to weak hiring activity over the past 12 months, rather than mounting layoffs.
- Consumer Price Index (CPI) inflation in New England reached a 3.3 percent year-over-year pace in July, an increase from June’s rate and the highest since February 2025. US CPI inflation was more moderate, at 2.7 percent in July, as the United States saw increases in the prices of shelter and education that were less pronounced than those experienced by New England.
- House-price growth in New England on a year-over-year basis moderated further in June to its lowest rate in more than two years, despite staying well above the comparable rate for the United States. House prices declined outright in June from the previous month, in New England (–0.8 percent) as well as in the United States, on average (–0.2 percent), although the Boston metro area experienced a relatively modest decline in house prices in June (from May) compared with several other large metro areas.
- Consumer confidence in New England deteriorated somewhat in August from one year earlier, driven by a decrease in consumers’ future expectations, whereas their views about the present situation improved over that same period.
- A MassBenchmarks forecast for the remainder of 2025 calls for further moderate economic growth in Massachusetts, at rates above those projected for the United States in a recent Wall Street Journal survey.
Sign up for new research and data on the New England economy.
Payroll Employment
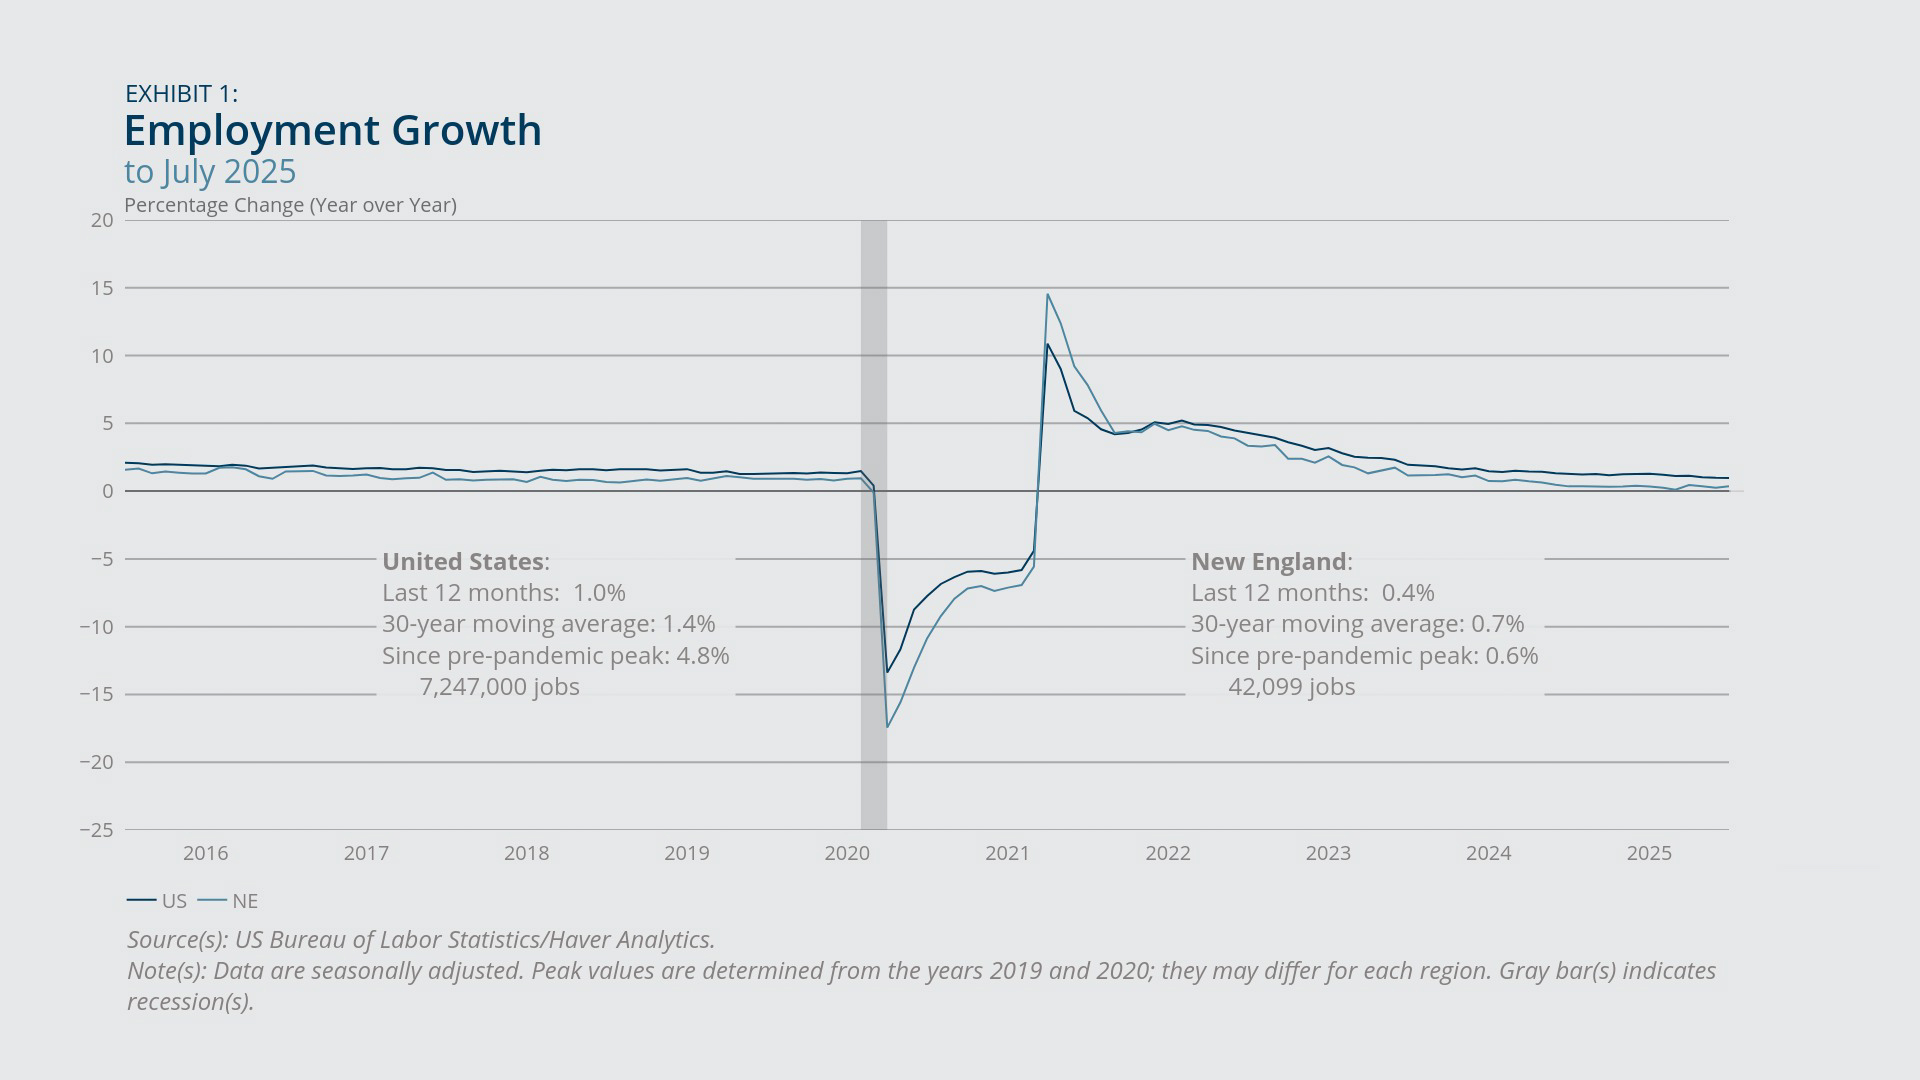
- Payroll employment growth in New England remained weak in July, at just 0.4 percent on a year-over-year basis (Exhibit 1). That’s below the region’s 30-year moving average of 0.7 percent and marks the 14th straight month of growth rates below 0.5 percent.
- For each New England state, the net change in payroll employment from July 2024 to July 2025 was statistically insignificant.
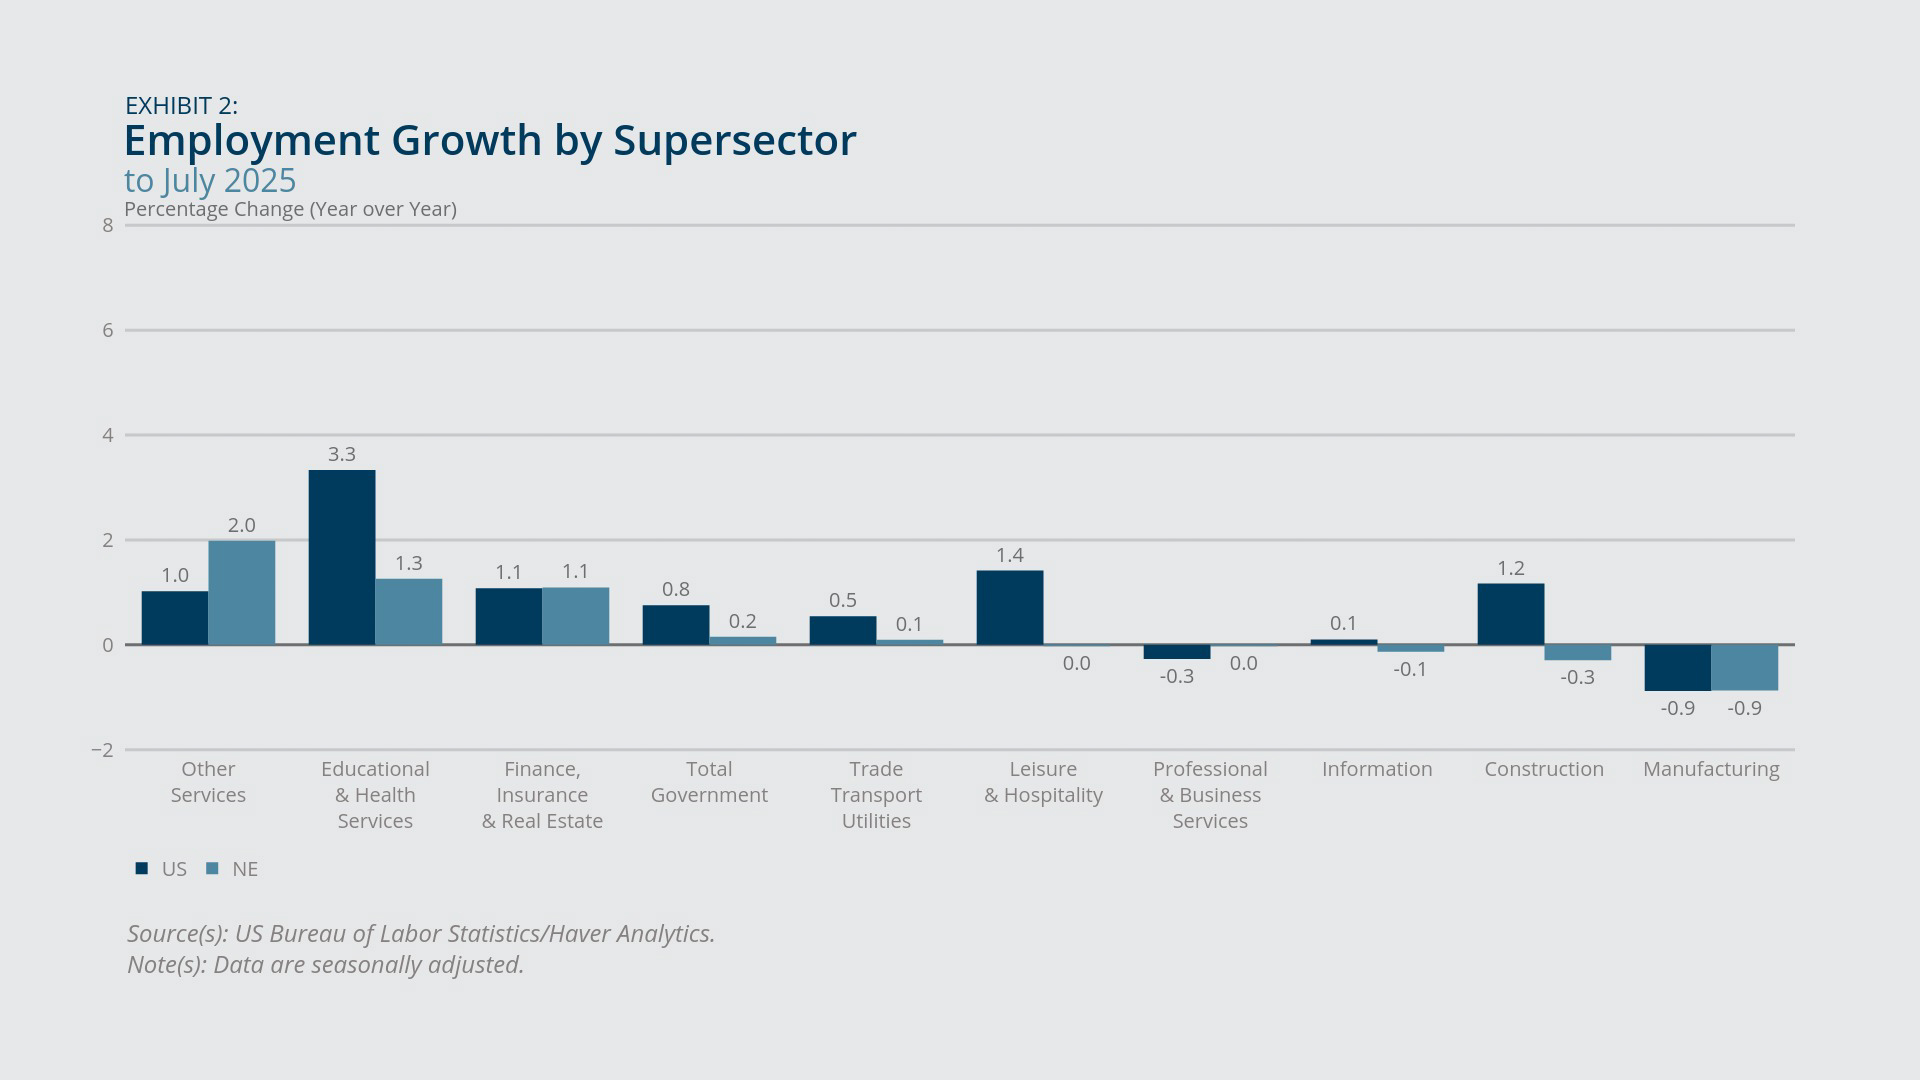
- Within New England, employment growth from one year ago was strongest in the “other services” sector and weakest in the manufacturing sector, which posted negative growth. Other services was the only sector in the region showing employment growth that was above the US average. (See Exhibit 2.)
- Employment growth remained negative in New England’s construction and information sectors (Exhibit 2), but the latest numbers reflect significant improvements compared with early 2024 (for information) and with early 2025 (for construction).
The payroll jobs data give an overall impression of a sluggish labor market, but with considerable variation across industries. The year-over-year employment growth rate in New England leveled off in 2025, to a very slow average rate of 0.3 percent, following a period (mid-2021 through mid-2024) in which employment growth fell back from the robust rates seen in the recovery from the pandemic recession (Exhibit 1). The latest reading also represents a considerable slowdown from the 2019 average (year-over-year) employment growth rate of 0.9 percent. Employment growth in the United States in July also lagged its 30-year moving average, but the slowdown in employment growth nationwide (since 2021 or compared with 2019) has not been as pronounced as it has been in New England. According to the Bureau of Labor Statistics, none of the individual New England states experienced a statistically significant change in the total number of payroll jobs from July 2024 to July 2025.1
The recent employment decline (–0.9 percent year-over-year) in New England’s manufacturing sector, although unwelcome, was more moderate than the declines observed in the first nine months of 2024, when manufacturing employment growth in the region ran at –2 percent or below. The US manufacturing sector has also been shedding jobs since October 2023, but, until the July results, that was occurring at a less rapid pace compared with New England. Employment growth in the region’s information sector remained negative in July, at –0.1 percent year-over-year, although that represents a big improvement from January 2024, when the sector experienced a 4 percent drop in payrolls from the previous year. The job loss rate also moderated recently (compared with early 2025) in the region’s construction sector.
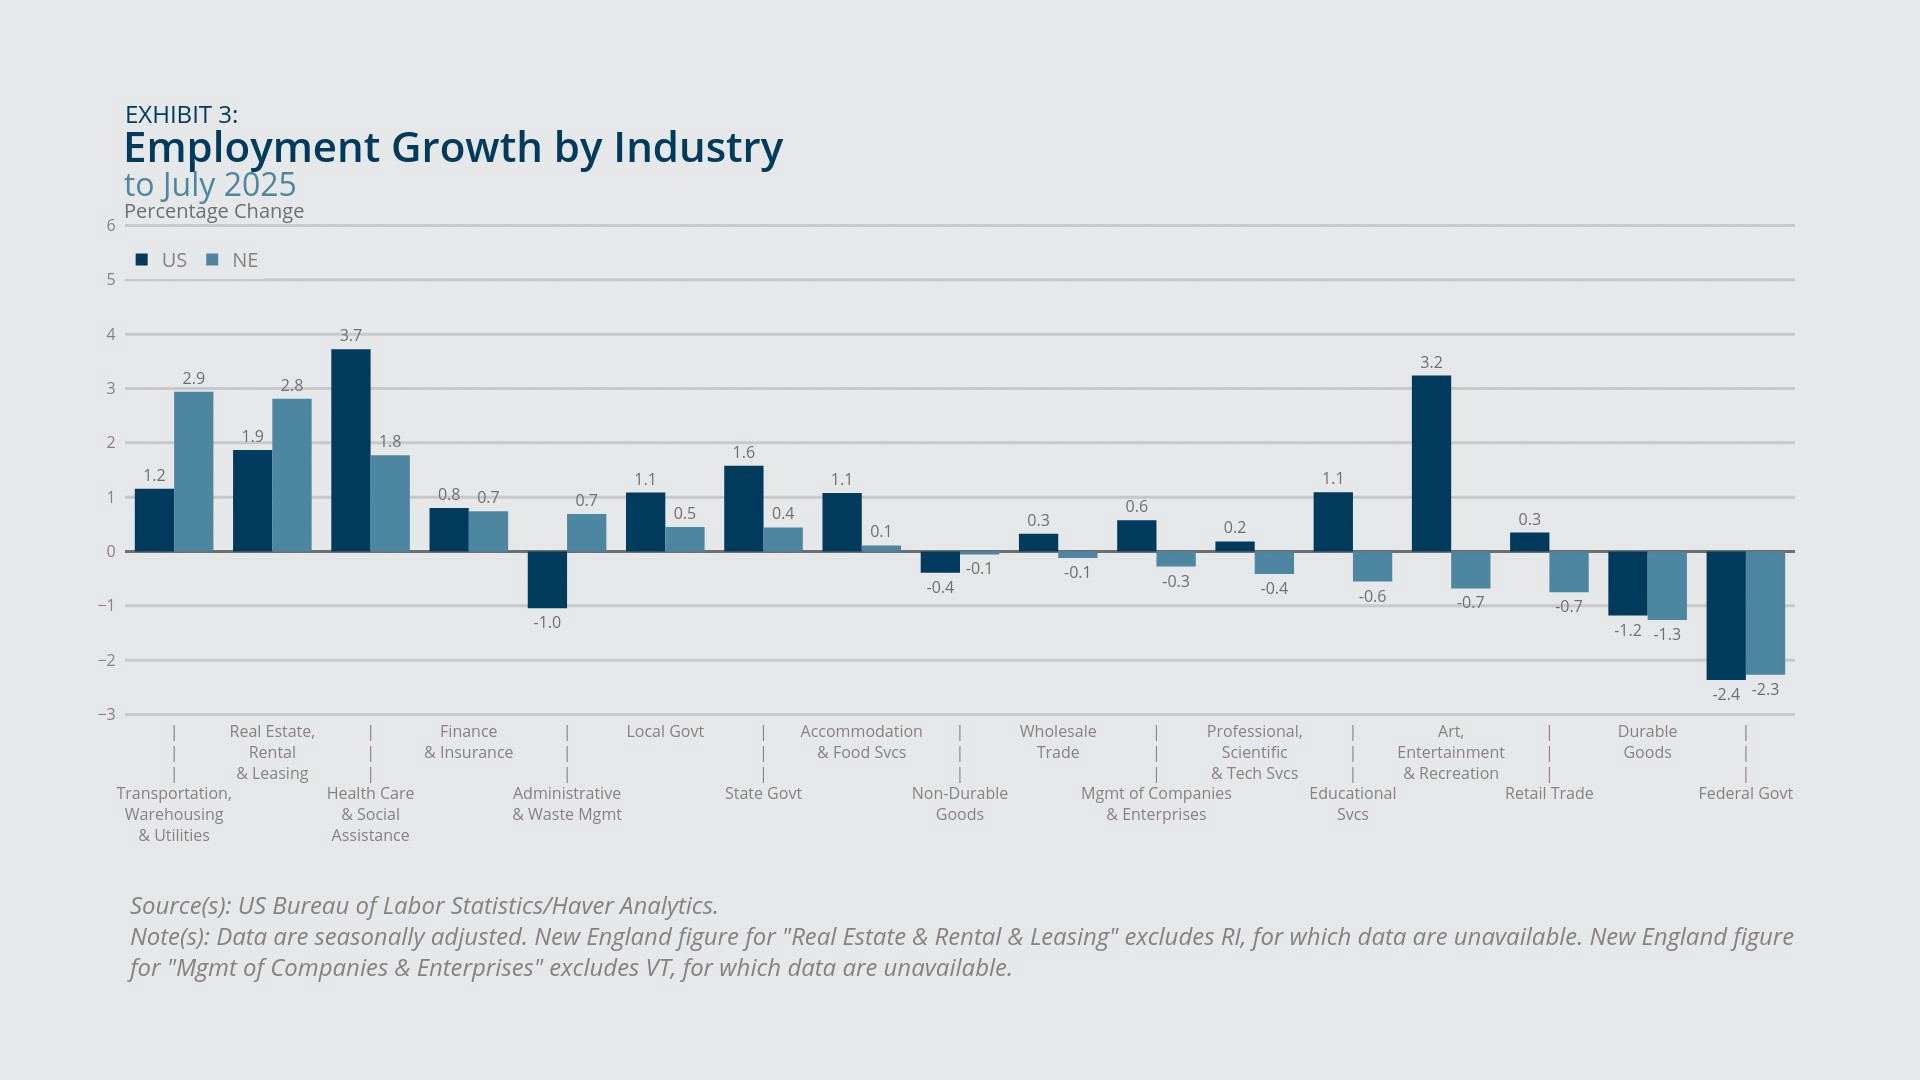
The top two industries (a narrower classification than sectors) for employment growth in New England were transportation/warehousing/utilities and real estate/rental/leasing, both of which had employment growth rates above the US average (Exhibit 3). New England’s health care/social assistance industry ranked third for employment growth within the region but lagged the US average employment growth for that industry. New England’s education services industry lost jobs in July from the previous year (–0.6 percent), for a second straight month of year-over-year losses; that represents a marked deterioration from 2024, when the industry posted an average job growth rate of 2.8 percent.
Higher education institutions most likely contributed to the decline in education employment in the region. In July, Boston University announced it was laying off 120 workers and eliminating 120 vacant positions as part of its plans to trim its budget 5 percent in fiscal year 2026.2 Harvard University announced layoffs starting in April 2025 and enacted further layoffs throughout the summer.3 Administrators at both institutions cited recent federal policy actions, such as cuts to federal funding for research, as the primary impetus for the layoffs. A great number of colleges and universities in the region are potentially exposed to those same federal policy changes, and the full implications for education employment in the region are yet to be determined.

Federal Reserve Bank of Boston
Federal Reserve Bank of Boston
Federal Reserve Bank of Boston
Household Employment
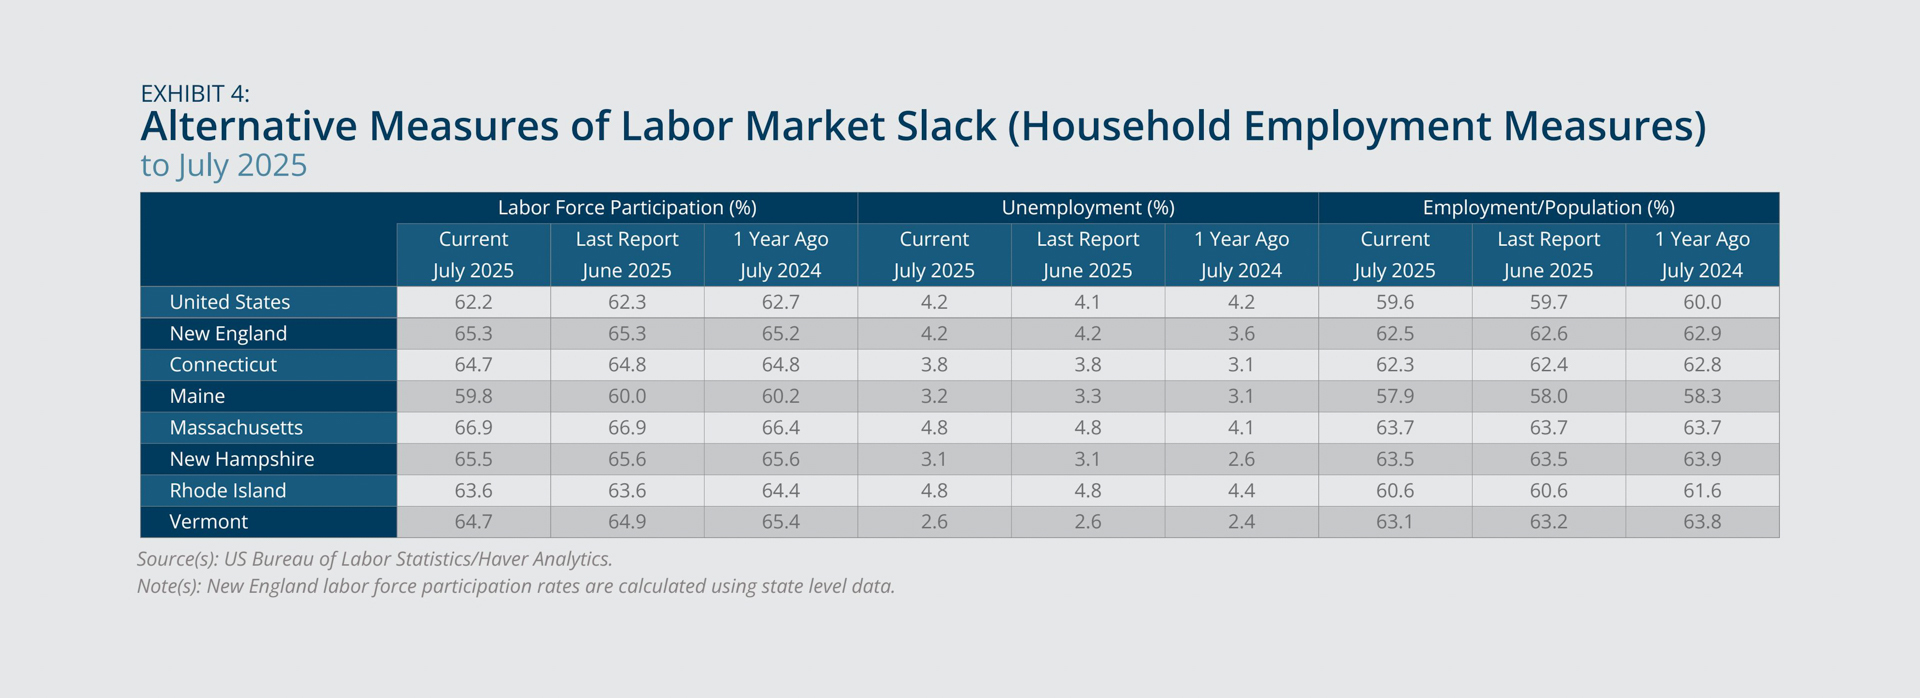
- New England’s unemployment rate in July, 4.2 percent, held steady from the preceding month but rose 0.6 percentage point from July 2024 (Exhibit 4).
- The US unemployment rate, also 4.2 percent in July, was up slightly from the preceding month but matched its July 2024 value.
- New England’s labor force participation rate outperformed the US participation rate over the past year (July 2024 through July 2025), rising slightly as opposed to declining moderately. However, Massachusetts alone drove the region’s overall increase in participation.
- The employment-to-population ratio subsided moderately in July from one year earlier in New England and in the United States overall.
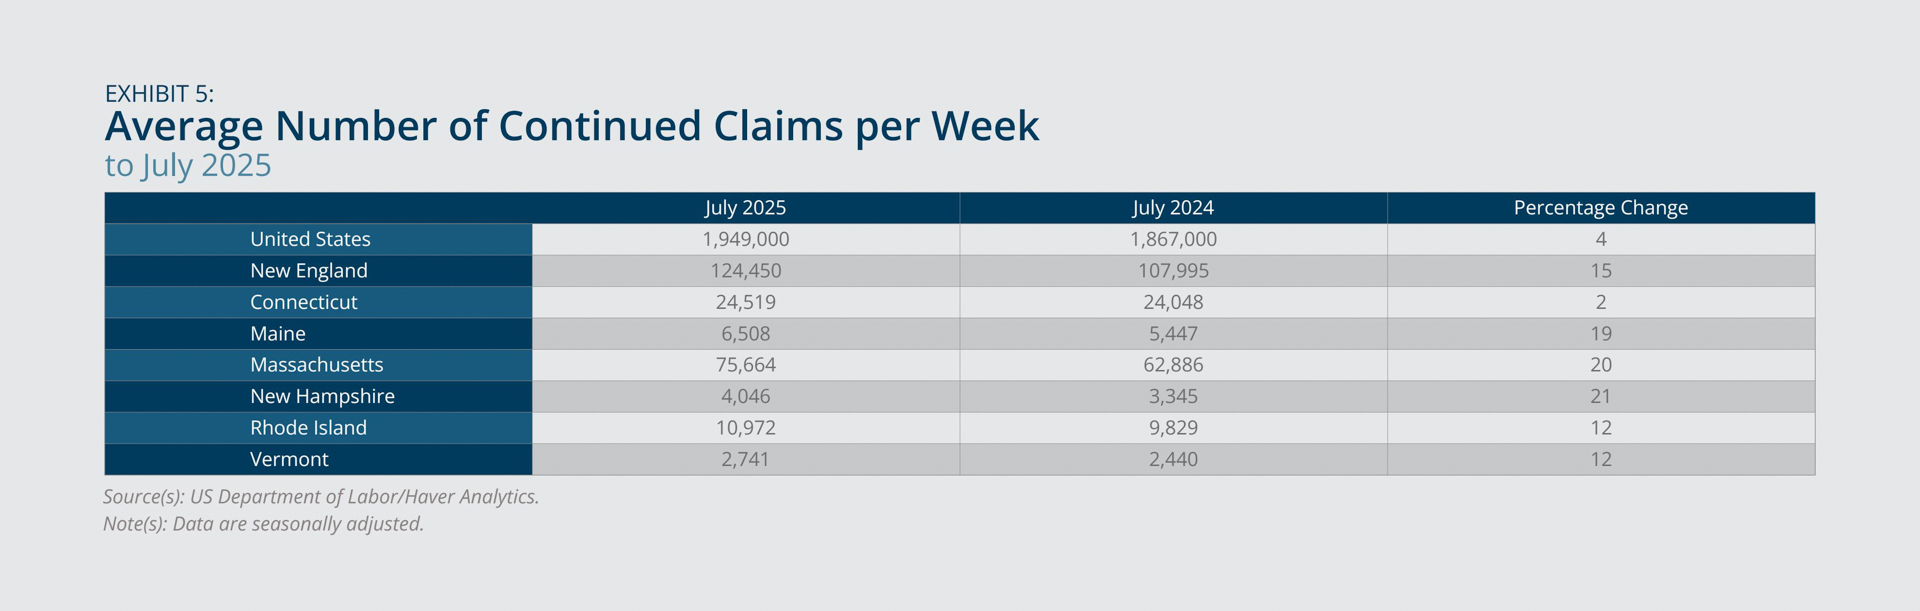
- Continued claims for unemployment insurance increased sharply in New England from one year earlier and rose only modestly in the United States overall (Exhibit 5).
Indicators of the household employment situation offered further signs of labor market cooling, even though unemployment rates remained moderate. The unemployment rate stood at 4.2 percent in July in both the United States and New England, representing a moderate increase for the region and no change nationwide, both compared with one year earlier (Exhibit 4). All six New England states posted at least slight increases in their respective unemployment rates in July 2025 from one year earlier (Exhibit 4). The increases were statistically significant in Connecticut, Massachusetts, and New Hampshire and insignificant in the other states.4
The region’s labor force participation rate increased slightly (0.1 percentage point) overall from July 2024 to July 2025. However, that result depended entirely on the 0.5 percentage point gain in participation in Massachusetts since July 2024, as all other New England states saw at least slight declines since that date (Exhibit 4). Therefore, the significant increases in unemployment (noted above) in Connecticut and New Hampshire can’t be explained on the basis of increased labor supply (participation) and instead suggest weakening labor demand over the past year. In the case of Massachusetts, however, the rise in labor participation since July 2024 may account at least partly for the increase in unemployment from that same date, suggesting less or no deterioration in labor demand.5 Indeed, Massachusetts is the only state in the region to show a stable employment-to-population ratio in July compared with one year earlier. For New England overall, the employment-to-population ratio declined 0.4 percentage point in July 2025 from the previous year, and the same statement applies to the United States. The region continues to show a higher employment-to-population ratio than the United States, with Maine being the only state in the region with a below-average ratio.
Continued claims for unemployment insurance reflect the number of people who have been unemployed (and receiving benefits) for at least one week, whereas initial claims indicate new flows into unemployment and benefits receipt. While initial claims (not shown) actually decreased in New England and the United States in July 2025 from the previous year, continued claims rose 15 percent in the region and 4 percent in the United States for that period (Exhibit 5). The facts about initial and continued claims suggest that the stock of unemployed individuals has increased since last year, not due to increased layoffs but because fewer workers transitioned from unemployment back into employment—that is, finding a new job is taking longer, suggesting weaker hiring activity. Supporting that story, the Boston Fed’s July 2025 Beige Book reports, “Hiring proceeded cautiously in part because of ongoing policy uncertainty….” and it adds the forward-looking comment that “[a]side from one…firm that planned to ramp up hiring to satisfy a recent surge in demand, no other contacts (in any industry) expected to engage in either significant hiring or significant layoffs going forward.”6
Federal Reserve Bank of Boston
Federal Reserve Bank of Boston
Price and Wage Inflation
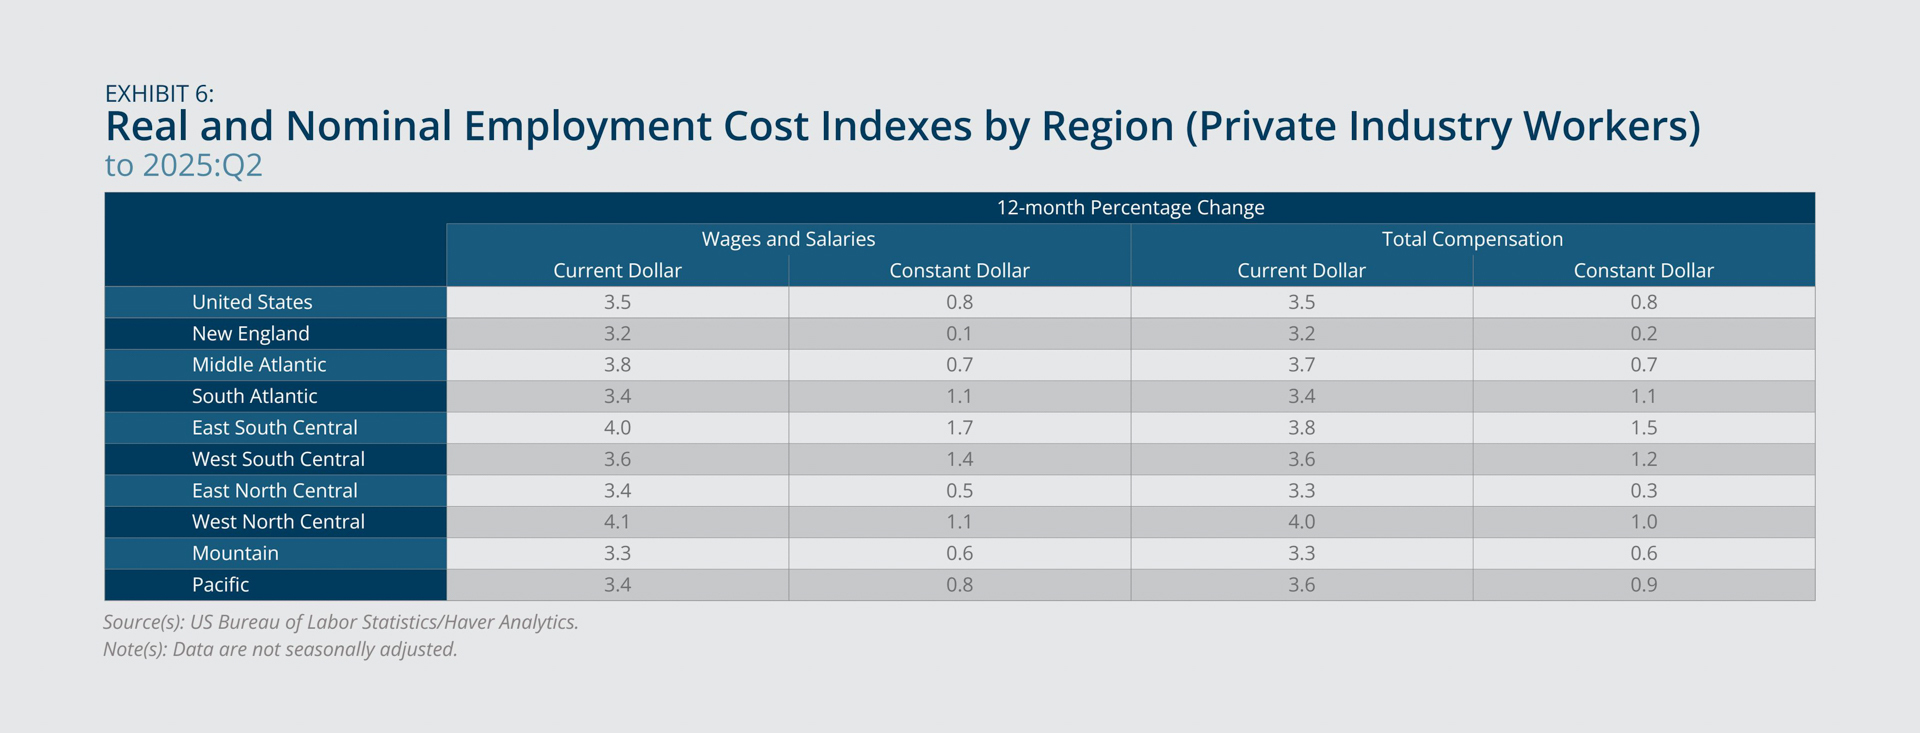
- Among the nine census divisions, New England experienced the slowest growth in real wages and salaries, as well as the slowest growth in real total compensation, in 2025:Q2 from one year earlier (Exhibit 6).
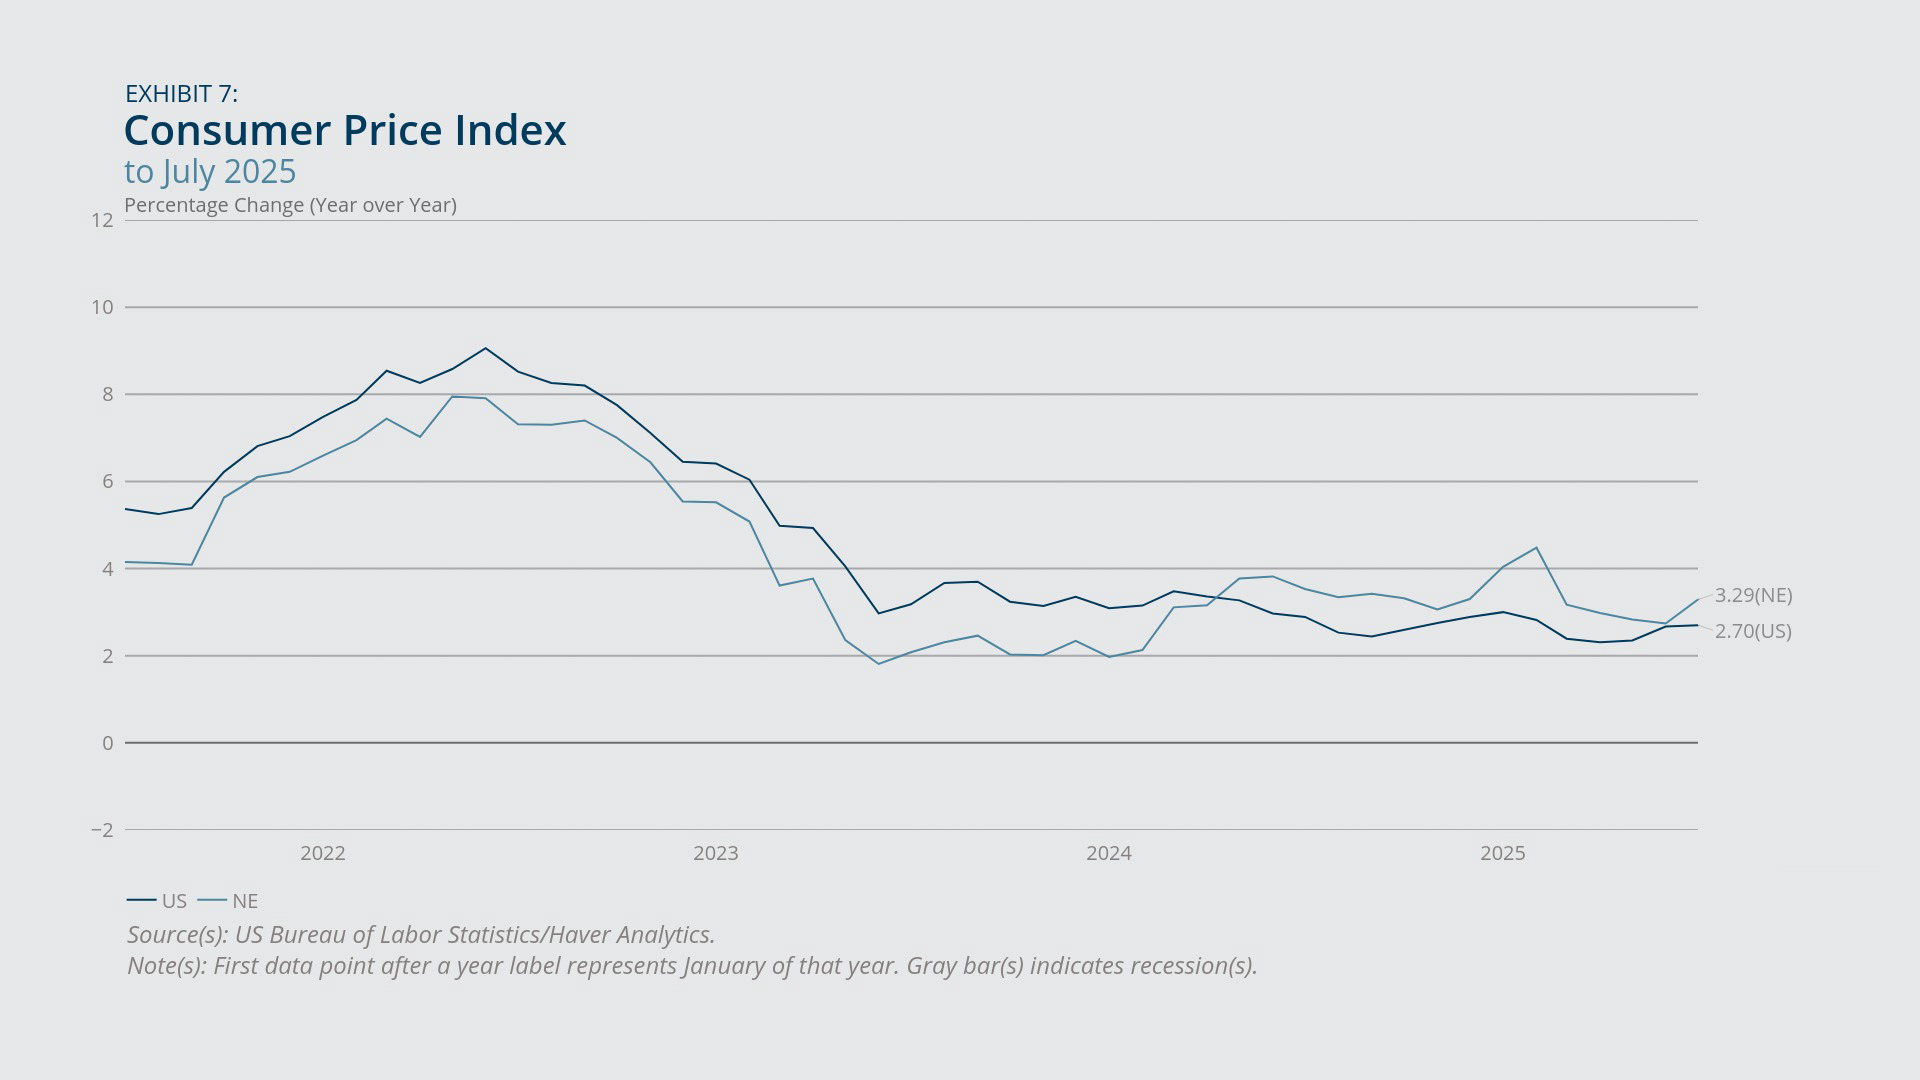
- The year-over-year rate of Consumer Price Index (CPI) inflation in New England increased in July 2025 and remained elevated in relation to the comparable US inflation rate (Exhibit 7).
New England’s real (constant dollar) wages and salaries increased just 0.1 percent in 2025:Q2 from one year earlier, and real total compensation in the region rose 0.2 percent for that same period, according to the Employment Cost Indexes for Private Industry Workers (Exhibit 6). Those were the lowest respective growth rates among the nine census divisions, and the US average rates were considerably higher, at 0.8 percent for wages and salaries and for total compensation. Nonetheless, the latest figures indicate improvements from one year earlier: In 2024:Q2 New England reported outright declines in real total compensation (and real wages and salaries) from the previous year. The region’s weak growth in real wages and salaries (or total compensation) reflects below-average nominal growth (3.2 percent in the region versus 3.5 percent nationwide) as well as above-average inflation, as the shortfall in real compensation growth relative to the United States is greater than the gap in nominal compensation.
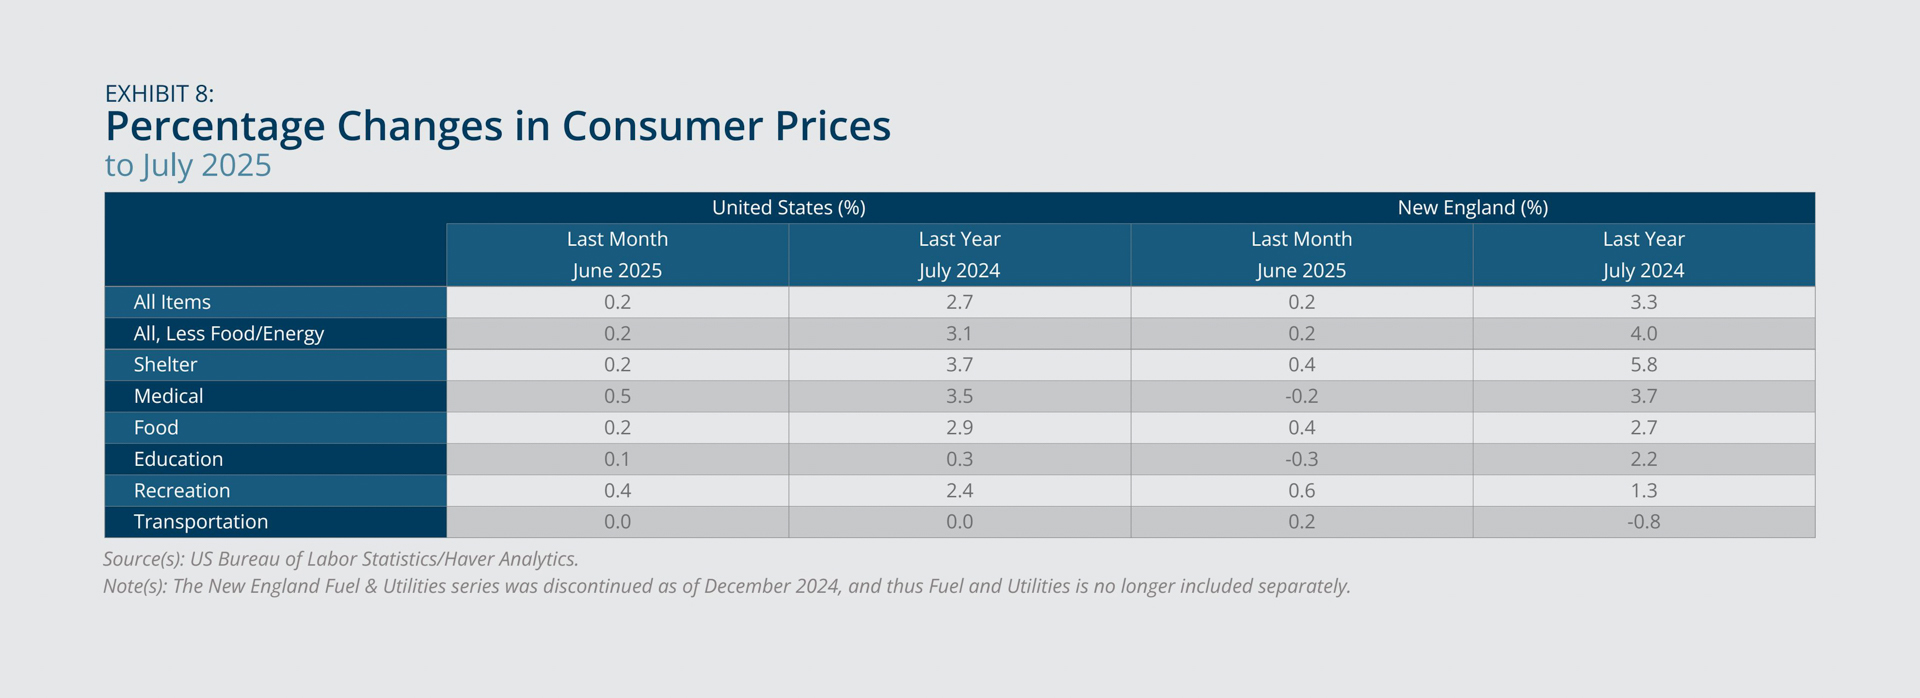
Indeed, all-items Consumer Price Index (CPI) inflation in New England rose to a 3.3 percent year-over-year rate in July 2025, up from 2.8 percent in May and outpacing the US rate of 2.7 percent for July (Exhibit 7). The recent increase in New England’s inflation rate follows four months of declines, whereas the US inflation rate edged up slightly in each of the past three months. The gap between core inflation (all items less food and energy) in New England and the United States was even greater, with core inflation at 4.0 percent in the region and 3.1 percent in the United States in July. Excess inflation in New England was driven by above-average increases (from the previous year) in the prices of shelter and education (Exhibit 8). (The education price index includes prices of communication goods and services in addition to education goods and services.) One possibly encouraging sign is that, considering just the changes in July from the previous month, New England’s education price index showed a decline (–0.3 percent), whereas US education prices rose 0.3 percent. The caveat is that the data are not seasonally adjusted, and the education component tends to moderate in the summer and then surge in September. The spike in September 2024 in New England’s education price index was especially pronounced compared with previous Septembers (since 2018), offering the possibility that the upcoming seasonal increase in September 2025 could be more moderate.
Federal Reserve Bank of Boston
Federal Reserve Bank of Boston
Federal Reserve Bank of Boston
House Prices
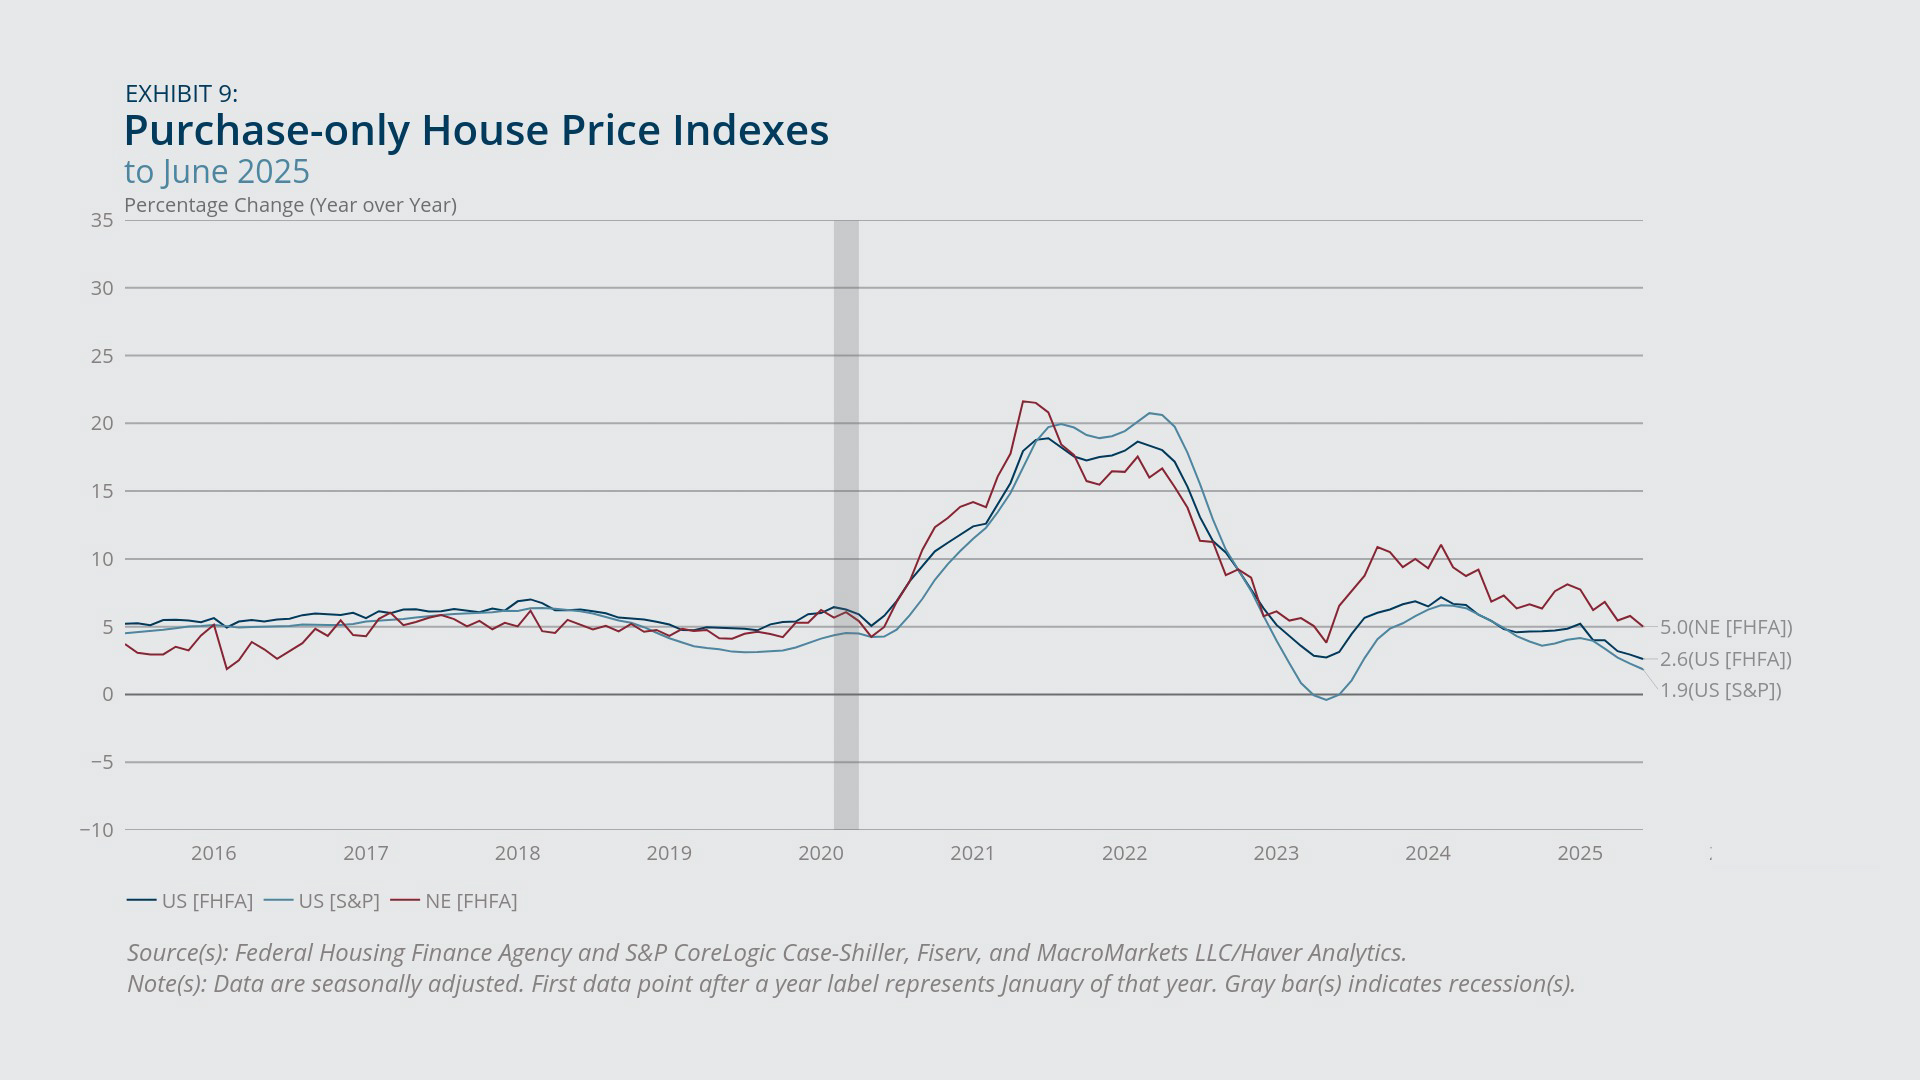
- According to the Federal Housing Finance Agency’s (FHFA) purchase-only house price indexes (HPI), house prices in New England continued to rise at an above-average pace compared with US house prices, although the June figure for the region was the lowest in more than two years (Exhibit 9).
- As of 2025:Q2, among the nine census divisions, New England had experienced the second-highest rate of house price growth from one year earlier and the highest five-year cumulative growth rate.7
- Nonetheless, New England’s house price index actually decreased in June 2025 from the previous month (–0.8 percent), the second-largest decrease among the nine census divisions. The US house price index edged down (–0.2 percent) in the same month.8
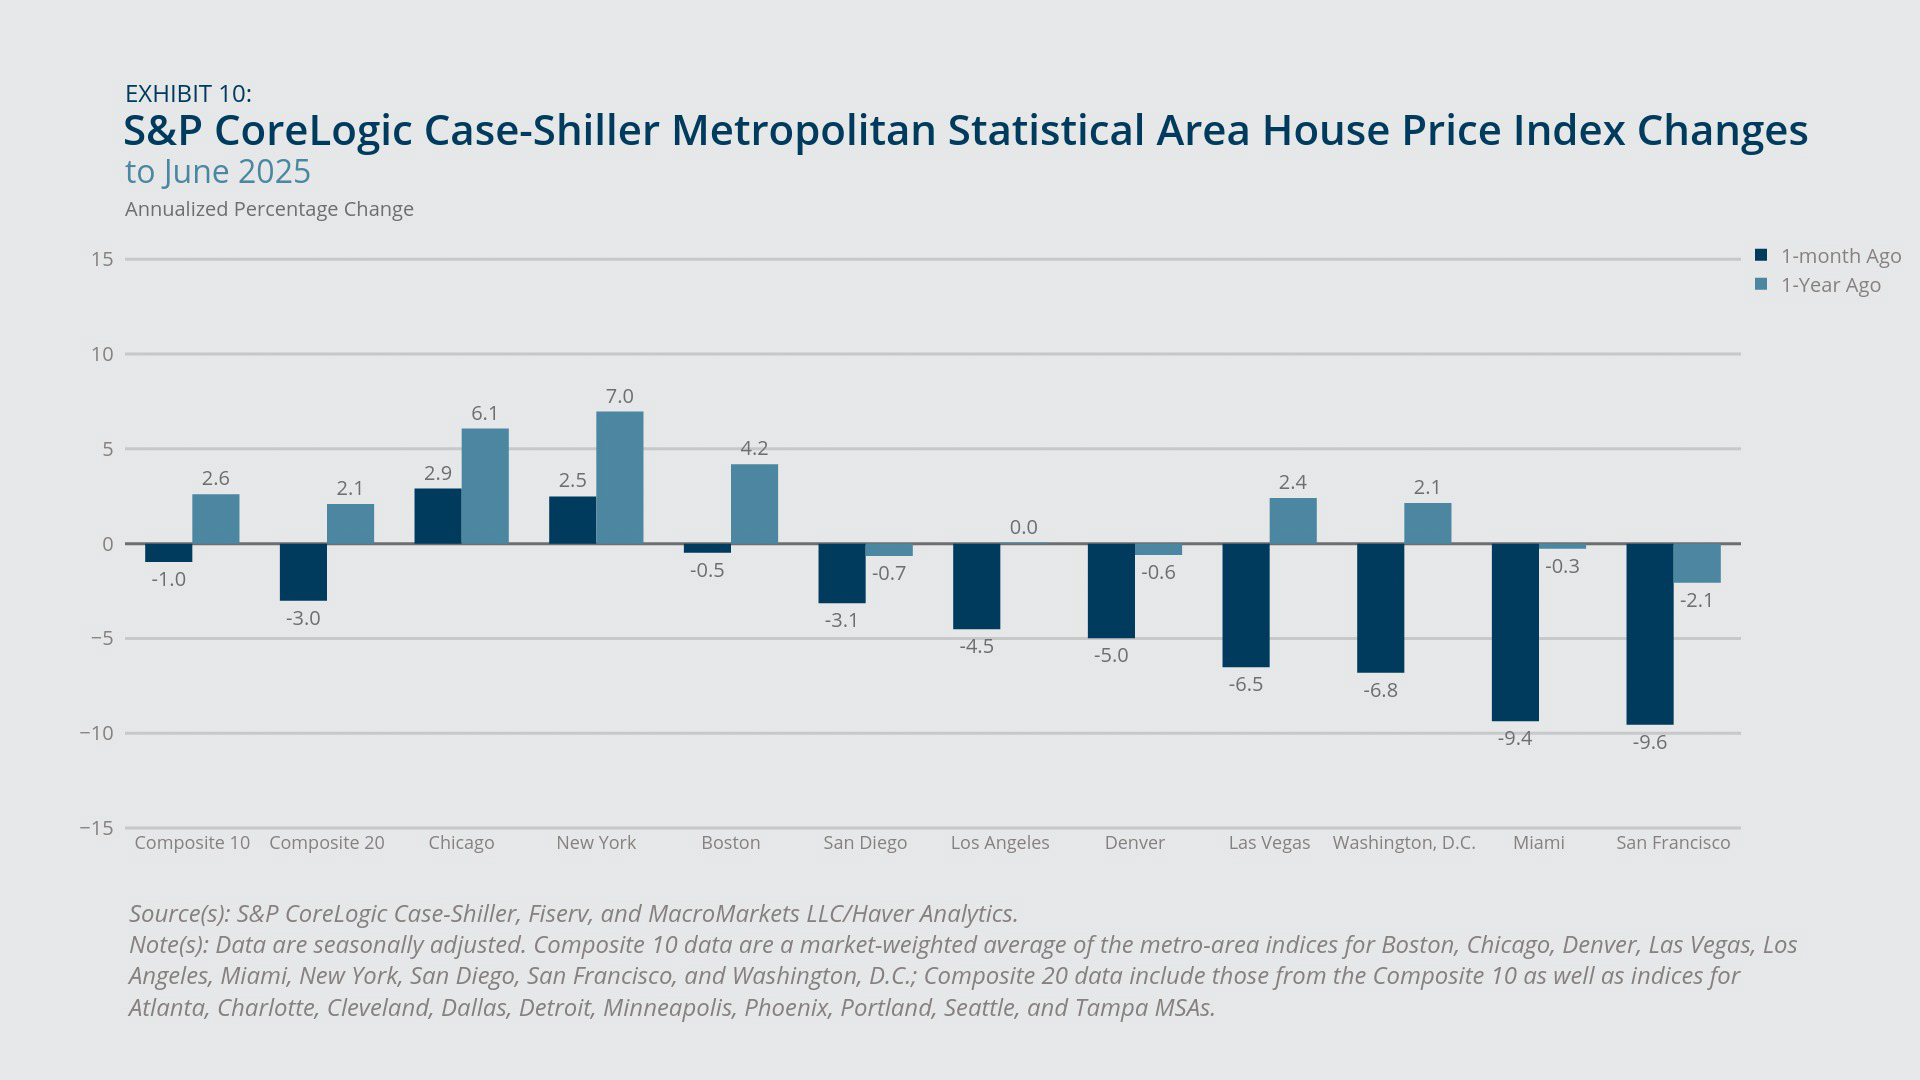
- House prices also declined in the Boston metro area in June (from May), according to the S&P CoreLogic Case-Shiller index. The (annualized) rate of decline in Boston was mild, whereas some major cities (such as Miami and San Francisco) saw steep declines (Exhibit 10).
In the latest data from the Federal Housing Finance Agency (FHFA), house price growth in New England continued to run at an above-average (year-over-year) rate relative to the United States but nonetheless showed signs of moderation. In June, New England’s house price index rose 5 percent from one year earlier, whereas the FHFA index for the United States increased just 2.6 percent for the same period, and the S&P CoreLogic Case-Shiller index for the United States rose at a 1.9 percent pace. All of those rates are down considerably compared with early 2024, and for New England, the rate is the lowest since May 2023. In fact, house prices declined in June from just the previous month on a seasonally adjusted basis, both nationally and in New England and five other census divisions. New England’s –0.8 percent over-the-month change in June was the second-lowest value among the nine census divisions.9
House price indexes for individual metro areas (Exhibit 10) show further signs of a recent downturn, based on the annualized rates of change in June from the previous month (seasonally adjusted). In the Boston metro area, house prices edged down somewhat (–0.5 percent) in June (from May), while San Francisco and Miami saw steep declines (–9.4 percent and –9.6 percent, respectively). Boston’s figure was also milder than the one-month decline (–1 percent) in the Composite 10 index, which represents a market-weighted average of the indexes for Boston and nine other cities (Chicago, Denver, Las Vegas, Los Angeles, Miami, New York, San Diego, San Francisco, and Washington, DC). According to those same indexes, Boston’s house prices increased 4.2 percent from one year earlier, outpacing the gain in the Composite 10 index, which rose 2.6 percent from a year earlier. San Diego, Denver, Miami, and San Francisco all experienced at least slight declines in house prices from one year earlier, with San Francisco (–2.1 percent) posting the sharpest decline. A variety of factors have been cited to explain declining house prices in certain parts of the country, such as a post-pandemic correction to overinflated prices, elevated mortgage interest rates, and recent increases in housing supply, which have been more pronounced in the South and West than in the Northeast.10
Federal Reserve Bank of Boston
Federal Reserve Bank of Boston
Forward-looking Indicators
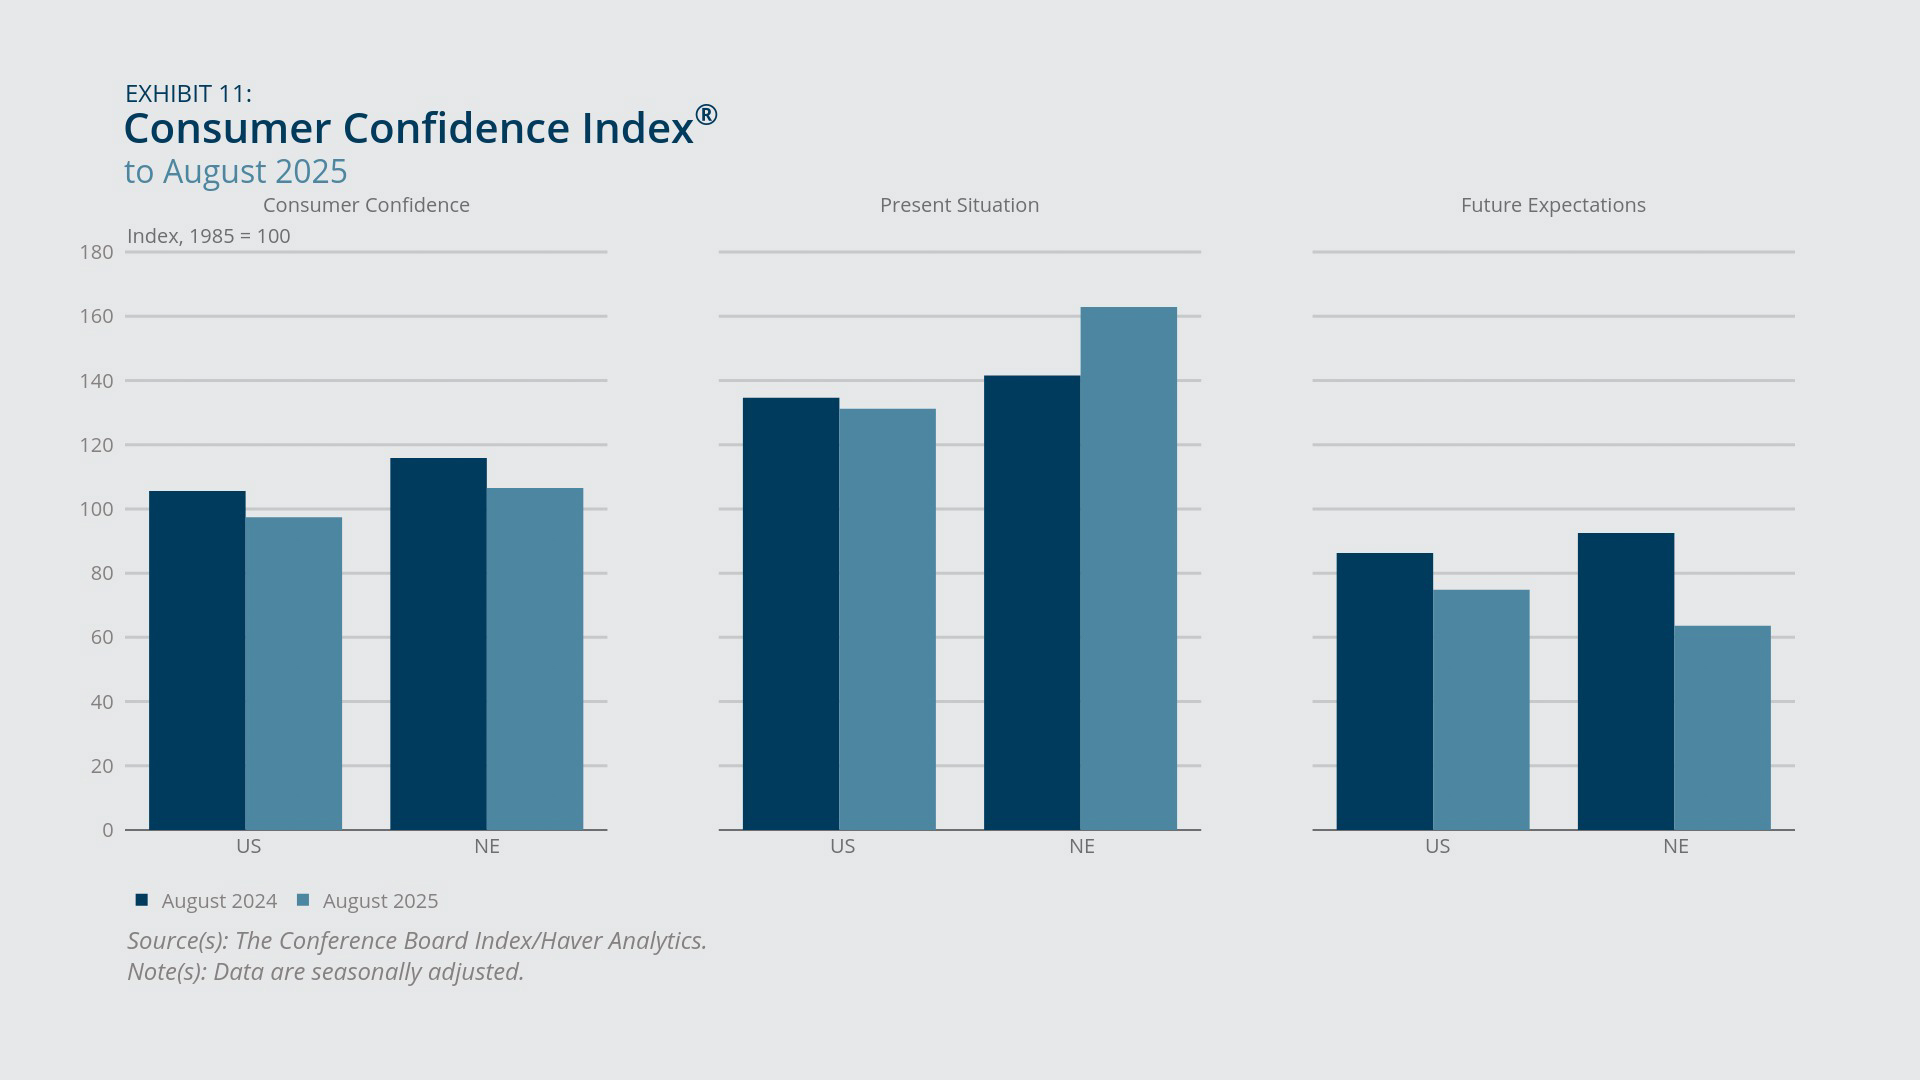
- The Consumer Confidence Index for New England decreased 8 percent in August from one year earlier, while the corresponding index for the United States declined by a similar margin (Exhibit 11). New England’s August reading nonetheless remained in optimistic territory, while the US reading was slightly pessimistic.
- The overall year-over-year decline in the Consumer Confidence Index for New England occurred despite an increase in the present situation component, as the future expectations component showed a sharp drop in August from one year earlier (Exhibit 11).
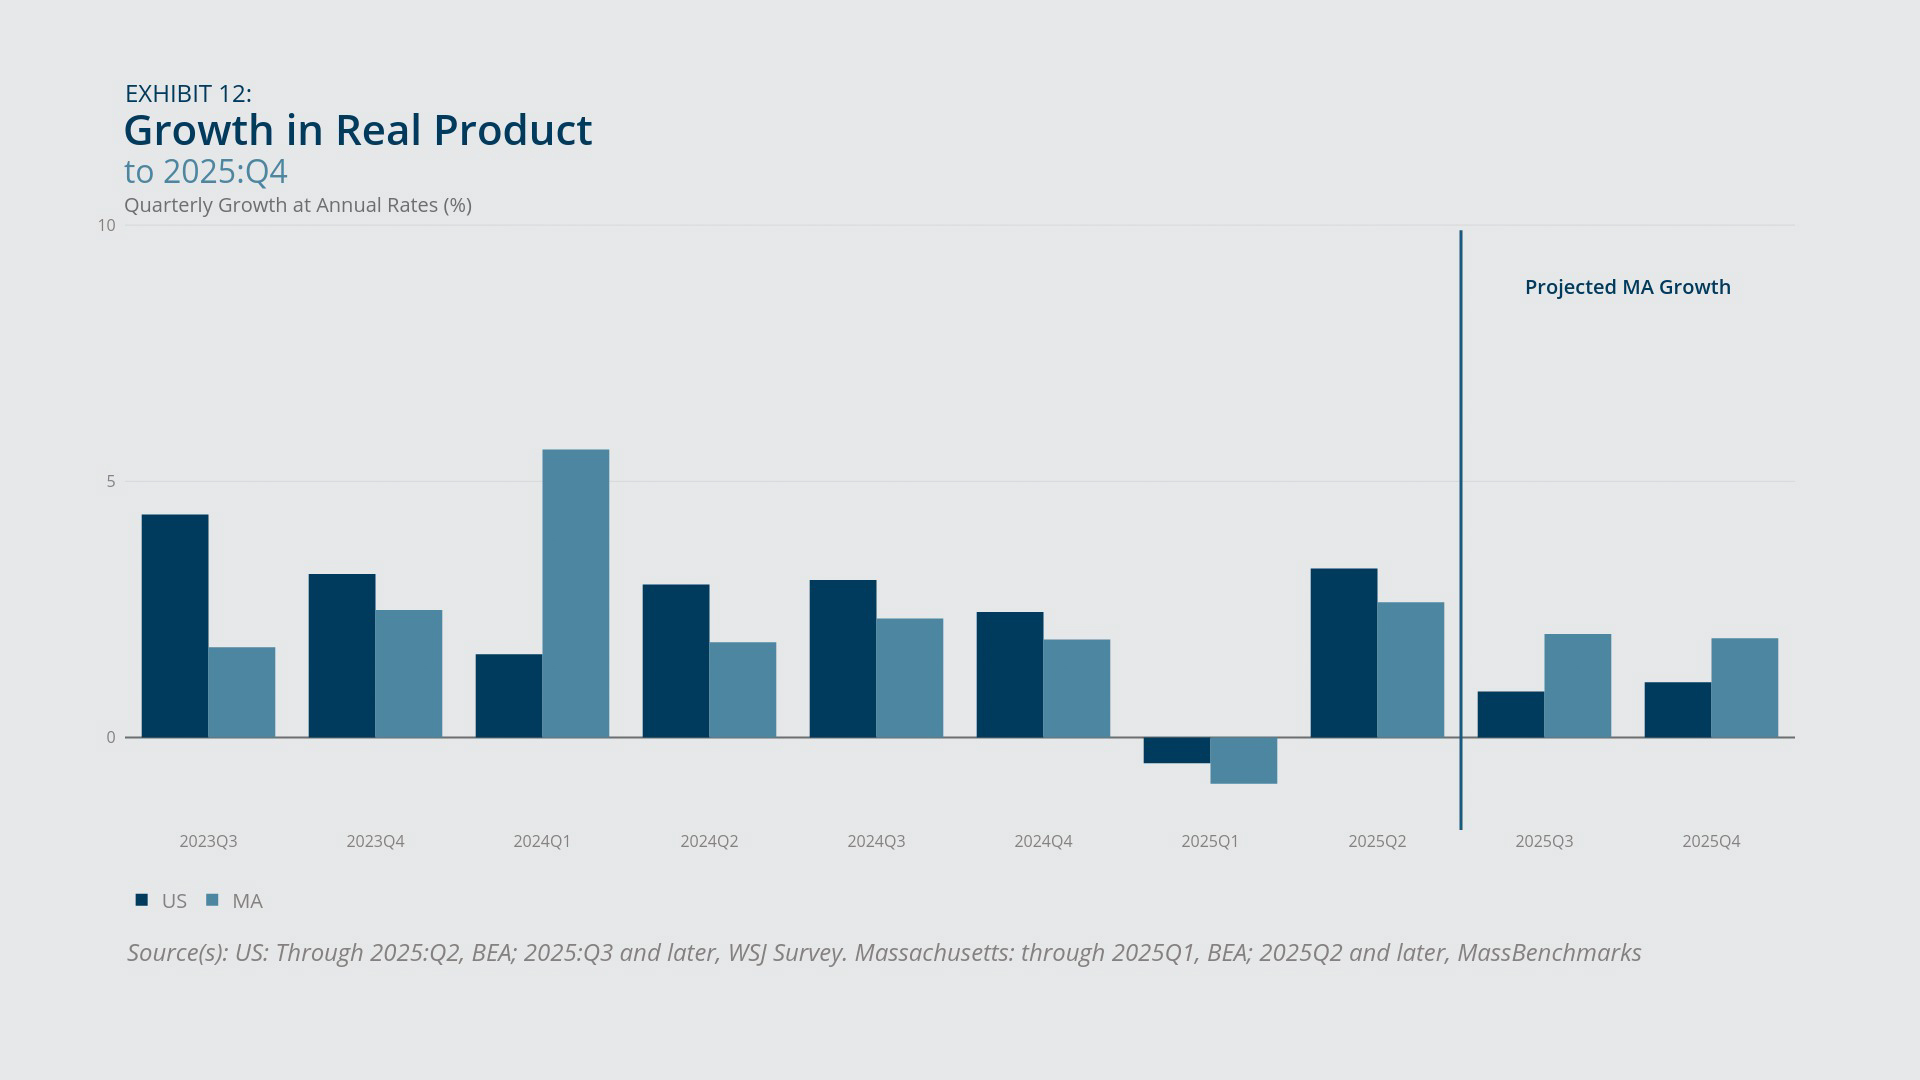
- According to projections by MassBenchmarks, the Massachusetts economy is expected to grow at a roughly 2 percent annual pace on average in the third and fourth quarters of 2025, following 2.6 percent growth observed in the second quarter and a moderate contraction in the first quarter (Exhibit 12).
The Conference Board’s Consumer Confidence Index for New England was down in August 2025 from one year earlier by slightly more than 8 percent, but it stayed above 100, a benchmark used to distinguish optimistic sentiment (over 100) from pessimistic sentiment (below 100). Although not shown, August’s reading represents an improvement from the preceding month, when the index dipped below 100. The overall decline in the index masks the fact that confidence in the present situation improved in August from one year earlier, whereas future expectations weakened considerably (Exhibit 11). For the United States overall, consumer confidence landed slightly below 100 in August, down nearly 8 percent from the previous August. Confidence in both the present situation and future expectations were down from a year earlier, although the decline in the present situation component was minimal.
The Massachusetts and national economies rebounded in the second quarter of 2025 after modest contraction in the first quarter that was driven by the rush to accumulate inventories of imported goods in advance of tariff hikes. According to MassBenchmarks, gross state product in Massachusetts expanded at a 2.6 percent annual rate in 2025:Q2 (seasonally adjusted), somewhat below the 3.3 percent GDP growth rate in the United States for the same quarter estimated by the US Bureau of Economic Analysis. According to the press release from MassBenchmarks, “The anxiety and uncertainty of the business community and households in the first quarter diminished during the second quarter as the Trump administration softened its tariff stance…and the consumer has been spared the worst of the feared tariff hikes on prices – at least for now.”11
Based on MassBenchmarks’ Leading Economic Index for Massachusetts, the state’s economy is expected to grow at a 2.0 percent annual rate (seasonally adjusted) in the third quarter of 2025 and at a 1.9 percent annual rate in the fourth quarter (Exhibit 12), exceeding forecasts for US GDP growth (based on the Wall Street Journal’s survey of economists in July) for those same quarters.12
Federal Reserve Bank of Boston
Federal Reserve Bank of Boston
Endnotes
- See “State Employment and Unemployment Summary,” US Bureau of Labor Statistics Economic News Release, August 19, 2025.
- See Doug Most, “Boston University Announces Budget Cuts, Layoffs Amid Financial Pressures,” BU Today, July 7, 2025.
- See Jonathan Shaw, “Harvard Layoffs Continue, with More to Come,” Harvard Magazine, July 11, 2025.
- See “State Employment and Unemployment Summary,” US Bureau of Labor Statistics Economic News Release, August 19, 2025.
- Anecdotal evidence points to strains on labor force participation associated with recent immigration crackdowns. See, for example, Sarah Betancourt, “Immigration Policy Shifts Are Already Costing Health Workers Their Jobs in Massachusetts,” WGBH, July 23, 2025.
- See Beige Book – July 2025, Board of Governors of the Federal Reserve System.
- See FHFA House Price Index (HPI) Quarterly Report, 2025Q2 and June 2025, Federal Housing Finance Agency, August 26, 2025.
- See FHFA House Price Index (HPI) Quarterly Report, 2025Q2 and June 2025, Federal Housing Finance Agency, August 26, 2025.
- See FHFA House Price Index (HPI) Quarterly Report, 2025Q2 and June 2025, Federal Housing Finance Agency, August 26, 2025.
- See, for example, Marianne Garvey, “Rising Inventory and Steep Price Cuts in South and West US Metros as Sellers Grow Desperate to Offload Homes,” Daily Mail, August 13, 2025.
- See “Current and Leading Indexes,” MassBenchmarks, August 2025.
- The MassBenchmarks forecasts for Massachusetts economic growth are based on the Leading Economic Index for Massachusetts, which combines data on nonagricultural employment, withholding taxes, sales taxes, and the unemployment rate, all pertaining solely to Massachusetts. See “Current and Leading Indexes,” MassBenchmarks, August 2025.

 About the Authors
Mary A. Burke,
Federal Reserve Bank of Boston
Mary A. Burke is a principal economist and policy advisor with the New England Public Policy Center in the Federal Reserve Bank of Boston Research Department.
Email: Mary.Burke@bos.frb.org
Alejandra Guadarrama-Mojica,
Federal Reserve Bank of Boston
Alejandra Guadarrama-Mojica is a senior research associate in the Federal Reserve Bank of Boston Research Department.
Acknowledgments
Kelly Jackson, a senior data analyst in the Federal Reserve Bank of Boston Research Department, prepared the exhibits for this memo.
Resources
Keywords
- Regional economy ,
- Economic Conditions ,
- New England ,
- NEPPC