Q4 2016: Snapshot of the New England Economy through December 19, 2016 


Economic activity continued to improve throughout 2016
In late 2016, New England and the United States continued to see improvements in economic indicators. Employment increased, home prices rose, and unemployment rates fell. Growth in consumer prices was modest in the region due in part to decreased Transportation and Medical Care costs. Despite a small decrease in exports nationally from Q3 2015 to Q3 2016, the New England region experienced a moderate increase in exports year-over-year.
Employment
Employment gains persist in 2016
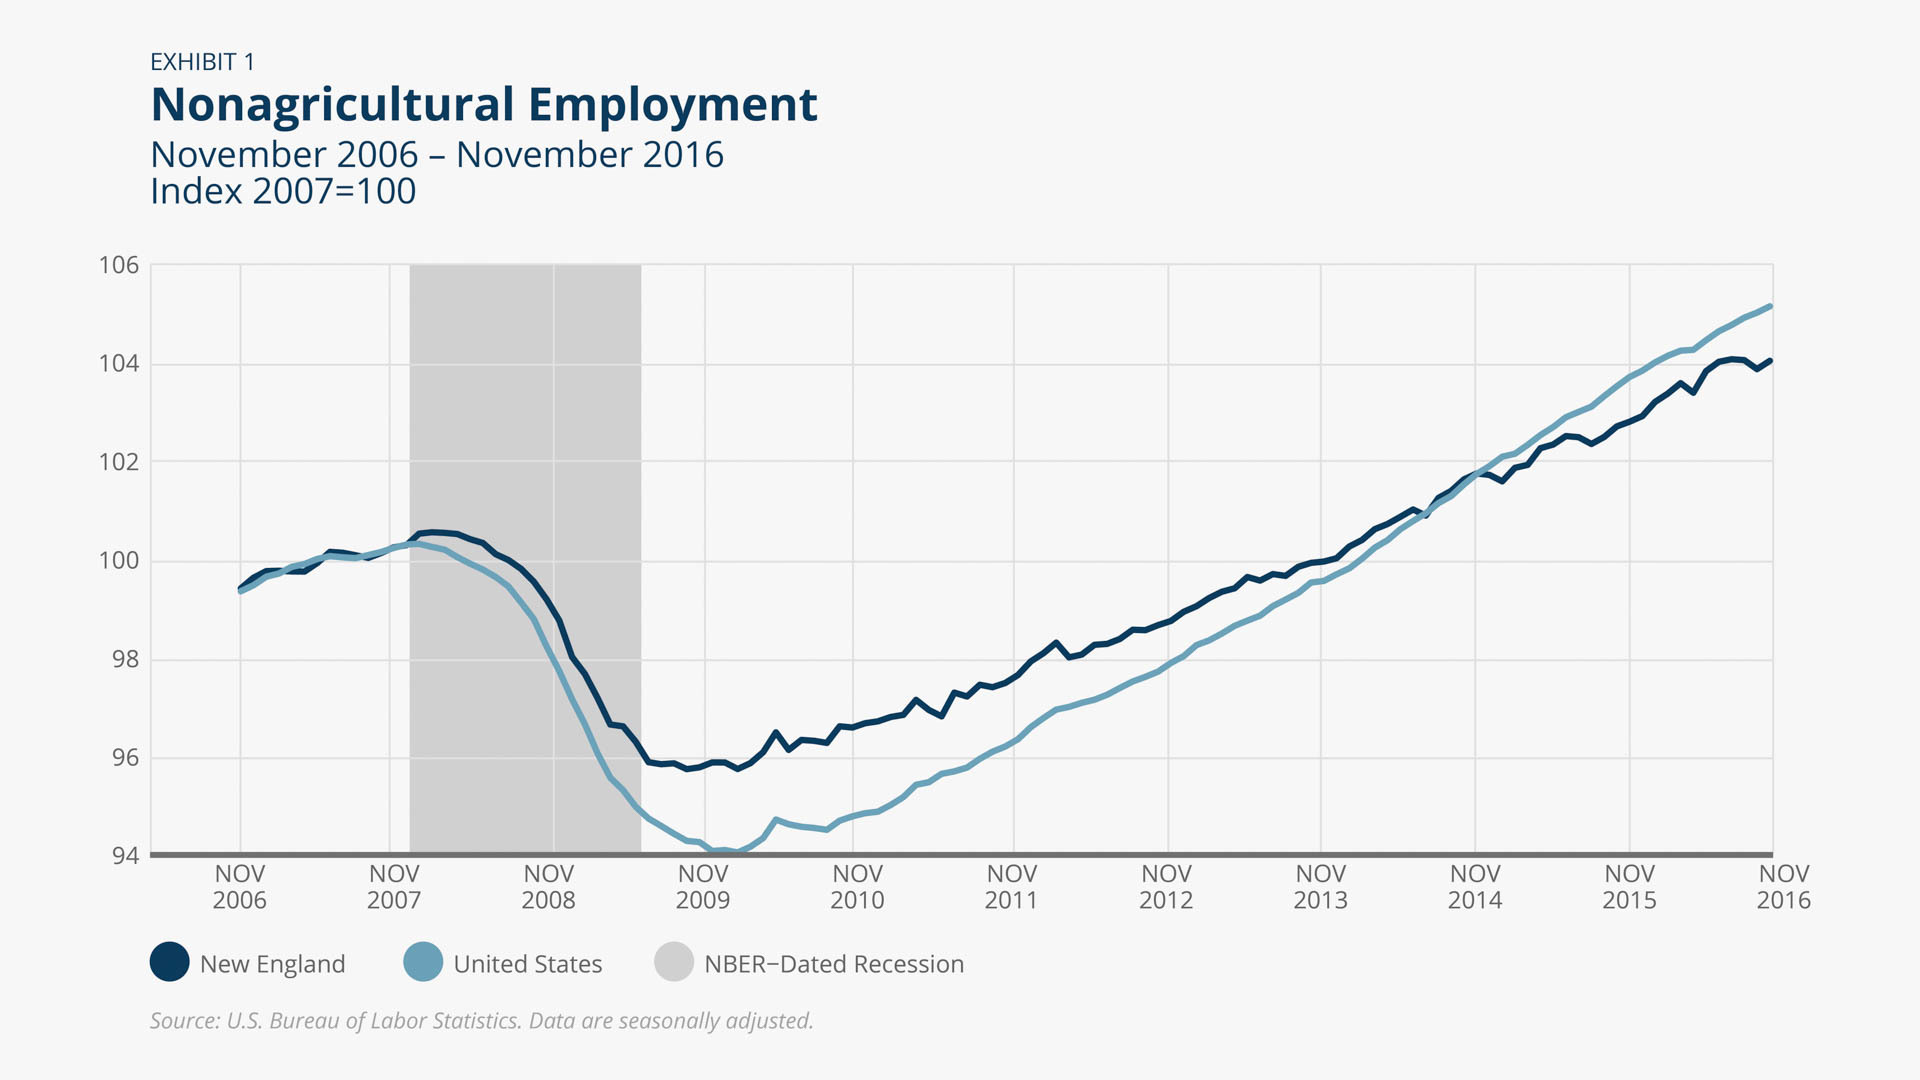
The United States and New England continued to post consistent job gains in 2016. Between November 2015 and November 2016, payroll employment grew by 1.6 percent nationally and 1.3 percent regionally (Exhibit 1). Although employment in each New England state increased since November 2015, there was a wide range of rates of job growth across the region. Within New England, New Hampshire posted the strongest year-over-year job gains, increasing employment by 2.2 percent from November 2015 to November 2016. Over this period, New Hampshire and Massachusetts were the only New England states to exceed the national pace of job growth. Vermont posted the slowest employment growth in the region, increasing payroll jobs just 0.1 percent over this time period.

Peter Davis/Federal Reserve Bank of Boston
Unemployment
Unemployment rates declined in all New England states
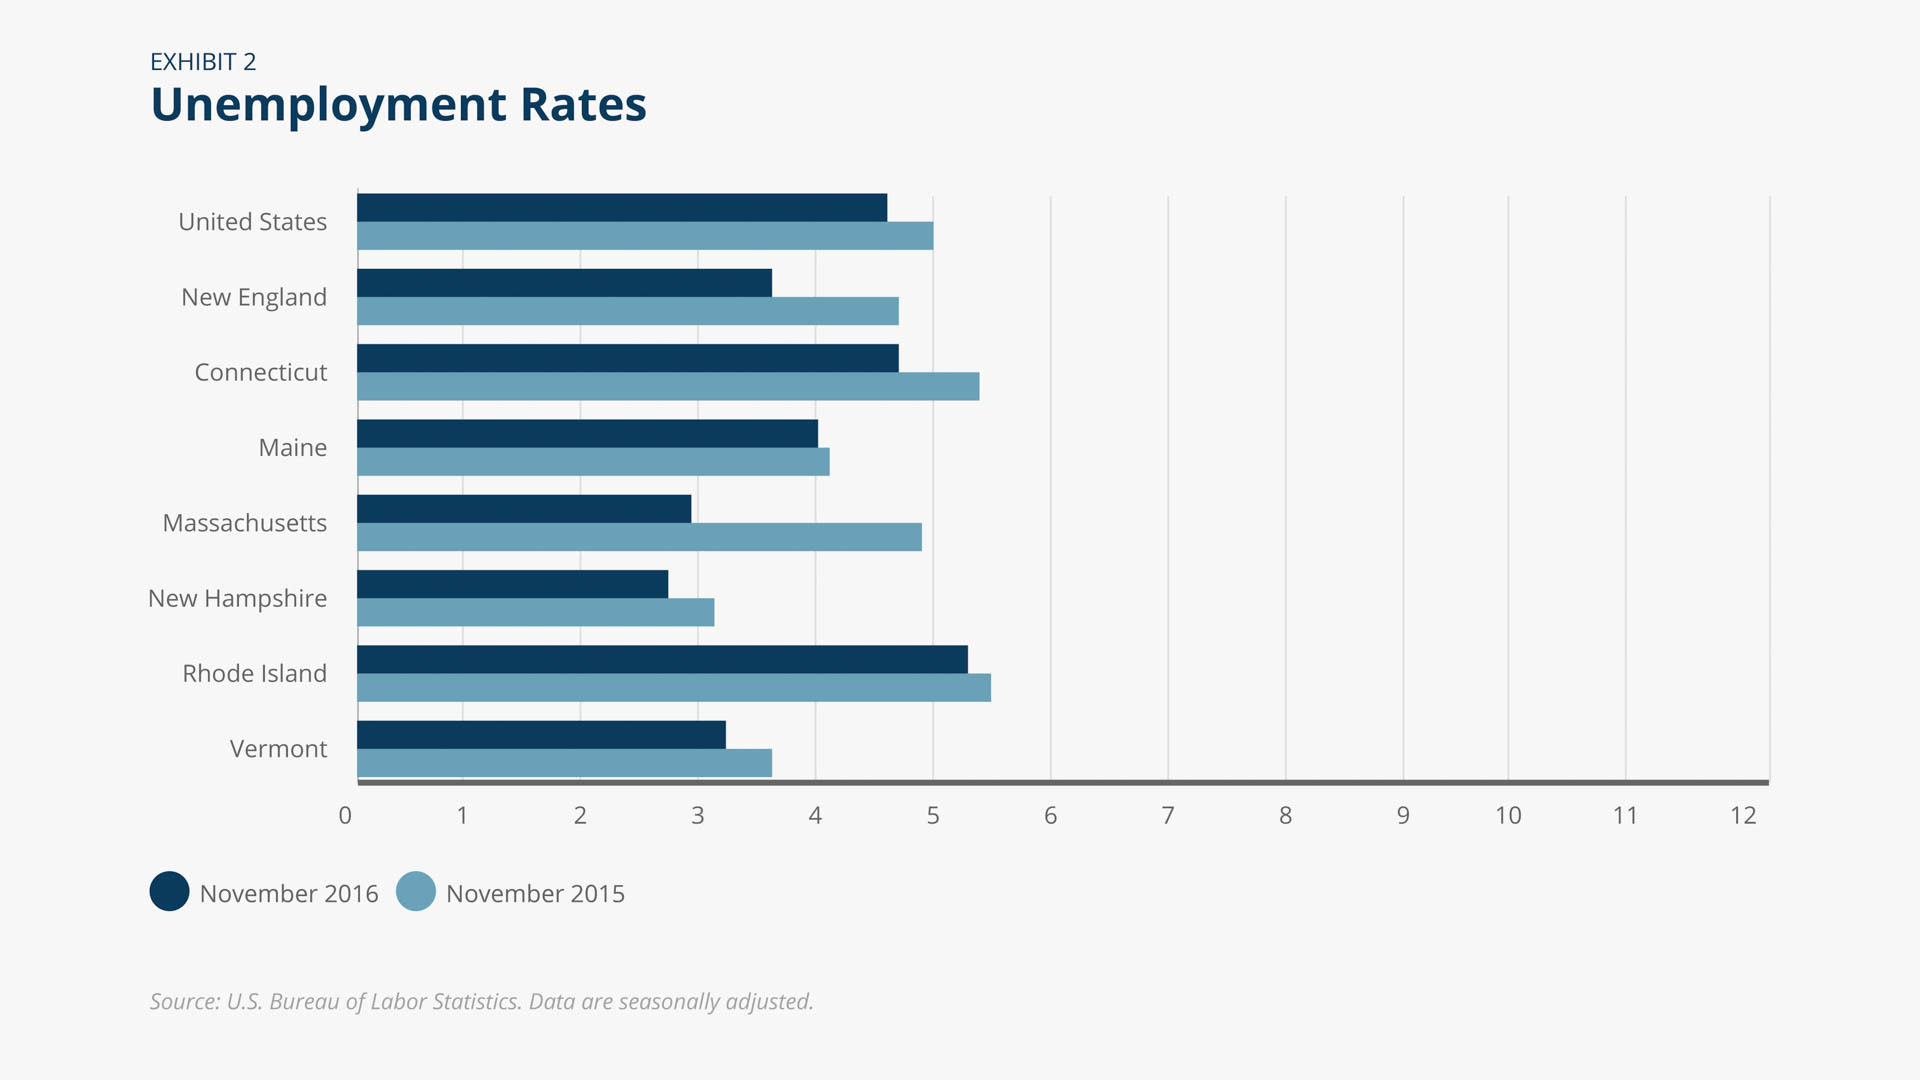
All six of the New England states continued to see unemployment rates decline between November 2015 and November 2016 (Exhibit 2). Over this period, the region’s unemployment rate dropped 1.1 percentage points to 3.6 percent. Massachusetts experienced the steepest unemployment rate decline in New England (2.0 percentage points), resulting in a 2.9 percent rate. However, New Hampshire retained the lowest unemployment rate in the region (2.7 percent). Despite a 0.2 percentage point drop in its unemployment rate since November 2015, Rhode Island once again recorded the highest unemployment rate in the region (5.3 percent) after briefly being replaced by Connecticut. At 4.7 percent, Connecticut posted the second-highest unemployment rate in New England following a year-over-year decline of 0.7 percentage points.
Peter Davis/Federal Reserve Bank of Boston
Consumer Prices
Declining Transportation and Medical Care Costs Moderated Regional Consumer Price Growth
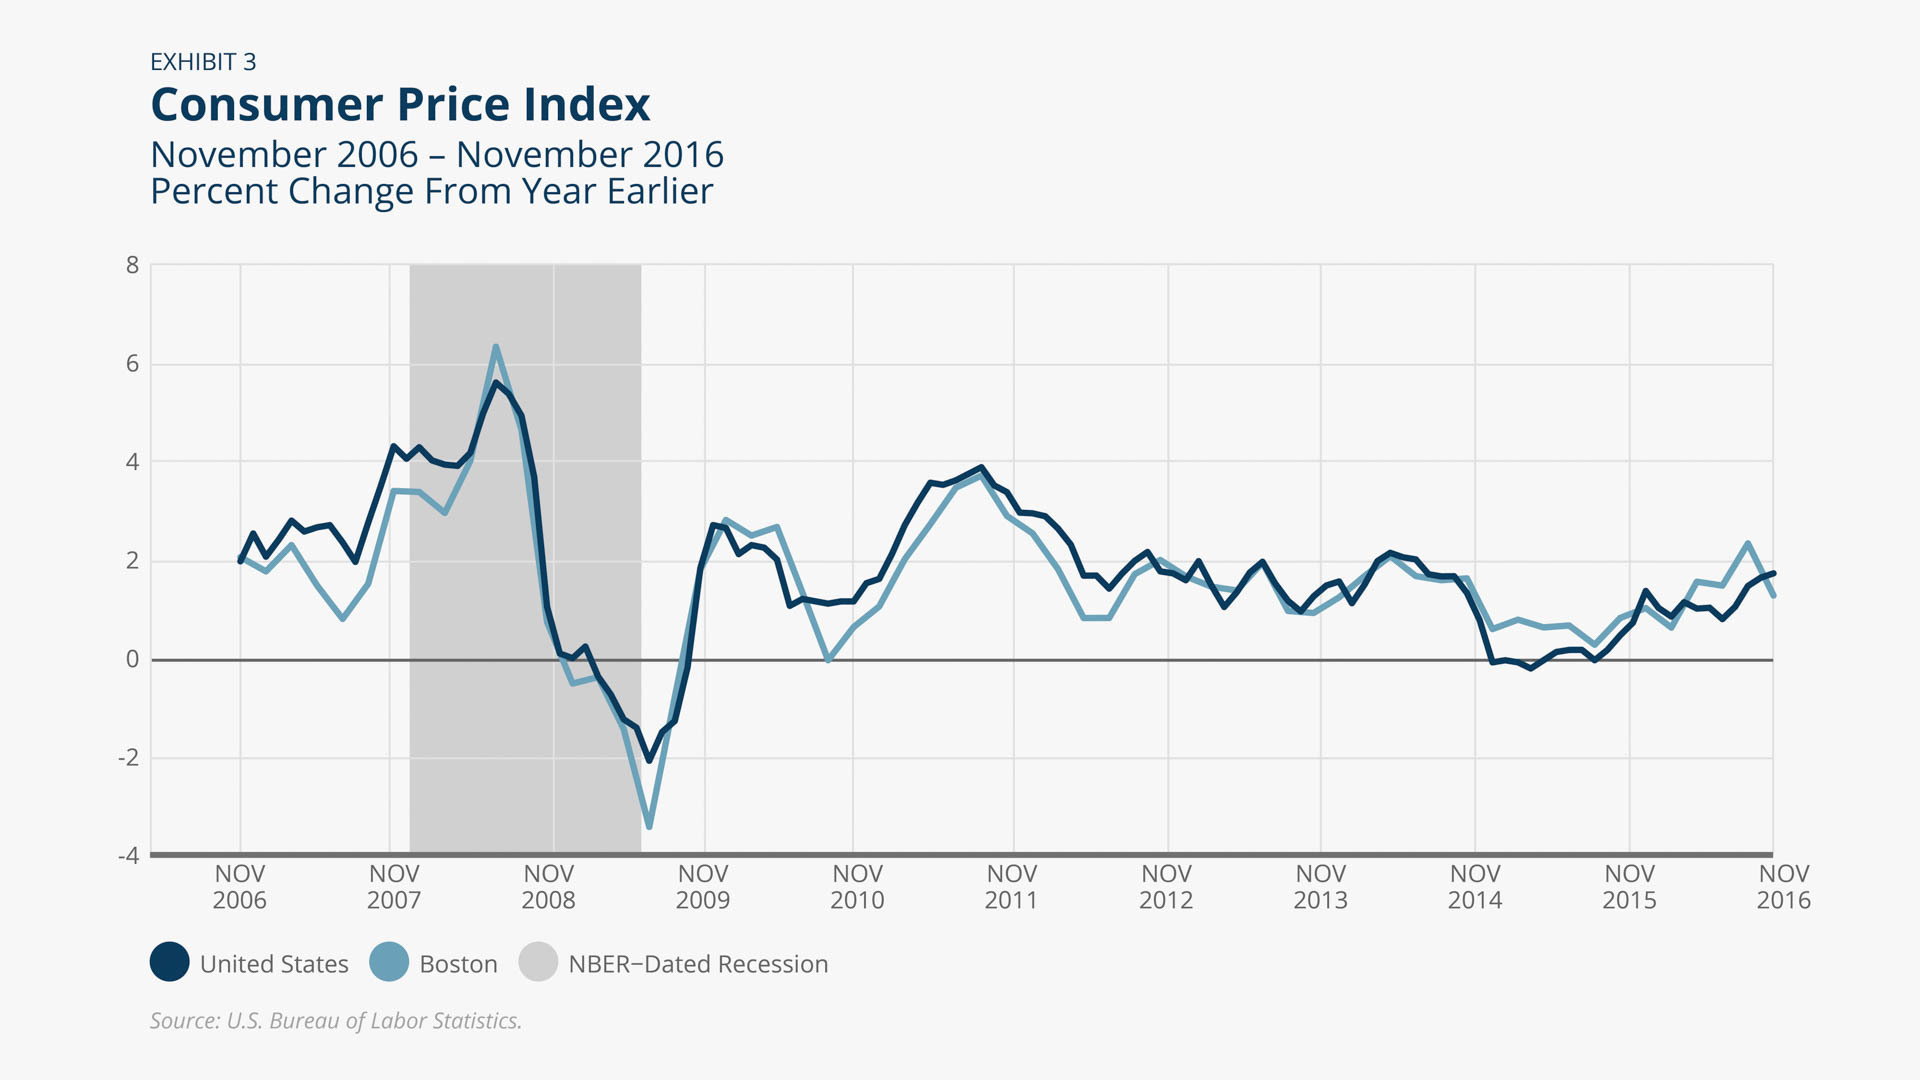
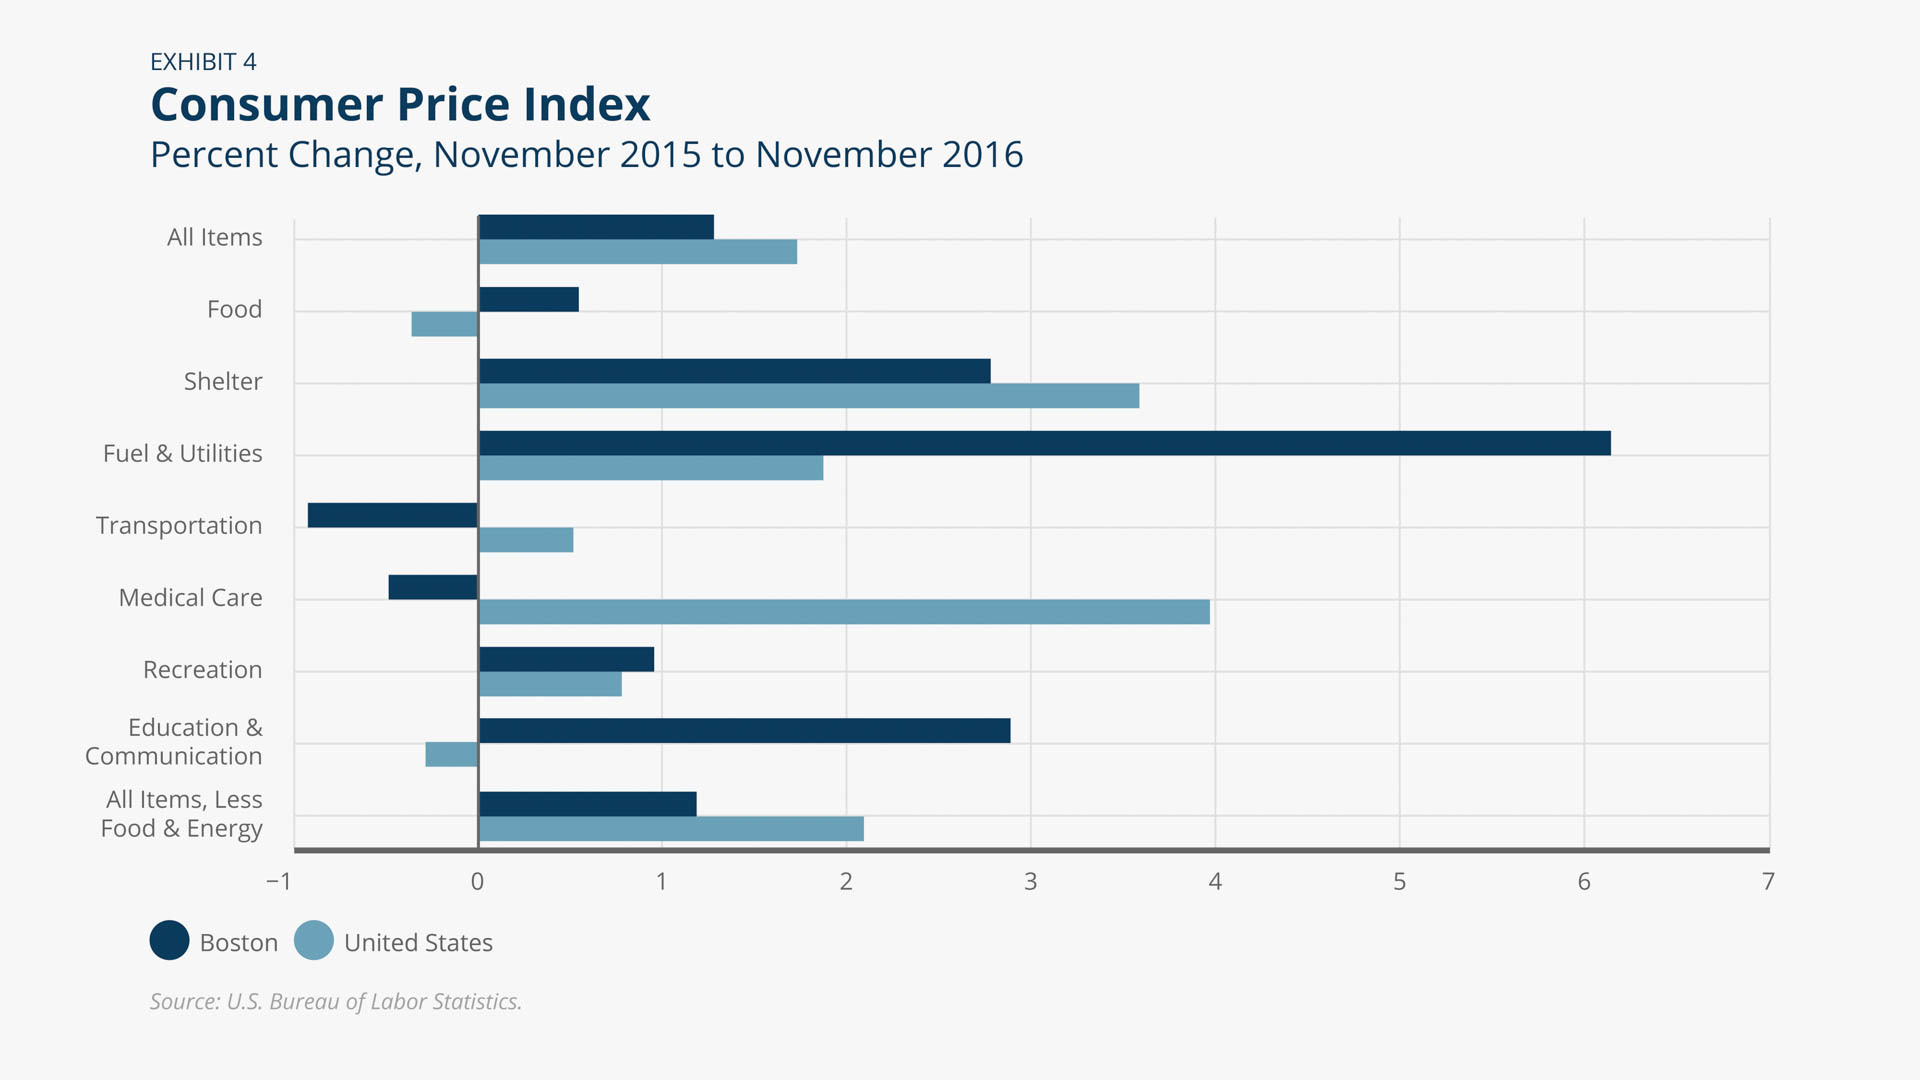
Consumer prices grew at a fairly subdued pace throughout 2016, with national price growth slightly outpacing regional increases (Exhibit 3). In the Boston area, price inflation was 1.2 percent between November 2015 and 2016. Consumer prices nationally increased 1.7 percent year-over-year. The recent price growth in the region is largely driven by a rise in Fuel & Utilities prices after months of decline in 2015 and early 2016. Exhibit 4 shows that the price growth in Fuel & Utilities in the Boston area (6.1 percent) significantly outpaced the national increase (1.8 percent). Transportation costs decreased by 0.9 percent from November 2015 to November 2016. Medical Care prices experienced the largest growth in the nation (4.0 percent), but in the Boston area, this sector actually saw a modest decrease in prices of 0.5 percent over the same period.
Peter Davis/Federal Reserve Bank of Boston
Peter Davis/Federal Reserve Bank of Boston
Home Prices
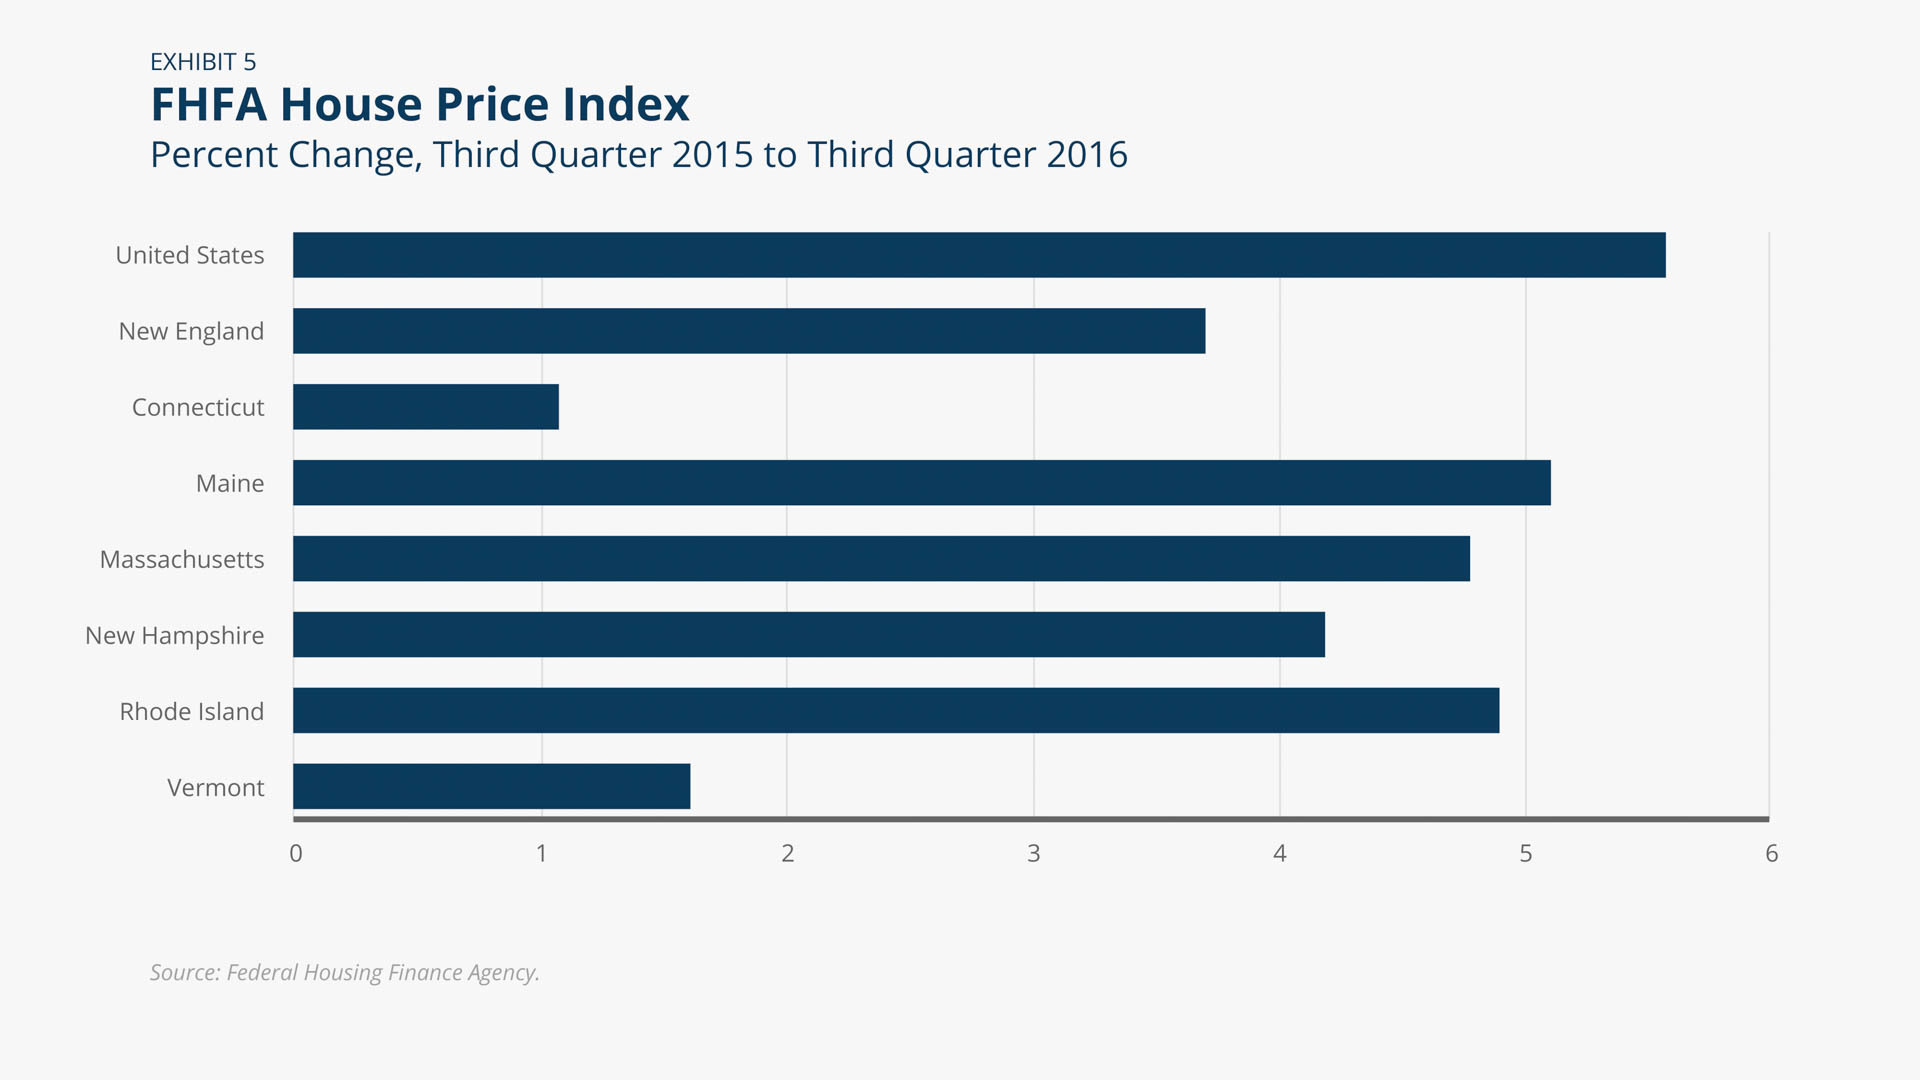
Maine records fastest house price growth in the region
Home prices continued to grow both nationally and regionally, with national growth rates continuing to exceed regional rates (Exhibit 5). Between Q3 2015 and Q3 2016, home prices increased 5.6 percent nationally and 3.7 percent regionally. All six New England states reported positive house price growth year-over-year, but these gains all trailed the national rate. Maine led regional home price gains, up 5.1 percent through Q3 2016. House price growth in Connecticut was more modest over the period considered and at 1.1 percent was the lowest in the region.
Peter Davis/Federal Reserve Bank of Boston
Exports
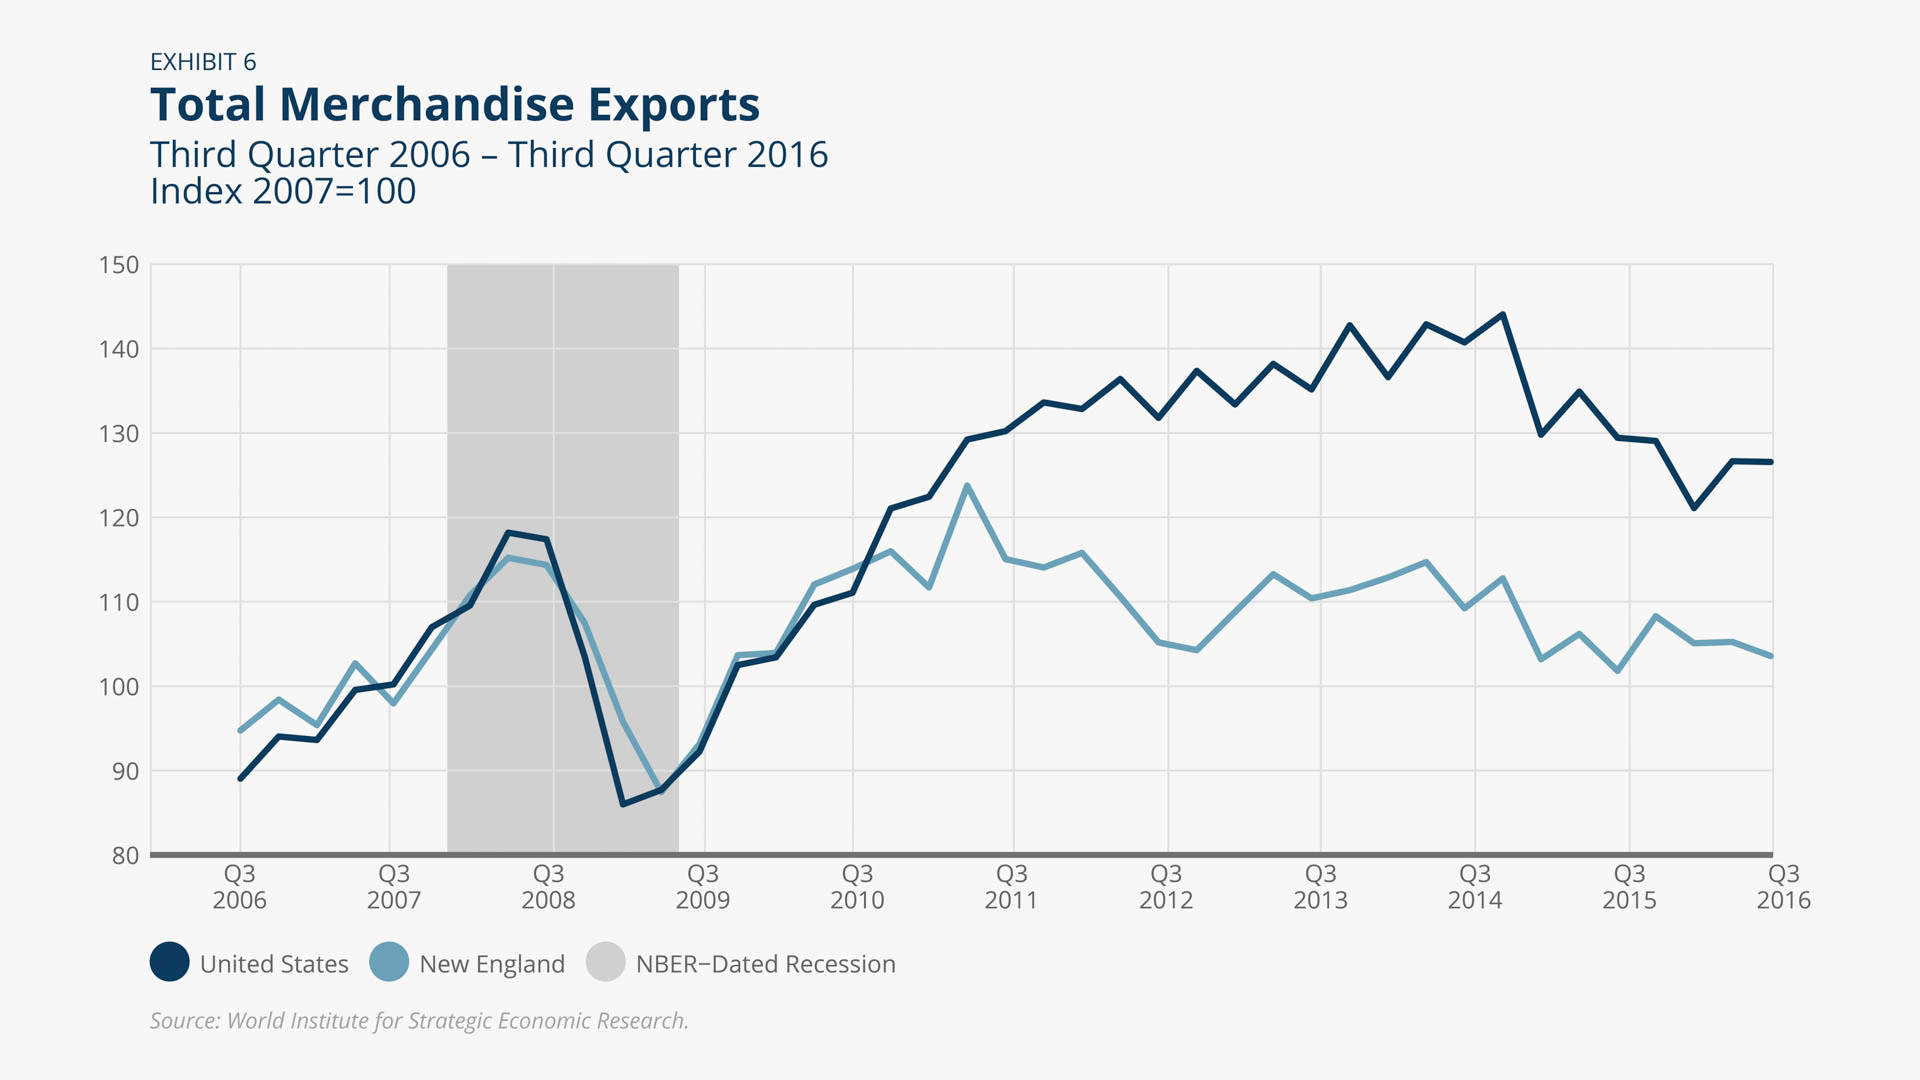
Exports are mixed throughout the New England states
The dollar value of exports from New England is up 1.7 percent year-over-year through the first three quarters of 2016. Nationally, exports are down 2.2 percent from Q3 2015 to Q3 2016 (Exhibit 6). Massachusetts (1.7 percent), New Hampshire (3.3 percent), Rhode Island (17.2 percent), and Maine (20.2 percent) experienced varying increases in the value of exports. The dollar value of exports from Vermont decreased 16.1 percent, and Connecticut experienced a more modest decrease of 0.6 percent. Exports to Canada, the largest trading partner with the New England states, increased 4.6 percent, and the dollar value of exports to Mexico, the second largest trading partner, decreased 16.1 percent. Computer & Electronic Products, the industry with the highest dollar value of exports from New England, decreased 10.3 percent from Q3 2015 to Q3 2016, and Transportation Equipment, the industry with the second-highest dollar value, increased 11.6 percent over the same period.
Peter Davis/Federal Reserve Bank of Boston

 About the Authors
Riley Sullivan,
Federal Reserve Bank of Boston
Riley Sullivan is a senior policy analyst with the New England Public Policy Center in the Federal Reserve Bank of Boston Research Department.
Email: riley.sullivan@bos.frb.org