Q2 2017: Snapshot of the New England Economy through June 19, 2017 


Economic activity continued to improve into 2017
In the first months of 2017, economic conditions continued to improve in both New England and the United States along several indicators. Payroll employment increased, home prices rose, and unemployment rates fell relative to one year prior, although the changes in economic conditions varied across the New England states. Over this period, consumer prices rose moderately in the Boston area as well as nationally.
Payroll Employment
Employment gains in 2017
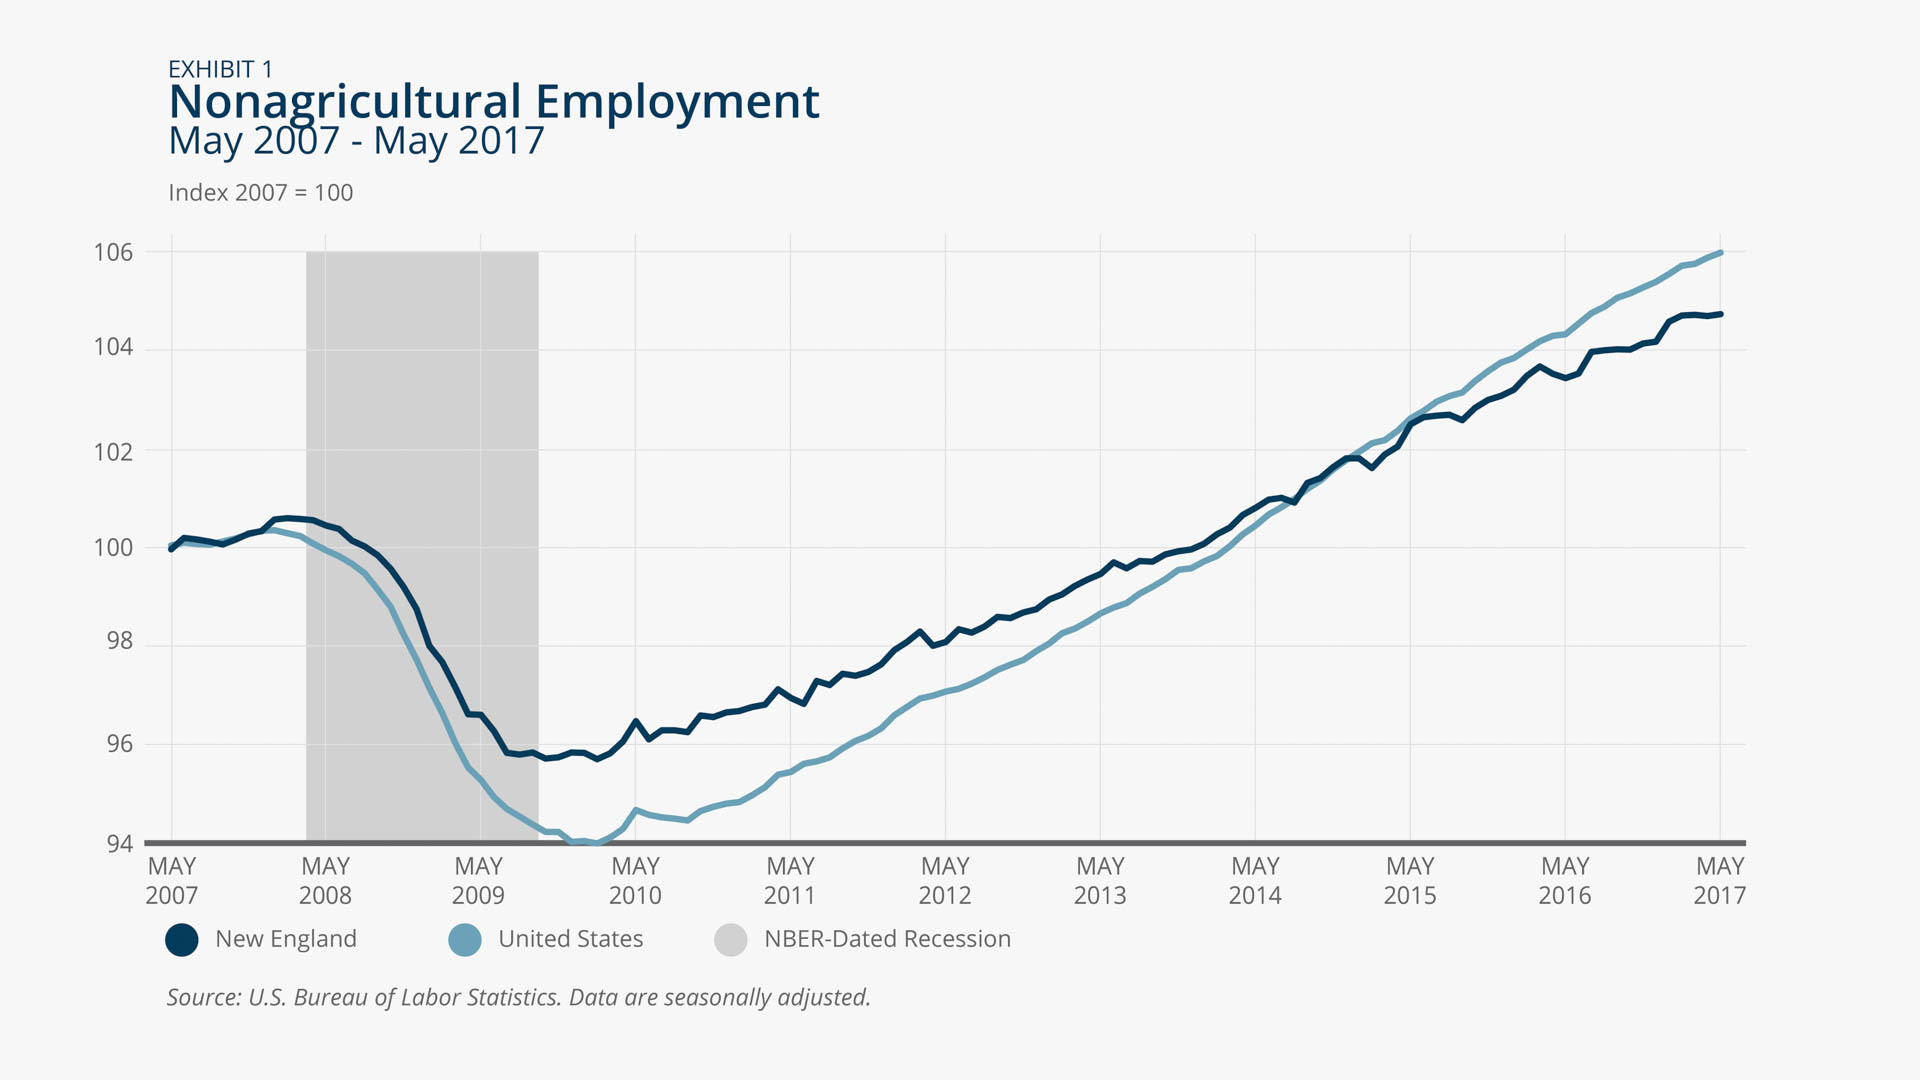
The United States and New England continued to post job gains into 2017. Between May 2016 and May 2017, payroll employment increased 1.6 percent nationally and 1.2 percent regionally (Exhibit 1). Although employment increased since May 2016 in each New England state, job growth rates over that period varied across those states. Within New England, Massachusetts posted the strongest year-over-year job gains through May 2017 (increasing 1.6 percent), and was the only New England state to meet or exceed the national job growth pace during that time period. Vermont posted the slowest employment growth in the region, with job gains of just 0.5 percent over this time period.
Manufacturing sees job losses in New England despite adding jobs in U.S.
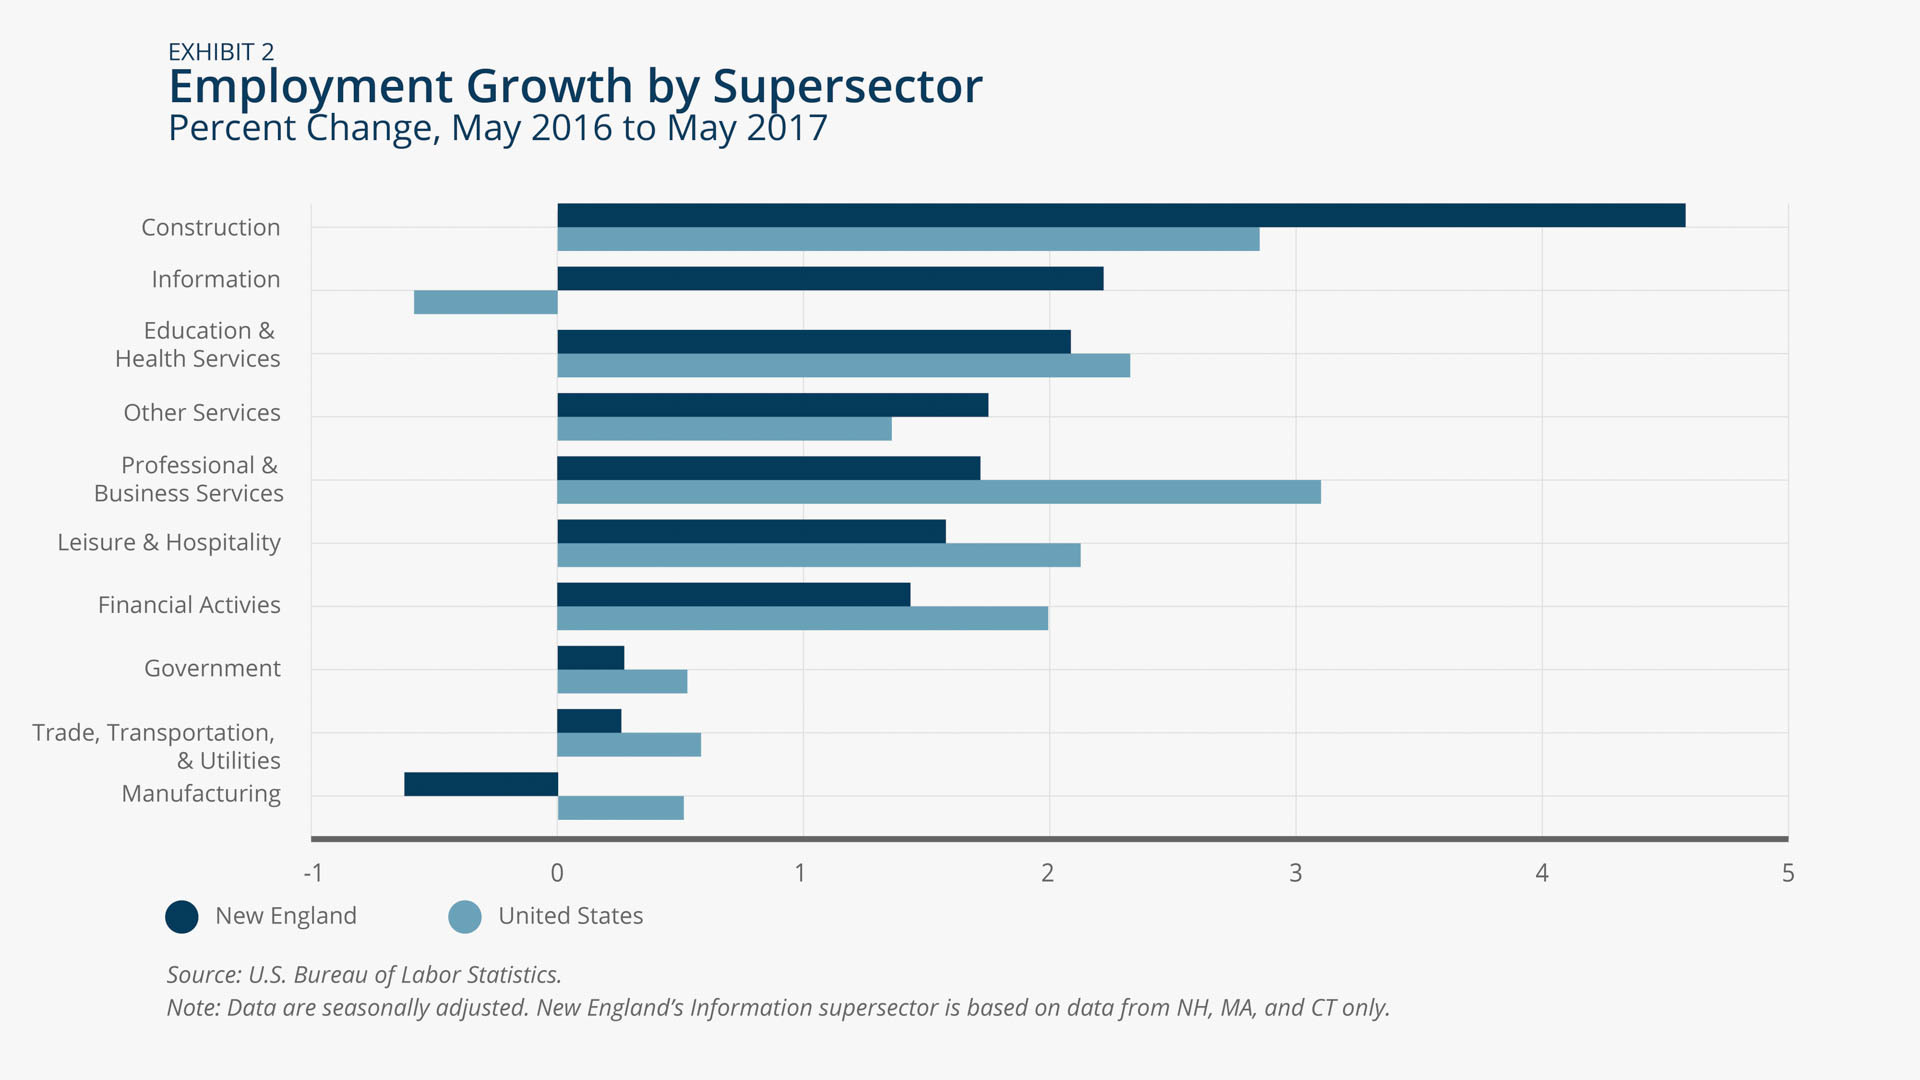
From May 2016 to May 2017, Construction, Information, and Other Services in New England outpaced employment growth in those supersectors nationally (Exhibit 2). For that time period, Manufacturing employment shrank in the region by 0.6 percent despite modest growth nationally of 0.5 percent. Manufacturing employment decreased in four of six New England states, while both Rhode Island (up 1.5 percent) and New Hampshire (up 0.3 percent) experienced increases in manufacturing employment.

Peter Davis/Federal Reserve Bank of Boston
Peter Davis/Federal Reserve Bank of Boston
Unemployment
Unemployment rates declined in four New England states
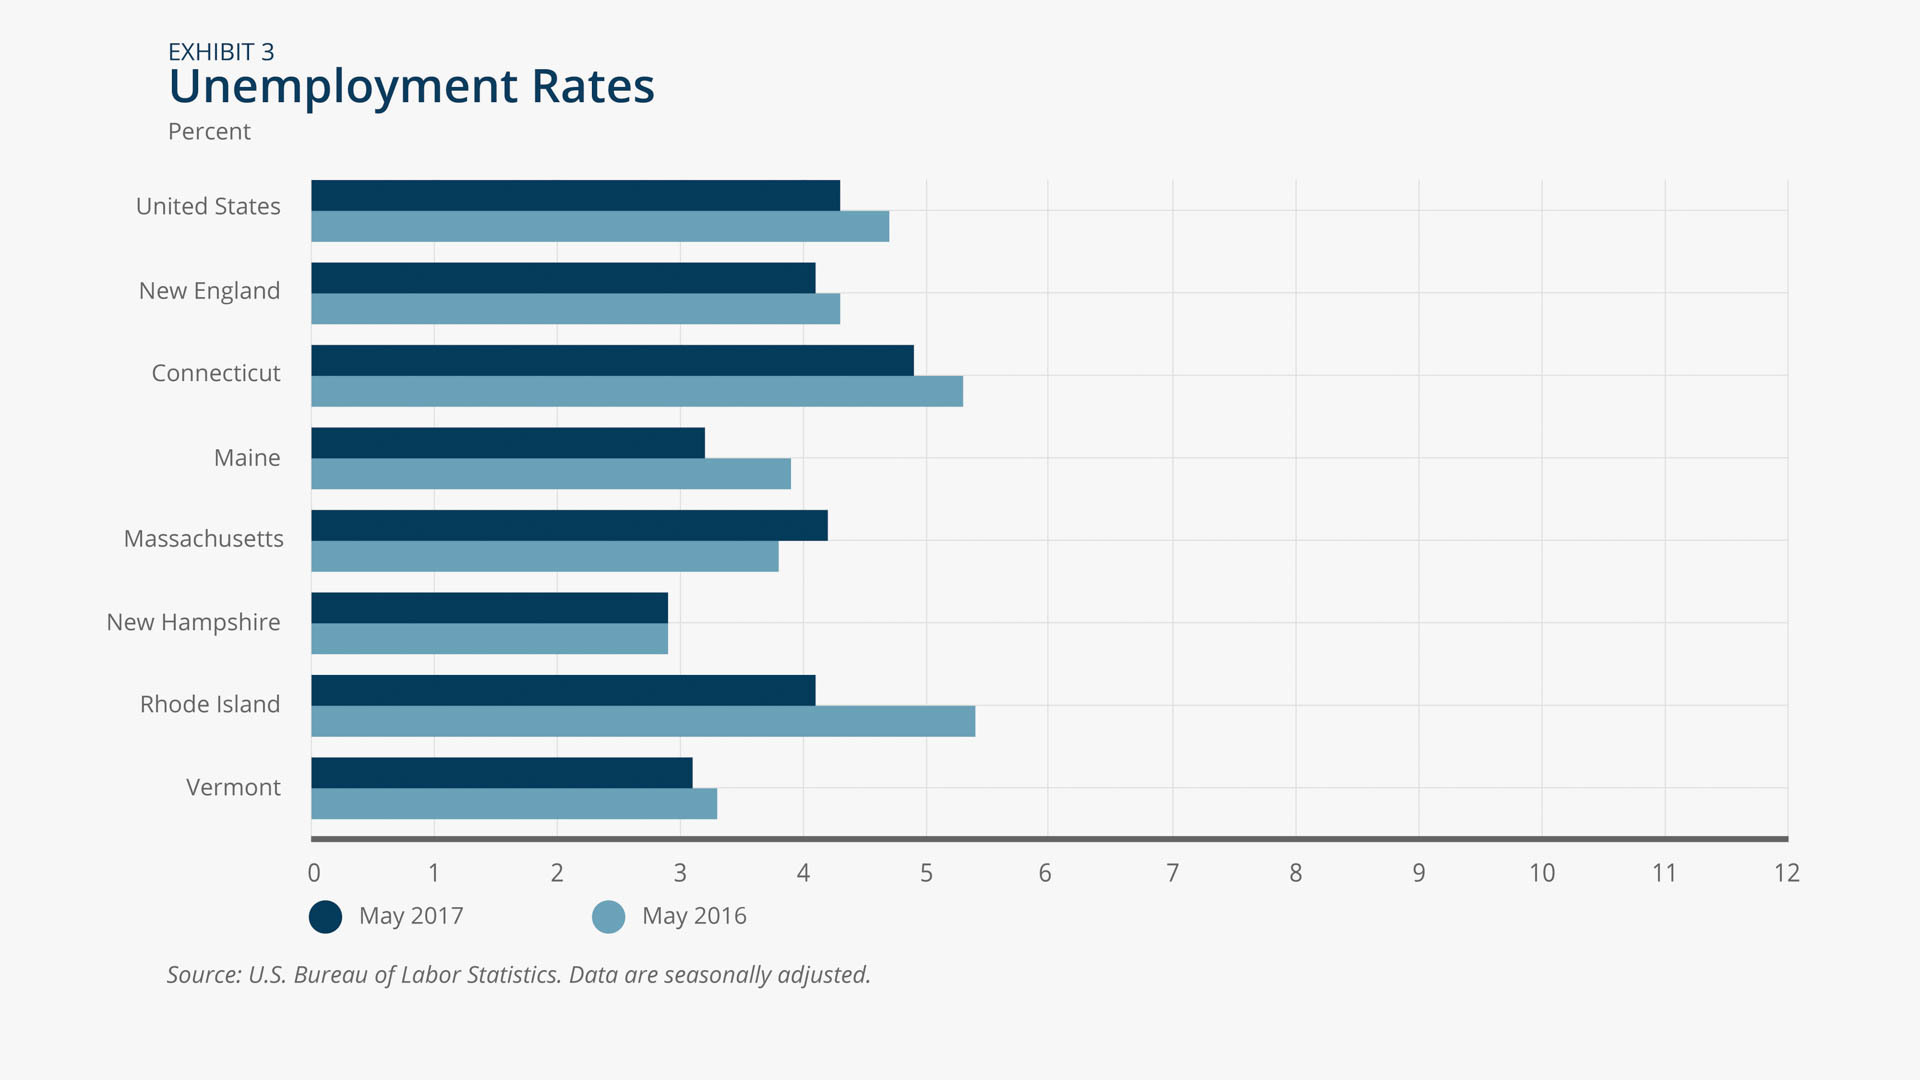
Four of the six New England states saw unemployment rate declines between May 2016 and May 2017, while for the same period unemployment was flat in New Hampshire and up slightly in Massachusetts (Exhibit 3). Considering the region as a whole, the unemployment rate dropped 0.2 percentage points over the year, to land at 4.1 percent, up from a low of 3.6 percent in January 2017. Rhode Island experienced the steepest unemployment rate decline among New England states (1.3 percentage points). The majority of Rhode Island's decline occurred in recent months, with a 0.8 percentage point drop in the unemployment rate since the start of 2017. New Hampshire retained the lowest unemployment rate in the region (2.9 percent) despite remaining flat year-over-year. Connecticut is the only state in the region with an unemployment rate as of May 2017 (4.9 percent) that exceeds the national rate (4.3 percent).
Peter Davis/Federal Reserve Bank of Boston
Consumer Prices
Rising Fuel & Utilities costs contribute to regional consumer price growth
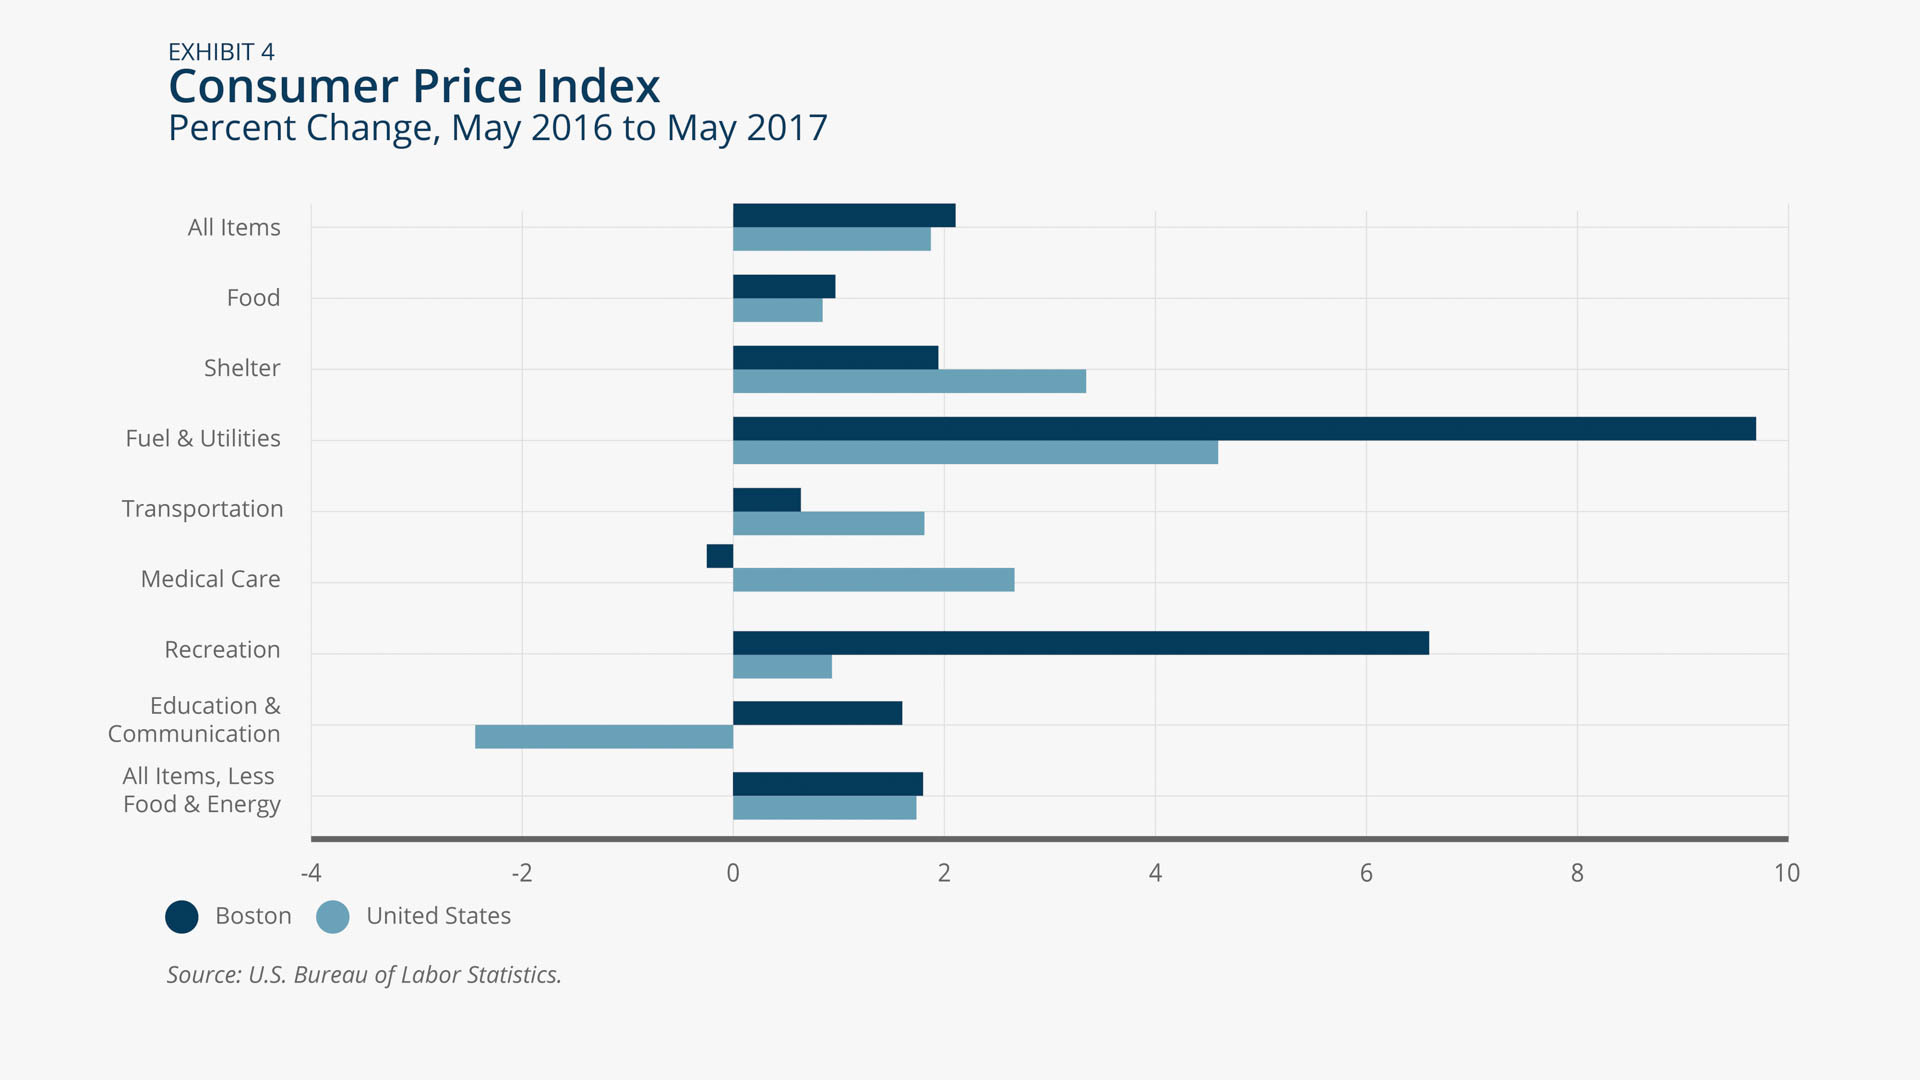
Consumer prices grew at a moderate pace through the start of 2017, although at a slightly faster pace in the Boston area than in the U.S. as a whole (Exhibit 4). In the Boston area, consumer price inflation was 2.1 percent between May 2016 and 2017, while for the same period consumer prices increased 1.9 percent nationwide. The recent price growth in the region was partially driven by a sharp increase (9.7 percent year-over-year) in Fuel & Utilities prices, following months of declines in such prices in 2015 and early 2016. For the U.S., Fuel & Utilities prices increased at the more moderate pace of 4.6 percent over-the-year to May 2017. Medical Care prices increased nationally (2.7 percent year-over-year), but in the Boston area this sector experienced a modest decrease in prices of 0.3 percent over the same period.
Peter Davis/Federal Reserve Bank of Boston
Home Prices
Rhode Island records fastest house price growth in the region
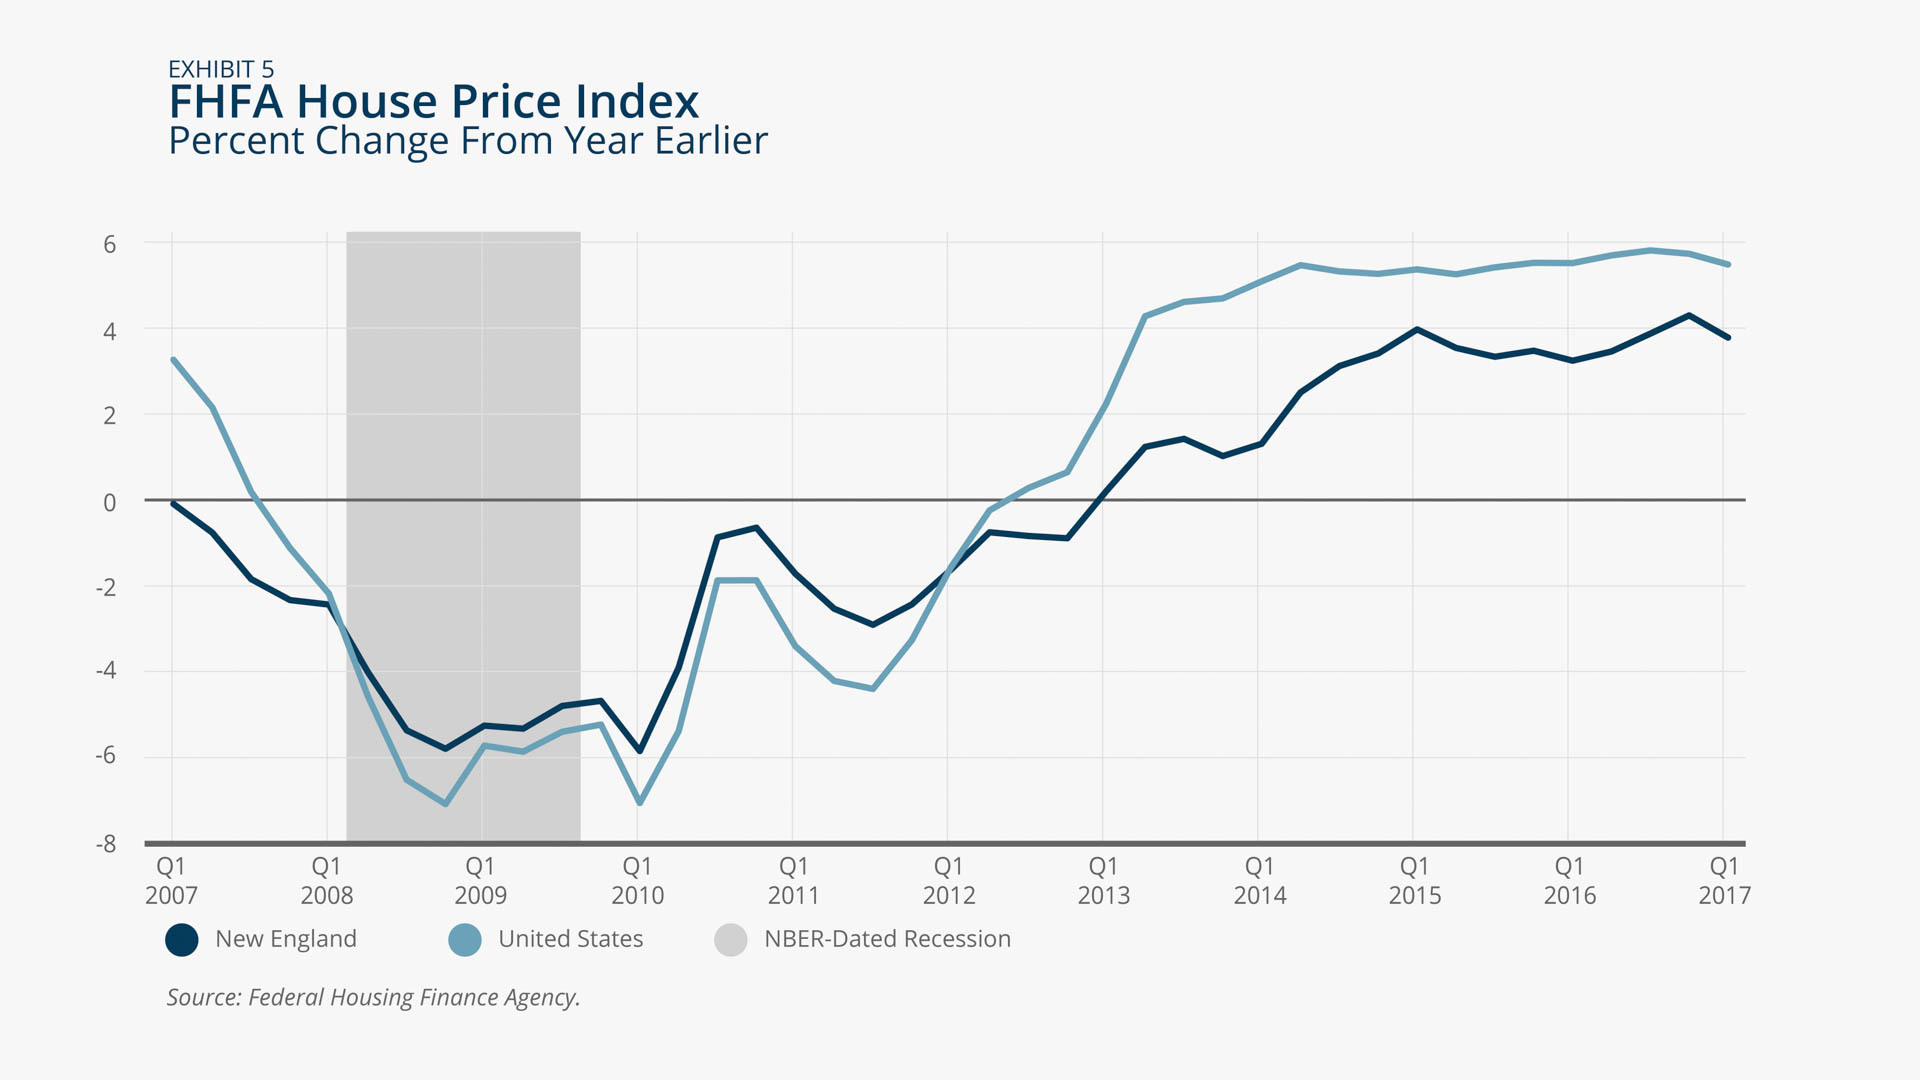
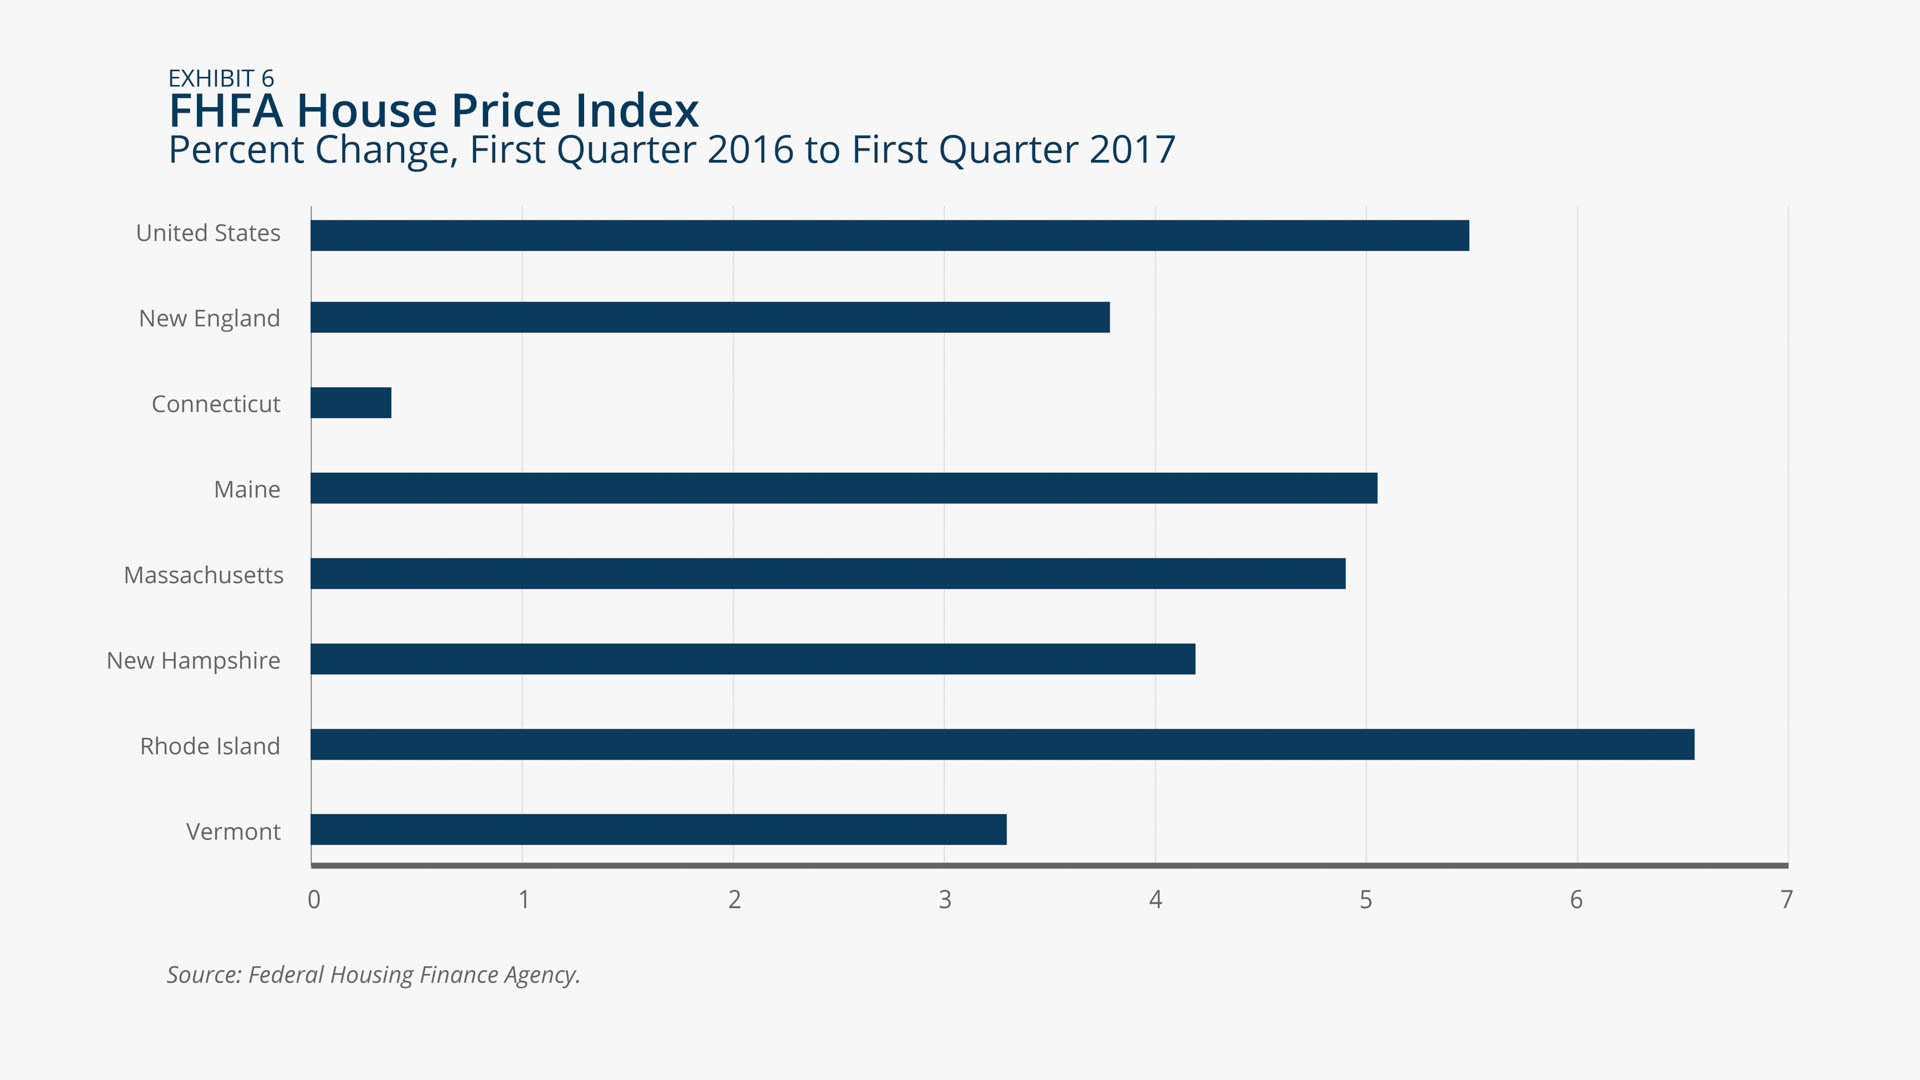
Home prices continued to rise both nationally and regionally, with national growth rates continuing to exceed regional rates (Exhibit 5). Between Q1 2016 and Q1 2017, home prices increased 5.5 percent nationally and 3.8 percent regionally. All six New England states reported positive house price growth year-over-year (Exhibit 6), but with the exception of Rhode Island (6.6 percent), these gains trailed the national growth rate. House price growth in Connecticut was the lowest in the region over the same period, at 0.4 percent.
Peter Davis/Federal Reserve Bank of Boston
Peter Davis/Federal Reserve Bank of Boston

 About the Authors
Riley Sullivan,
Federal Reserve Bank of Boston
Riley Sullivan is a senior policy analyst with the New England Public Policy Center in the Federal Reserve Bank of Boston Research Department.
Email: riley.sullivan@bos.frb.org