The Challenge of Declining K–12 Enrollment in Northern New England 


Key Facts
Between 2000 and 2017, the school-age population declined in all 40 northern New England Counties; it is forecast to continue declining into 2030 in all but five counties.
The share of state and local spending on K–12 education has decreased in each of the three northern New England states, but per-pupil spending has increased in all but one county.
Fourteen percent of the northern New England public schools that were open in 2000 have closed.

COVID-related public health concerns and declining tax revenues raised or continue to raise important questions throughout the country about when and how to restart schools and how to fund them in the near term. For communities across northern New England, there are also fundamental, longer-term concerns over declines in the student population that will still confront districts well beyond the current academic year.
In every county in New Hampshire, Maine, and Vermont, the number of young residents has declined over the last two decades. Northern New England is not alone in facing this demographic shift, but it nonetheless poses challenges to the sustainability of local economies and public services, particularly schools.1 Rising costs have combined with declining enrollment to drive up per-pupil expenditures on elementary and secondary education.
Each New England state saw a substantial decline in revenue in fiscal year 2020 and is projected to see more losses in FY2021.2 In response, school administrators and policymakers have taken steps to try to reduce the anticipated budget shortfalls. State policymakers and local districts across the region have also responded to the longer-term issue of declining school-age population by consolidating school districts, closing schools, and in some cases, reducing K–12 expenditures. Fourteen percent of the northern New England public schools that were open in 2000 are now closed. The communities with the largest declines in enrollment are among those that reduced school expenditures by a rate that nearly matched the rate at which their enrollment decreased; nevertheless, per-pupil spending rose in their counties and nearly every other county. Projections call for the school-age population of northern New England to continue to decline into 2030, suggesting that additional changes may be needed to adequately serve the residents of the affected communities.3
School-age Population Trends and Projections
For the past two decades, the population of northern New England has been aging at a rate faster than the national average. Rural aging, like the aging of much of the rest of the country, results from lower birth rates and increased longevity. Migration also contributes to the disproportionate concentration of older people in rural areas compared with elsewhere in the country. Chronic outmigration of younger residents from rural to urban areas to obtain better educational and job opportunities, as well as net in-migration of older people to rural destinations, has yielded an older population with fewer school-age children.4
Changes in the number of school-age residents since 2000 are shown in Table 1. All 40 counties in Maine, New Hampshire, and Vermont had fewer residents in the 5–19 age group in 2017 than in 2000. These declines have been extreme in some places: Nine of the 16 Maine counties, 2 of the 10 New Hampshire counties, and 8 of the 14 Vermont counties had at least 20 percent fewer school-age residents in 2017 compared with 2000. All but five of northern New England’s counties are projected to continue losing population in this age group into 2030, and seven counties are projected to experience declines of more than 20 percent.5
Table 1: School-age Population Changes
Northern New England Counties, 2000 to 2017 Estimates and 2030 Projections
| County | Percent Change Residents Aged 5 to 19, 2000 to 2017 | Projected Percent Change Residents Aged 5 to 19, 2017 to 2030 | Change in Number of K–12 Schools 2000–2001 to 2016–2017 |
|---|---|---|---|
| Maine | |||
| Androscoggin | -8.4 | -11.5 | -2 |
| Aroostook | -25.6 | -12.4 | -8 |
| Cumberland | -7.6 | -16.9 | -8 |
| Franklin | -20.9 | -24.7 | -5 |
| Hancock | -20.2 | -7.7 | -5 |
| Kennebec | -16.5 | -17.6 | -4 |
| Knox | -18.5 | -19.4 | -4 |
| Lincoln | -24.0 | -19.9 | 1 |
| Oxford | -14.3 | -23.3 | -10 |
| Penobscot | -13.2 | -12.8 | -21 |
| Piscataquis | -26.3 | -28.4 | -11 |
| Sagadahoc | -26.7 | -14.3 | -5 |
| Somerset | -20.2 | -19.4 | -6 |
| Waldo | -12.7 | -24.7 | -4 |
| Washington | -25.2 | -18.8 | -6 |
| York | -12.5 | -15.0 | -11 |
| New Hampshire | |||
| Belknap | -12.8 | -2.3 | -5 |
| Carroll | -20.1 | -5.5 | -3 |
| Cheshire | -14.2 | 0.4 | -7 |
| Coos | -29.2 | -17.9 | -7 |
| Grafton | -11.8 | 3.9 | -4 |
| Hillsborough | -10.6 | -3.6 | 0 |
| Merrimack | -10.4 | -2.8 | -5 |
| Rockingham | -11.9 | -9.2 | -4 |
| Strafford | -1.2 | -1.9 | 1 |
| Sullivan | -13.0 | -7.7 | -1 |
| Vermont | |||
| Addison | -20.3 | -25.2 | -3 |
| Bennington | -20.0 | -8.5 | -6 |
| Caledonia | -16.6 | -7.9 | -6 |
| Chittenden | -6.2 | -6.6 | -10 |
| Essex | -34.0 | -23.3 | -6 |
| Franklin | -11.6 | 1.9 | -2 |
| Grand Isle | -26.7 | 54.0 | -1 |
| Lamoille | -5.6 | 10.8 | -2 |
| Orange | -24.1 | -14.8 | -6 |
| Orleans | -19.2 | -13.5 | -3 |
| Rutland | -23.7 | -23.0 | -9 |
| Washington | -15.1 | -2.6 | -6 |
| Windham | -23.0 | -0.8 | -7 |
| Windsor | -23.9 | -0.3 | -15 |
| Source(s): US Census Bureau 2000 Decennial Census, US Census Bureau American Community Survey, 2013–2017; State of Maine Department of Administrative and Financial Services, State Economist, Demographic Projections; New Hampshire Office of Strategic Initiatives, “State and County Population Projections”; Vermont Agency of Commerce and Community Development, “Vermont Population Projections 2010–2030.” Note(s): New Hampshire and Vermont reflect 2030 projections; the Maine projection is for 2031. |
|||
Revenue Streams and Rising Per-pupil Costs
The stark decline in the school-age population has reduced the number of students attending local public schools and raised concerns in many communities about the fiscal sustainability of their schools. Compared with the national average, the New England states rely more heavily on state and local revenue sources to fund public education; Maine and New Hampshire rely on local revenue sources for more than half of their education funding (Table 2). In addition, northern New England’s per-pupil expenditures are higher than those of the rest of the country, on average, and since 2000 they have risen more rapidly than the national average rate of increase. The southern New England states have similarly increased per-pupil spending above the national average.
Despite increases in elementary and secondary education spending, the education share of total state and local expenditures in northern New England has declined modestly over the last two decades, while spending in other areas has climbed at a faster pace.
Table 2: K–12 Education Finance Profiles
United States, New England, Northern New England States, 2015–2016 School Year
US
New England
ME
NH
VT
Total Enrollment
50,345,842
2,095,877
181,613
182,425
87,866
Total Revenue
$678.4 billion
$39.7 billion
$2.8 billion
$3.1 billion
$1.7 billion
% Local
44.5%
54.0%
53.6%
61.4%
4.0%
% State
47.0%
40.7%
39.4 %
32.9%
89.3%
% Federal
8.3%
5.2%
7.0%
5.7%
6.6%
Per-pupil Expenditures
$13,796
$17,843
$15,531
$15,450
$19,510
Change in Per-pupil Expenditures since 2000
22.6%
43.4%
39.6%
59.8%
62.2%
Education Expenditures as a Share of All State and Local Expenditures
18.0%
19.0%
18.7%
23.2%
20.1%
Percentage Point Change in Education Share of State and Local Expenditures since 2000
-2.9 pp
-3.1 pp
-3.1 pp
-1.3 pp
-2.7 pp
Source(s): National Center for Education Statistics Local Education Agency (School District) Finance Survey (F-33) School Year 2015–2016. US Census Annual Survey of State Government Finances, 2000 and 2016.
Note(s): Percent change expenditure calculations are inflation adjusted using the Personal Consumption Expenditures Price Index. The US numbers are weighted by students, and therefore states that are more populous have a greater impact on the national average.
United States, New England, Northern New England States, 2015–2016 School Year
| US | New England | ME | NH | VT | |
|---|---|---|---|---|---|
| Total Enrollment | 50,345,842 | 2,095,877 | 181,613 | 182,425 | 87,866 |
| Total Revenue | $678.4 billion | $39.7 billion | $2.8 billion | $3.1 billion | $1.7 billion |
| % Local | 44.5% | 54.0% | 53.6% | 61.4% | 4.0% |
| % State | 47.0% | 40.7% | 39.4 % | 32.9% | 89.3% |
| % Federal | 8.3% | 5.2% | 7.0% | 5.7% | 6.6% |
| Per-pupil Expenditures | $13,796 | $17,843 | $15,531 | $15,450 | $19,510 |
| Change in Per-pupil Expenditures since 2000 | 22.6% | 43.4% | 39.6% | 59.8% | 62.2% |
| Education Expenditures as a Share of All State and Local Expenditures | 18.0% | 19.0% | 18.7% | 23.2% | 20.1% |
| Percentage Point Change in Education Share of State and Local Expenditures since 2000 | -2.9 pp | -3.1 pp | -3.1 pp | -1.3 pp | -2.7 pp |
| Source(s): National Center for Education Statistics Local Education Agency (School District) Finance Survey (F-33) School Year 2015–2016. US Census Annual Survey of State Government Finances, 2000 and 2016. Note(s): Percent change expenditure calculations are inflation adjusted using the Personal Consumption Expenditures Price Index. The US numbers are weighted by students, and therefore states that are more populous have a greater impact on the national average. | |||||
It should be noted that education spending is not related solely to demographic trends. Regional differences in the shares of state and local budgets allotted to education result from variation in the services provided by schools, local labor costs, and political choices.
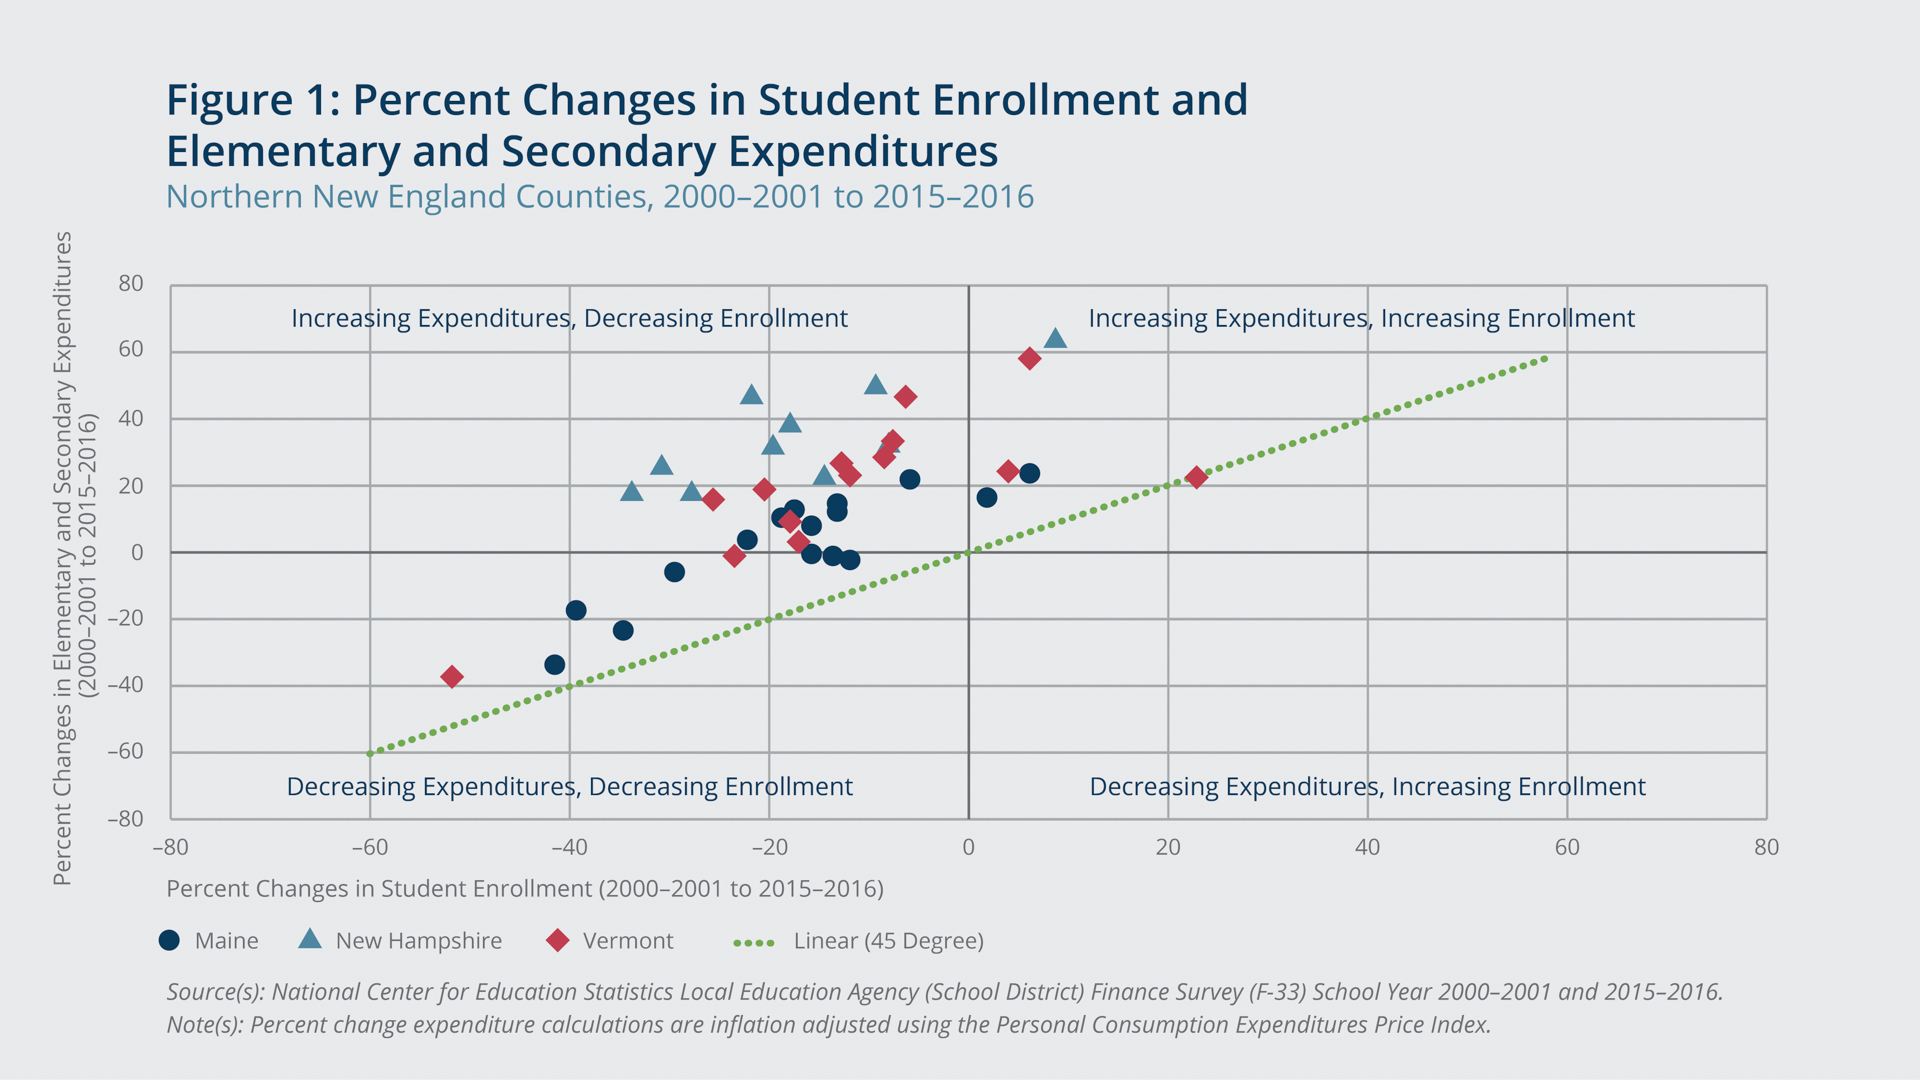
Education spending has increased in northern New England overall, but not in every county. Figure 1 shows that inflation-adjusted K–12 expenditures declined in 9 of the 40 northern New England counties between the 2000–2001 and 2015–2016 school years. The counties with lower spending (clustered in the lower-left-hand quadrant) include those that experienced the largest declines in enrollment during that period.

Federal Reserve Bank of Boston
A handful of counties saw their enrollment increase despite experiencing a loss of population in the 5–19 age group. This discrepancy occurred mostly in counties with smaller populations where relatively slight shifts in enrollment can be significant. It may have been the result of the grouping’s age span not corresponding exactly with school-enrollment ages. There is also the possibility that some residents attended schools across county lines from where they lived. Alternatively, the share of students attending private schools may have decreased; the data used in this report pertain to public school students only. Whatever the circumstances surrounding gains in the number of students, counties where the enrollment rose were among those that had the largest increases in spending.
Nearly every county experienced an increase in per-pupil spending over this period, as indicated in Figure 1 by a county’s position above the 45-degree line (dashed green), which denotes equal percentage changes in expenditures and enrollment. Grand Isle, Vermont, was the only northern New England county where per-pupil spending did not rise. Most of the 40 counties lie in the upper-left-hand quadrant of Figure 1, indicating a declining enrollment and rising total expenditures.
School Closures and Consolidations
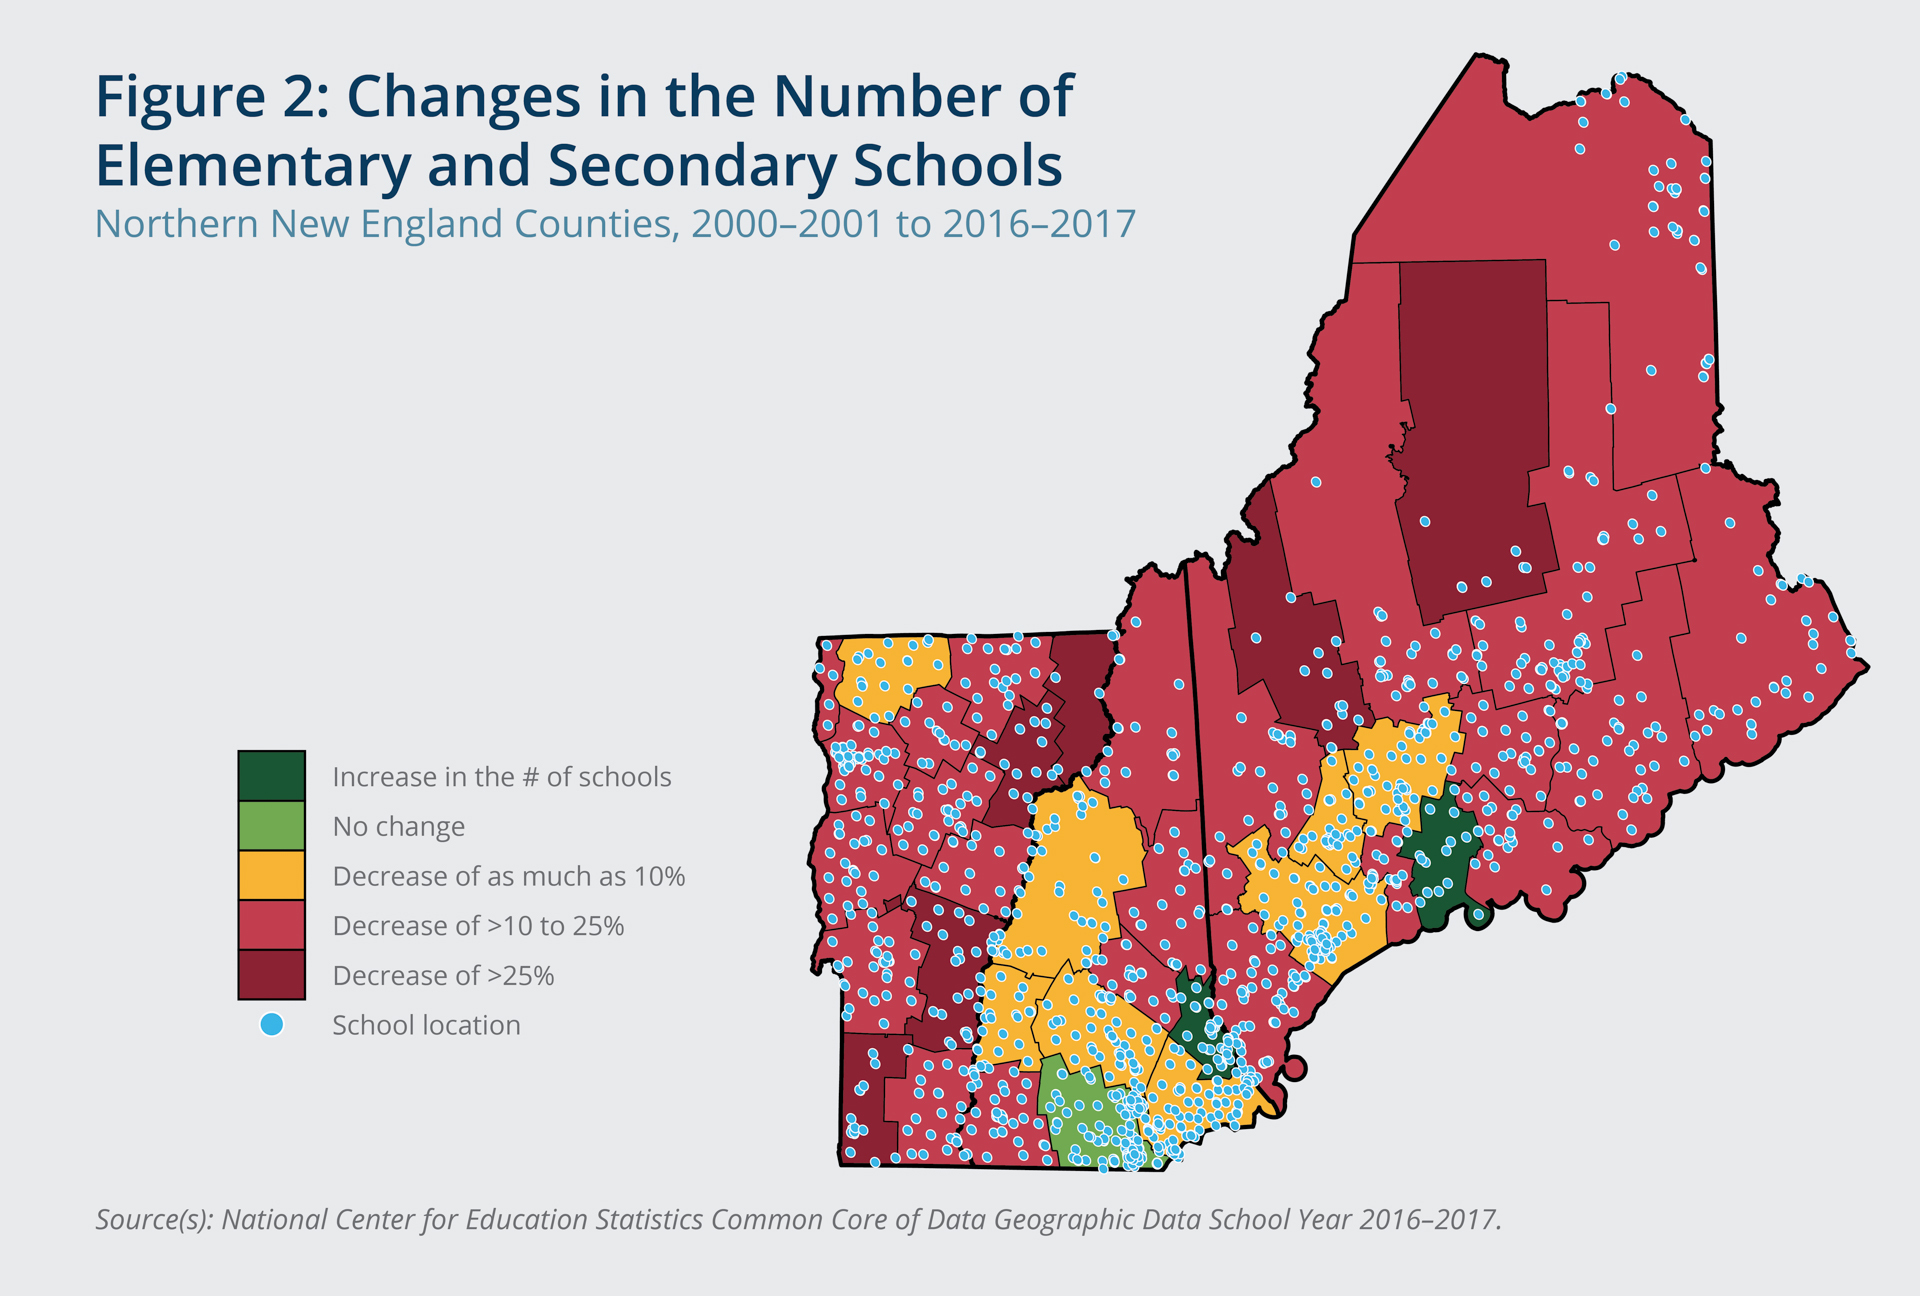
Districts have responded to decreasing K–12 enrollment by closing schools and accommodating students in fewer facilities.6 The last column in Table 1 lists the change in the number of public elementary and secondary schools in a county between the 2000–2001 and 2016–2017 school years. In every Vermont county, the number of schools decreased; increases were limited to just one county in Maine and one in New Hampshire. Combined, the three northern New England states saw a net reduction of 214 public schools—a 14 percent decline—between the 2000–2001 and 2016–2017 school years.7
Figure 2 shows the locations of public schools across northern New England. The shading indicates the percentage change in the number of public schools in that county. Several counties closed more than a quarter of their schools between the 2000–2001 and 2016–2017 school years. With the exception of Hillsborough and Strafford Counties in southern New Hampshire and Lincoln County in Maine, every northern New England county shuttered more schools than it opened during that time period.
Federal Reserve Bank of Boston
The rationale behind consolidation of small schools and districts is that it can produce greater efficiency through fewer administrative positions and fewer properties to maintain while enhancing opportunities for students through larger peer groups and expanded curricula.8 Available research on consolidation tends to focus on the narrower question of whether it is effective at decreasing costs. Some studies confirm that consolidation decreases the per-pupil costs of local schools, but they also identify a number of offsetting factors—such as increased transportation needs and increased capital spending—that make cost savings easier to achieve in principle than in practice.
School Consolidation Policies in Northern New England
The school closures and changes in spending documented in this brief are evidence of the efforts state and local policymakers are making in response to the demographic and economic shifts confronting the education community. Both Vermont and Maine have pursued major consolidation-focused reforms in recent years.
In 2015, Vermont passed a law known as Act 46 that would make districts eligible for additional aid if, as a means of reducing costs, they merged into a supervisory union by the end of 2019. In a supervisory union, a single governing body oversees administrative, planning, and educational services for the member school districts. A union’s districts have the rights and responsibilities of any school district, and each town in a union has the same property tax rate; property tax revenue is the primary source of funding for a union’s school districts. Supervisory unions have been in place in Vermont for more than 60 years, but the goal of Act 46 was to make them more common and thereby further consolidate and reduce administrative costs for smaller districts.10
From 2015 through 2019, voter-approved supervisory union districts were established for 47 percent of Vermont’s K–12 population. Twenty-one percent of the state’s K–12 population was already living in supervisory union districts when Act 46 was enacted. A 2018 State Board of Education order ultimately will result in supervisory unions for another 13 percent, raising the share of Vermont’s student population living in union districts to 81 percent.11 The promise of grants and tax incentives helped secure Vermont voters’ approval of school district consolidation. Other states have used different tactics to foster consolidation. Maine, for example, used to place an emphasis on potential punitive measures against districts that did not consolidate. Penalties included reduced state subsidies.12 There has been a long history of resistance to school consolidation due in part to the perceived impact on the local economy, possible layoffs, and a greater preference for local control.13
Maine’s school administrative districts and New Hampshire’s school administrative units operate under similar guidelines as Vermont’s supervisory units. While Maine and New Hampshire have had some district consolidation in recent years, it has not been on the scale Vermont experienced following the passage of Act 46.
Maine made a large consolidation effort in 2007, seeking to reduce its number of districts from 290 to approximately 80. After 10 years, the state had roughly 160 districts—a stark reduction but still far from the goal. Some districts that did consolidate also created new positions for staff whose old jobs were rendered redundant by the mergers and therefore eliminated. Adding these new positions reduced the fiscal benefits of the consolidations. In 2012, after frequently amending the legislation governing consolidation and often granting exemptions that allowed districts to avoid punitive measures, the state removed the fiscal penalties for failing to consolidate.14
Throughout northern New England and elsewhere, opponents and proponents of school consolidation are watching how Act 46 unfolds in Vermont to see if these new districts can contain costs and provide quality education. Across the country, school districts have tried shortening school weeks to reduce costs, but that approach has been criticized for its potential negative impact on education and on parents’ ability to work.
Conclusion
In response to the declining school-age population, the northern New England states have made policy choices that include reducing the number of schools and districts. School district spending is connected to enrollment size, and though the two have not decreased at the same rate in northern New England, each of the three states’ expenditures for K–12 education now account for a smaller share of state and local spending compared with their school expenditures in 2000. Furthermore, the counties that experienced the sharpest declines in enrollment are, on average, the counties where total elementary and secondary expenditures either decreased or grew more slowly.
The options facing state and local policymakers include raising additional revenues, allowing per-pupil education spending to crowd out other potential municipal spending, finding ways to reduce the cost of providing K–12 education, and/or implementing policies that help to balance their community’s age profile through economic and community development or federal immigration programs. High and rising per-pupil expenditures, coupled with forecasts of future declines in school-age population, suggest further steps are needed.
Lost revenue and unexpected expenses due to the COVID-19 pandemic will likely exacerbate the financial strain on many districts. Some districts laid off employees this spring, and further cuts are expected.15 During recessions, school administrators and policymakers historically have faced difficult choices. For some smaller districts with looming budget deficits, consolidation is among the options likely to be considered.16
Data Sources
The National Center for Education Statistics provides data on all public school systems across the United States. The Local Education Agency (School District) Universe Survey data include a complete listing of all public elementary and secondary schools in the country, providing basic information and descriptive statistics on all schools, their students, and their teachers.
The primary purpose of the Local Education Agency (School District) Finance Survey (F-33) is to provide revenue and expenditure data for all school districts in the United States. These data are also collected by the Governments Division of the US Census Bureau and have been released as the F-33 survey. These data can be linked to the data on the non-fiscal CCD Local Education Agency Universe.
Endnotes
- The number of residents under the age of 18 has declined in all six New England states since 2000. However, the average percentage decline in the school-age population was smaller in the three southern New England states compared with the three northern New England states. Furthermore, one county in Connecticut (Fairfield) and two counties in Massachusetts (Nantucket and Norfolk) actually saw increases in school-age residents between 2000 and 2017. Since 2000, the number of people under the age of 18 in the United States has increased by more than 3 million.
- Zhao, Bo. 2020. “Forecasting the New England States’ Tax Revenues in the Time of the COVID-19 Pandemic.” Current Policy Perspectives. July 9, 2020. Federal Reserve Bank of Boston Research Department. https://www.bostonfed.org/publications/current-policy-perspectives.aspx
- The methodology used for the county projections is the cohort-component method. This methodology uses births, deaths, and migration to advance each age-sex cohort through the projection period. It allows specific survival and migration rates to be calculated for each age-sex cohort. The migration rates operate on the concept of “at risk” populations. The population at risk of migrating is identified and used as the basis for migration rates. To calculate the population at risk of migration, the number of in-migrants is subtracted from the 2016 cohort population and the number of outmigrants is added. For counties with college populations, half of the current college-age cohort and half of the subsequent age cohort are subtracted from the population. The outmigration rate is calculated by dividing the number of outmigrants by the surviving population at risk for both the current college-age cohort and the subsequent cohort and averaging the two. For more detail from one state, see “Maine Population Outlook 2016 to 2026,” Maine State Economist, Maine Department of Administrative and Financial Services, 2008. https://www.maine.gov/dafs/economist/sites/maine.gov.dafs.economist/files/inline-files/Maine%20Population%20Outlook%20to%202026.pdf
- Glasgow, Nina, and David Brown. 2012. “Rural Ageing in the United States: Trends and Contexts.” Journal of Rural Studies. 28(4): 422–431. https://doi.org/10.1016/j.jrurstud.2012.01.002
- Nationally, between 2000 and 2017, the size of the population aged 5 to 19 decreased 1.7 percent. Across the southern New England states, just three counties in Massachusetts (Suffolk, Nantucket, and Dukes) are projected to see their school-age population increase by 2030.
- The practice of consolidating rural schools, however, dates back much further—to the mid-1800s in the United States. School districts have faced fluctuations in enrollment for decades as large birth cohorts have moved through the education system.
- This calculation is based on analysis of the National Center for Education Statistics Common Core of Data Local Education Agency Universe files from the 2000–2001 and 2016–2017 school years. Each school district lists the number of schools it has open in that school year. The total number of active schools was aggregated to the county level by a variable provided in the files.
- Bard, Joe, Clark Gerdener, and Regi Wieland. 2016. “Rural School Consolidation: History, Research Summary, Conclusions, Recommendations.” The Rural Educator 27(2): 40–48.
- Duncombe and Yinger (2007) find that among small rural schools, consolidation initiatives that doubled school enrollment yielded per-pupil savings of 50 percent for larger districts and even greater savings for smaller districts. Although these benefits were typically partially offset by large capital spending projects. Modest net savings persist, particularly among the smallest districts. Research by Bard et al. (2016) points to increased transportation costs as an additional factor offsetting declines in administrative expenses. A study by Gordon and Knight (2008) suggests that consolidation actually leads to modest increases in local expenditures, on average, but these may be offset by state financial incentives to consolidate, resulting in net cost declines at the local level.
Duncombe, William, and John Yinger. 2007. “Does School District Consolidation Cut Costs?” Education Finance and Policy 2(4): 341–375.
Bard, Joe, Clark Gerdener, and Regi Wieland. 2016. “Rural School Consolidation: History, Research Summary, Conclusions, Recommendations” The Rural Educator 27(2): 40–48.
Gordon, Nora, and Brian Knight. 2008. “The Effects of School District Consolidation on Educational Cost and Quality.” Public Finance Review 36(4). - Heather Bellow, “State-mandated School Mergers and Consolidation Talks Stir Interest, Controversy in the Region,” Berkshire Eagle, February 28, 2019. https://www.berkshireeagle.com/stories/state-mandated-school-mergers-and-consolidation-talks-stir-interest-controversy-in-the-region,566209
- State of Vermont Agency of Education. Merger Activity. https://education.vermont.gov/vermont-schools/school-governance/merger-activity
- Rich Hewitt, “School Consolidation Penalties Eliminated Effective 2012–13,” Bangor Daily News, June 3, 2011.
- Julie Bosman, “School’s Closed Forever,” New York Times, June 13, 2018; Michelle Molnar, “Public Strong on Local Control of Schools, Study Finds,” Education Week, July 17, 2012. http://blogs.edweek.org/edweek/parentsandthepublic/2012/07/what_the_public_wants_in_school_control.html.
- Katherine Barrett and Richard Greene, “Why Schools Resist Consolidating,” Governing, October 2014.
- Valerie Strauss, “K-12 School Leaders Warn of ‘Disaster’ from Huge Coronavirus-related Budget Cuts as Layoffs and Furloughs Begin,” Washington Post, May 8, 2020.
- Noelle M. Ellerson and Robert S. McCord, “One Year Later: How the Economic Downturn Continues to Impact School Districts,” American Association of School Adminstrators, October 2009. https://www.aasa.org/uploadedFiles/Resources/files/OneYearLater%20FINAL.pdf

 About the Authors
Riley Sullivan,
Federal Reserve Bank of Boston
Riley Sullivan is a senior policy analyst with the New England Public Policy Center in the Federal Reserve Bank of Boston Research Department.
Email: riley.sullivan@bos.frb.org