Yale Labor Survey - Report of December 29, 2020 for the week ending December 19, 2020 

Meghan Smith/Federal Reserve Bank of Boston


The Yale Labor Survey, a research project from Yale University’s Tobin Center for Economic Policy, is designed to provide policy makers and the public with real-time information about the US labor market. Its questions are modelled on those of the monthly BLS-Census Current Population Survey. The project has been designed and developed by researchers at Yale University, Stanford University, and the Boston Fed’s research department. Data are made available weekly at the websites of the Boston Fed and the Yale Labor Survey website at the Tobin Center. Background documentation for the Yale Labor Survey is available in Cowles Foundation Discussion Paper No. 2243. The Yale Labor Survey is not an official forecast of the Federal Reserve Bank of Boston or its president, the Federal Reserve System, or the Federal Open Market Committee.
Results Summary
Current YLS results cover labor market activities through the week of December 13-19, which is one week after the reference week for the December Current Population Survey (CPS). YLS data are not seasonally adjusted and refer to the population aged 20 and older. This week’s key findings are as follows:
- YLS employment measures declined slightly in the most recent survey. For the week ending December 19, the YLS estimate of persons at work as a share of population (the work-for-pay ratio) was 0.3 percentage point lower than the previous week. The employment-to-population ratio, which also includes persons temporarily absent from work, fell by 0.1 percentage point over the same period.
- Both the work-for-pay ratio and the employment-to-population ratio have declined since the CPS’s reference week for November. The work-for-pay ratio is 0.5 percentage point lower than its mid-November value, while the employment-to-population ratio has fallen by 0.2 percentage point. On Friday, January 8, the Bureau of Labor Statistics will report December CPS employment growth in its Employment Situation report.
- The YLS estimate of the unemployment rate fell by 1.6 percentage points in the most recent survey. Most of this decline resulted from a large decline in labor force participation, which fell by 1.3 percentage points. The participation decline could be due to seasonal factors during the holiday season, because YLS data are not seasonally adjusted. Since mid-October, the YLS unemployment rate has been significantly higher than the CPS unemployment rate. The proximate cause of this discrepancy is a higher share of YLS respondents who are looking for work, as non-employed persons who are conducting active job searches are counted as unemployed in labor market surveys.
- All of the data generated in this report use the updated system of sample weights that were introduced in the YLS report of December 15. The new weighting system improves the agreement between YLS and CPS measures of working-for-pay and employment, but does less well in matching unemployment and participation. Details can be found in the Variable and Weight Description on this website.
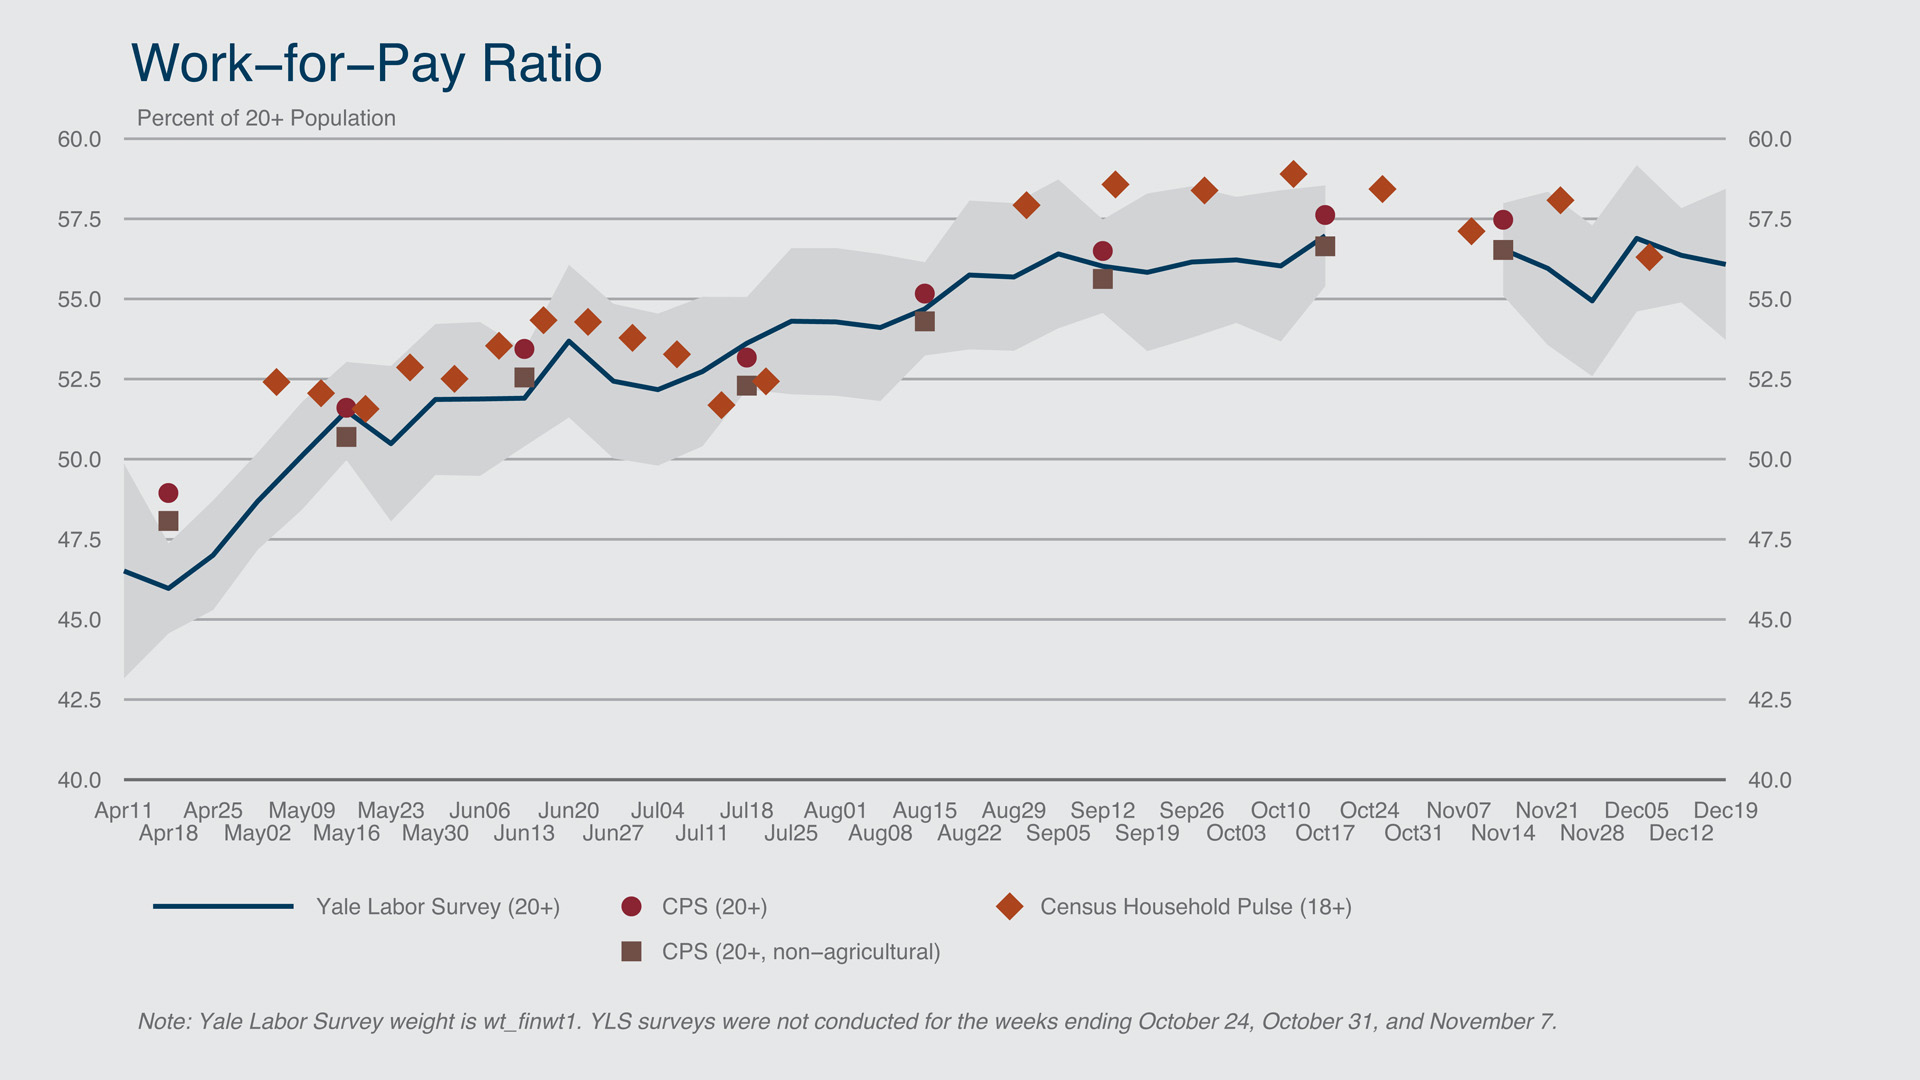
Work-for-Pay Ratio
The work-for-pay ratio (WFPR) measures the fraction of survey respondents who report that they worked for pay or profit during the reference week. After declining by 0.5 percentage point during the week of December 12, the WFPR fell by 0.3 percentage point during the week of December 19, to 56.1%.
Federal Reserve Bank of Boston
Employment-to-Population Ratio
The employment-to-population ratio (EPR) is the standard measure of labor market activity reported by the Bureau of Labor Statistics (BLS). In addition to persons working for pay, the EPR also includes workers who are absent from their regular jobs (for example, workers on vacation). The EPR declined by 0.8 percentage point during the week of December 12 and fell a further 0.1 percentage point during the week of December 19. The most-recent level of the EPR rounds to 57.8%, the same as the previous week.
During the pandemic, the BLS has stated that the CPS has had difficulty distinguishing between workers who were absent from their jobs for the usual reasons (such as vacation or illness) and workers who were displaced by the pandemic. An alternative measure of the government’s EPR calculated by YLS researchers with CPS microdata, “EPR-alt,” is designed to remove pandemic-displaced workers from CPS employment. The EPR-alt measure is close to the YLS definition of employment, which includes only paid absences and is therefore less susceptible to classification error (see the background documentation for details). The most recent CPS estimate for EPR-alt corresponds to the week ending November 14, when this statistic was 58.9%, down slightly from its 59.1% reading from mid-October.
Federal Reserve Bank of Boston
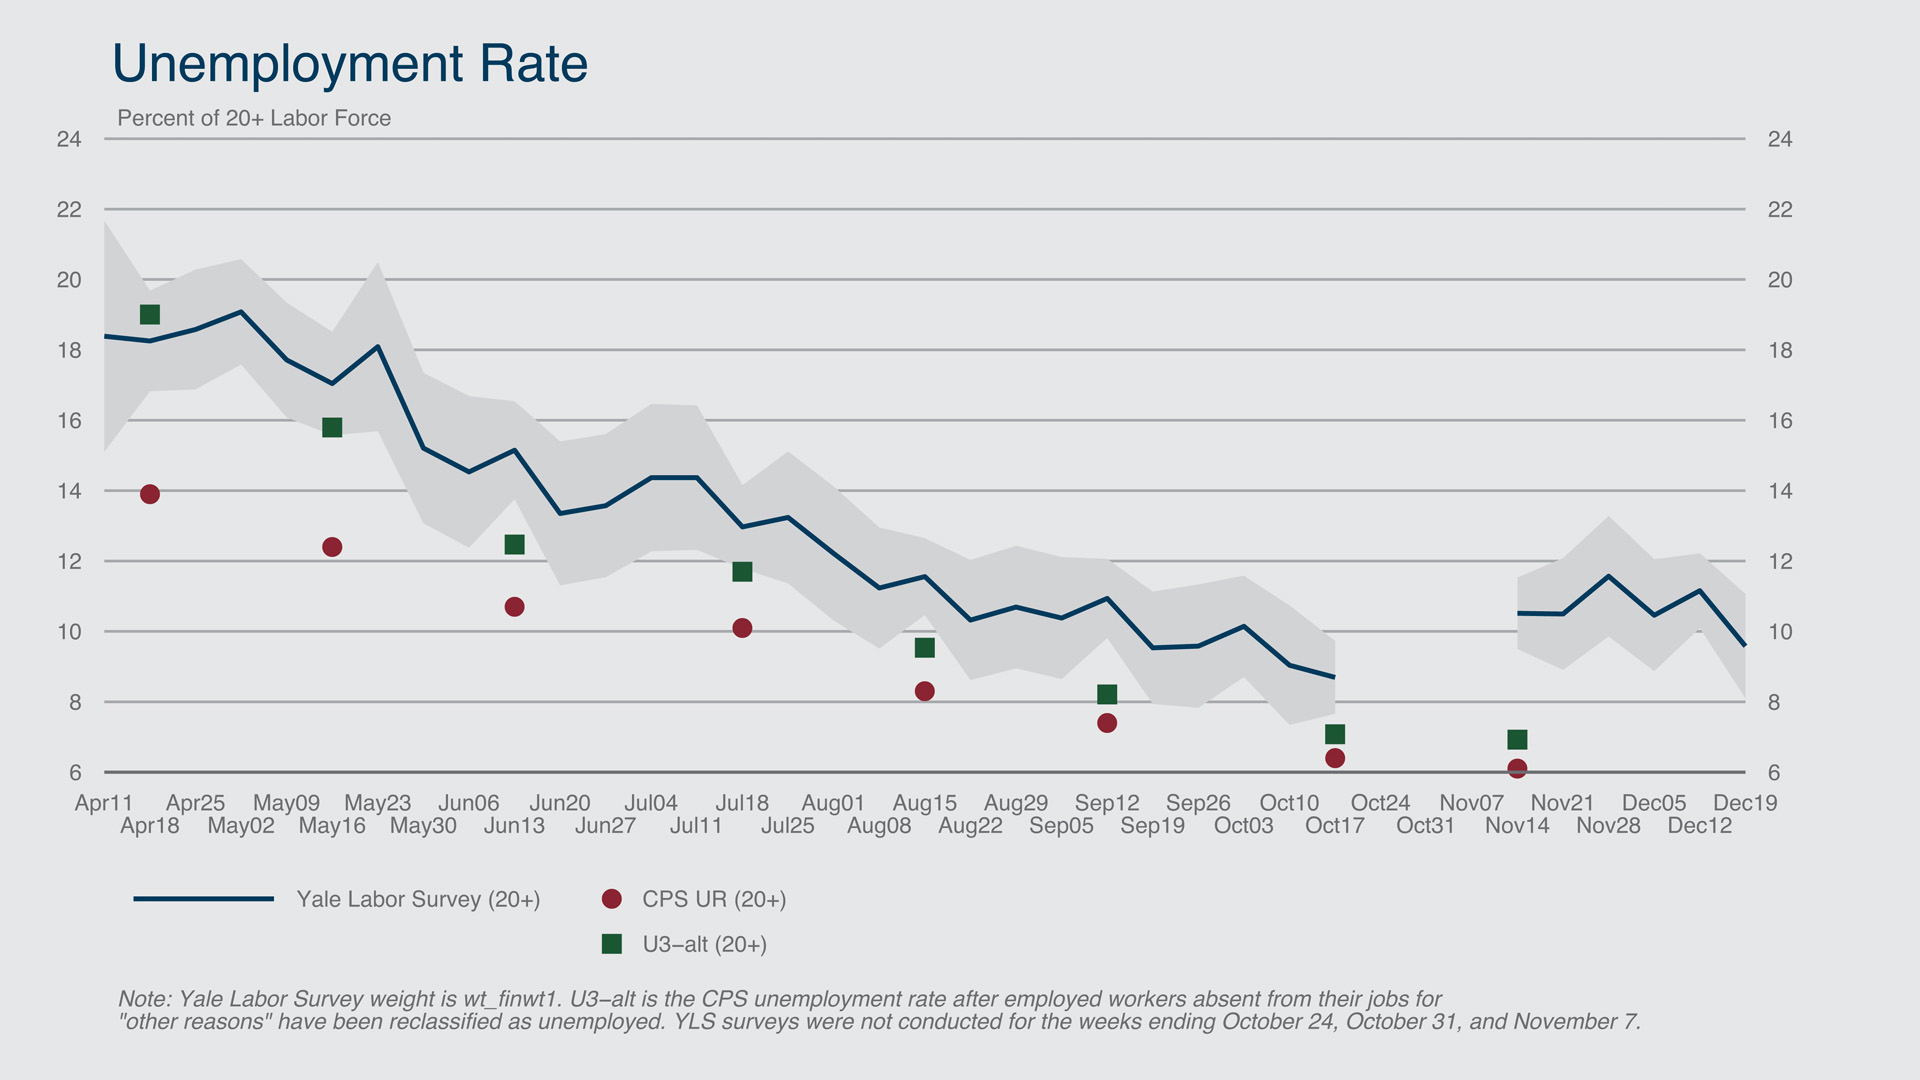
Unemployment Rate
The YLS has consistently overestimated the unemployment rate, although the divergence depends upon whether corrections for recent CPS classification errors discussed above are made. To be classified as unemployed, a non-employed person must either (i) have actively searched for a job in the last four weeks, or (ii) be laid off from a job with an expectation of return. The questions that gather information about job-search activities and layoff conditions differ slightly between the CPS and YLS.
As noted above, the unemployment-rate discrepancy has been high in recent weeks. The YLS unemployment rate stood at 10.5% during the November CPS reference week, compared to a published CPS 20+ rate of 6.1%. In the most recent report, the YLS unemployment fell by 1.6 percentage points, to 9.6%. Given the small changes in employment in this week’s report, the large decline in the weekly unemployment rate stemmed mostly from a decline in labor force participation, discussed below.
Federal Reserve Bank of Boston
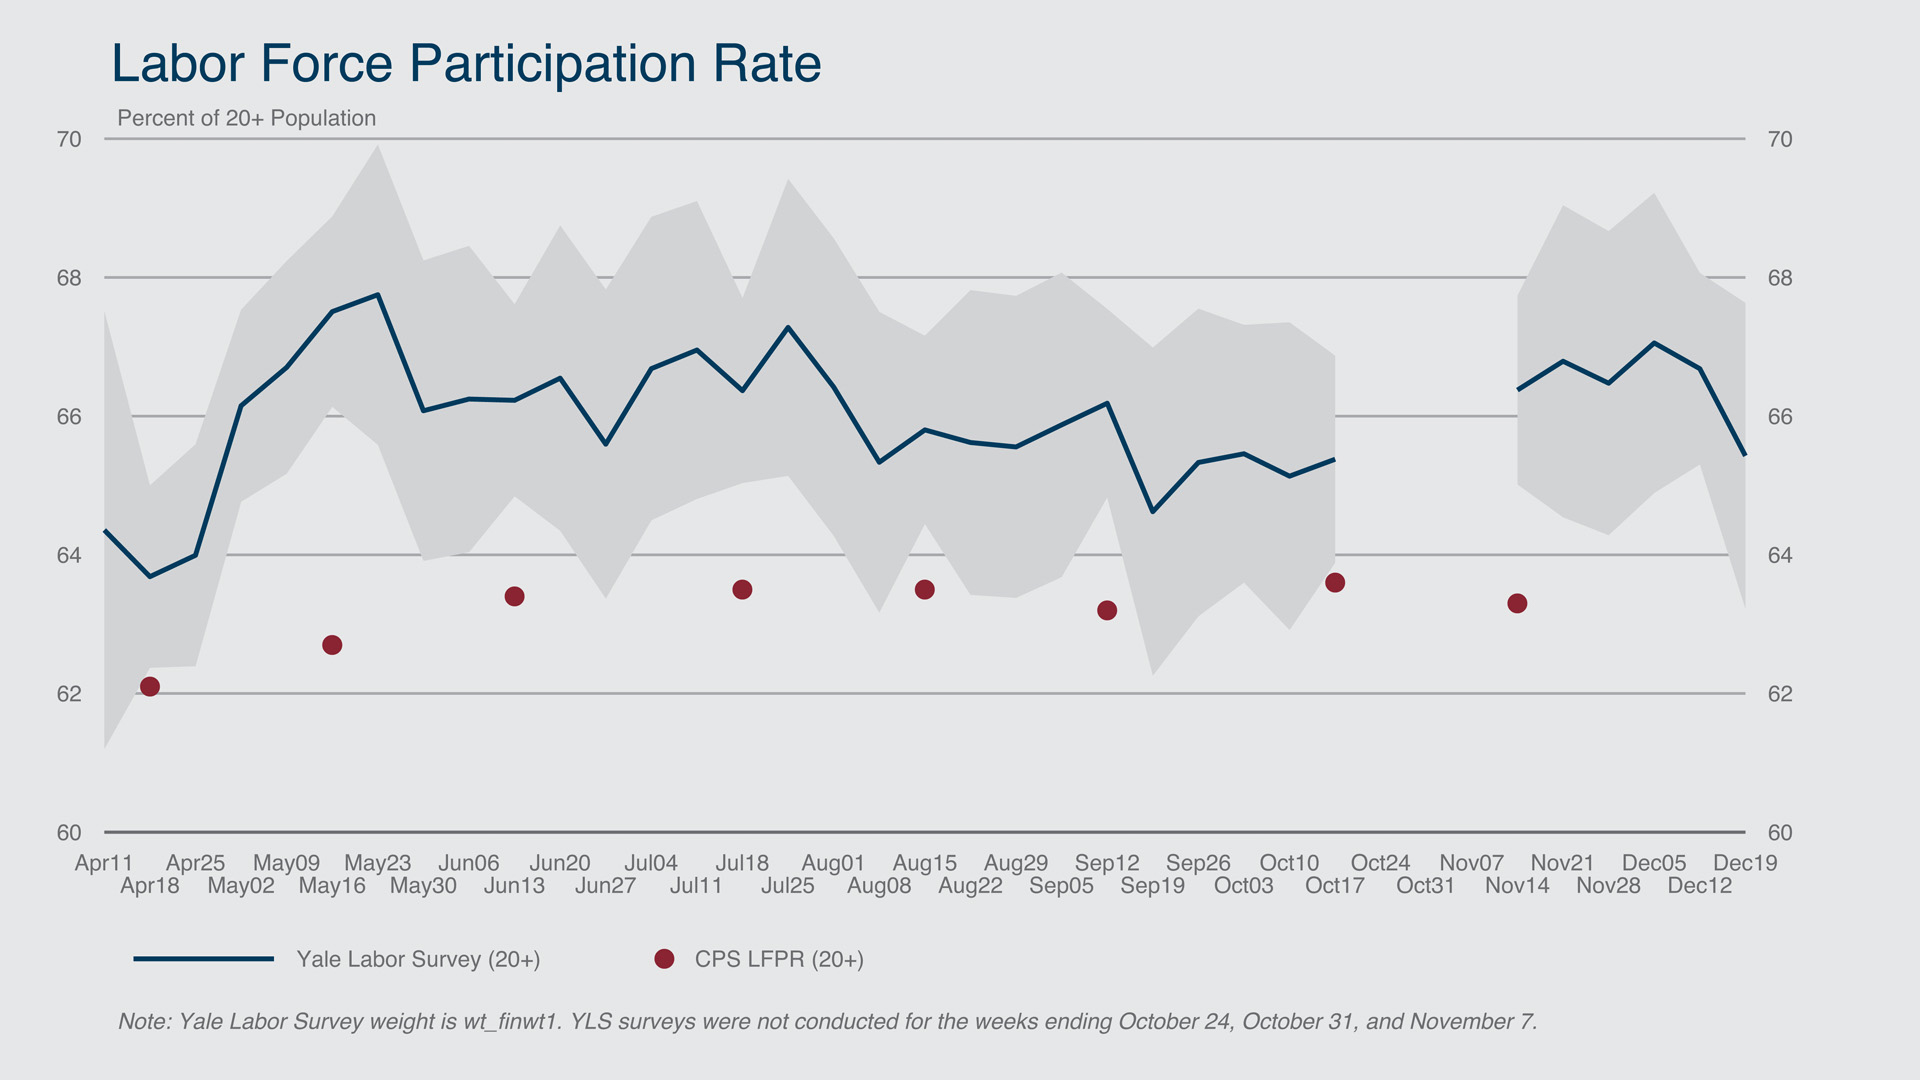
Labor Force Participation Rate
As of the week of December 19, the YLS labor force participation rate (LFPR) stood at 65.4%, down 1.3 percentage points from the previous week. Despite this decline, the YLS participation rate remains much higher than the corresponding participation rate in the CPS. This difference between YLS and CPS participation rates explains most of the gap between the unemployment rates in the two surveys over the last several months. The source of these differences is an active area of research for the YLS team.
Federal Reserve Bank of Boston
 collapse all
 expand all