July 2013: Top Challenges 

Peter Davis/Federal Reserve Bank of Boston


Availability of Employment Opportunities

Source: BLS
Data as of
December 2012
"About two-thirds of all job losses in the recession were in middle-wage occupations--such as manufacturing, skilled construction, and office administration jobs--but these occupations have accounted for less than one-fourth of the job growth during the recovery … By contrast, lower-wage occupations, such as retail sales, food service, and other lower-paying service jobs, accounted for only one-fifth of job losses during the recession but more than one-half of total job gains during the recovery.”
— Governor Sarah Bloom Raskin, Aspects of Inequality in the Recent Business Cycle At the “Building a Financial Structure for a More Stable and Equitable Economy,” 22nd Annual Human P. Minsky Conference on the State of the U.S. and World Economies, New York, New York, April 18, 2013
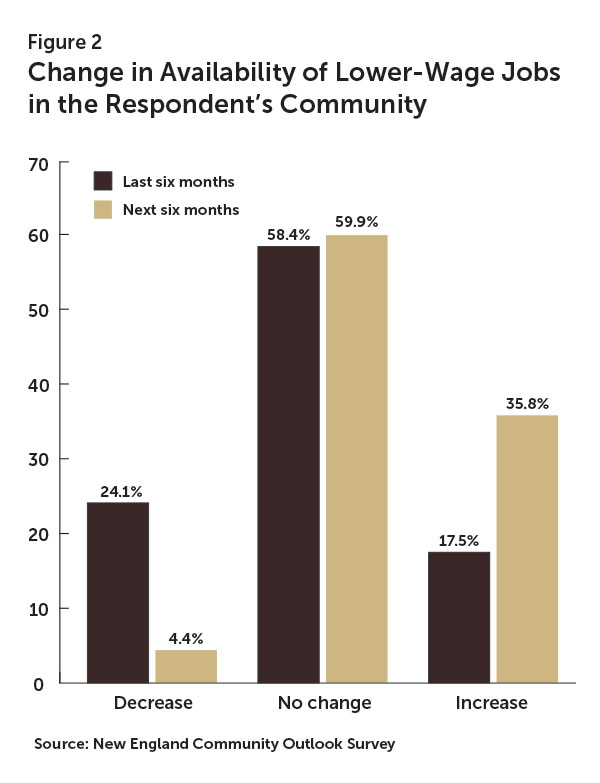
During the most recent presidential election, the country eagerly anticipated the monthly Bureau of Labor Statistics (BLS) jobs numbers. Employment, then as now, was at the forefront of everyone’s minds. As part of the New England Community Outlook Survey, the Federal Reserve Bank of Boston asked service providers about the availability of lower-wage jobs in theirservice areas. More than half of the respondents thought that the availability of lower-wage jobs had not changed in the past six months. (Figure 2) There was some optimism about the future; however, the general feeling was that the status quo would continue. So what does the status quo for lower-wage employment environment look like? Turning first to the overall employment picture, Chart 1 shows that New England is still recovering from the recession that began in 2007. Job numbers have not reached prerecession levels, and in fact, Connecticut has continued to shed jobs throughout the recovery.
Chart 1
Job Gains/Losses in New England States
| 2007-2009 | 2009-2012 | Net Jobs 2007-2012 | |
| CT | -38,396 | -12,923 | -51,319 |
| ME | -29,120 | 16,863 | -12,257 |
| MA | -123,871 | 85,696 | -38,175 |
| NH | -26,424 | 12,650 | -13,774 |
| RI | -37,235 | 5,485 | -31,750 |
| VT | -7,254 | 5,157 | -2,097 |
| Total | -262,300 | 112,928 | -149,372 |
Source: Bureau of Labor Statistics
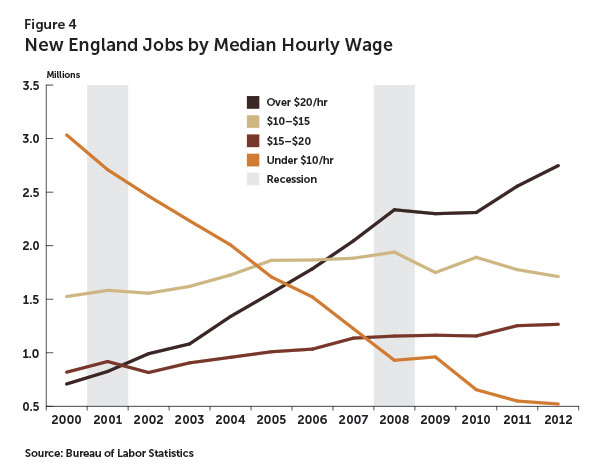
As Governor Raskin noted, the recovery has not been shared equally across all regions and sectors. The country has seen the number of low-wage jobs increase more than middle-wage jobs during the recovery. In contrast, New England has seen a constant decline in the number of jobs in low-wage categories (Figure 3 and Figure 4 ) New England continues to add jobs in high-wage categories, but many of these jobs remain out of reach of those who once held lower-wage jobs, in part because such workers lack education or training.Compared with the country, much of New England may have been spared the worst of the recession in terms of job losses and unemployment. According to data from the Bureau of Labor Statistics, those at the bottom of the wage ladder were hurt most. Sixty percent of the survey respondents indicated that in the next six months, they expected little change in the availability of lower-wage jobs. Survey respondents are more optimistic about lower-wage job availability over the next few months relative to the past six months. The data in Figure 3 and Figure 4 suggest that any employment gains may represent a blip in an overwhelmingly downward trend that began before the most recent recession and has continued unabated throughout.
For the purposes of this report, low-wage professions are those with a median wage of less than $10/hr, while high-wage professions are those that report a median hourly income of greater than $20/hr. All wages are in 2012 dollars.
Access to Affordable Housing
Access to affordable housing was ranked high by survey respondents, sandwiched between employment and federal and state budget concerns. Although affordable housing organizations are over-sampled in the survey, only half of the affordable housing organizations indicated that affordable housing was a major issue. (Chart 2) In fact, housing organizations, like other respondents in the survey, saw employment and budget cuts (state, local, and federal combined) as more important challenges facing lower-income communities than the availability of affordable housing.
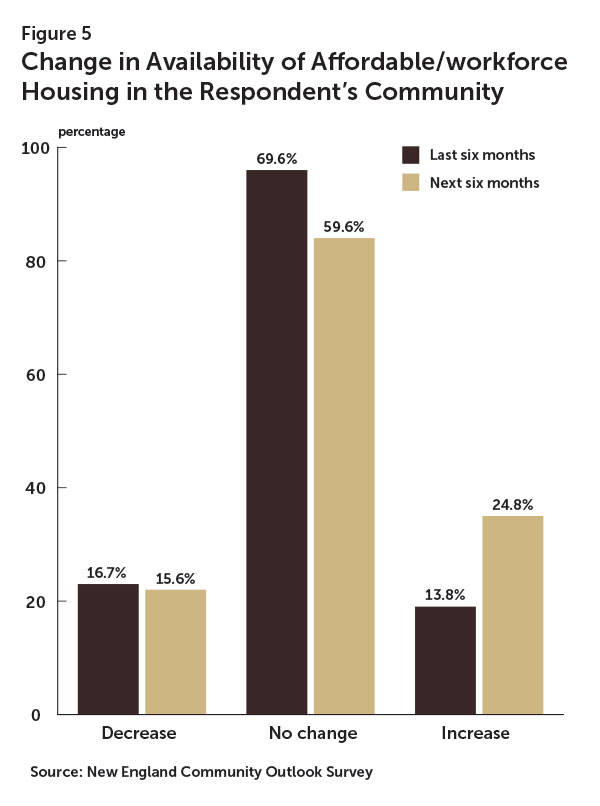
When asked specifically about availability of affordable housing, the majority of respondents noted no change over the past six months. While slightly more respondents see the affordable housing situation improving in the next six months compared to the past six months, the majority anticipate further stagnation in their communities. (Figure 5)
Chart 2
What Concerns Service Providers in the Affordable Housing Sector
| Federal, state, and local budget cuts | 69.8% |
| Availability of employment opportunities | 51.2% |
| Access to affordable housing | 48.8% |
| K - 12 education | 18.6% |
| Increasing homelessness | 16.3% |
| Negative impact of vacant properties | 14.0% |
| Prevalence of crime/Public safety | 9.3% |
| Adult workforce development programs | 7.0% |
| Home foreclosures | 7.0% |
| Predatory and/or fraudulent financial services | 4.7% |
| Access to nonpredatory mortgage lending | 4.7% |
| Access to small business loans | 2.3% |
| Access to higher education | 2.3% |
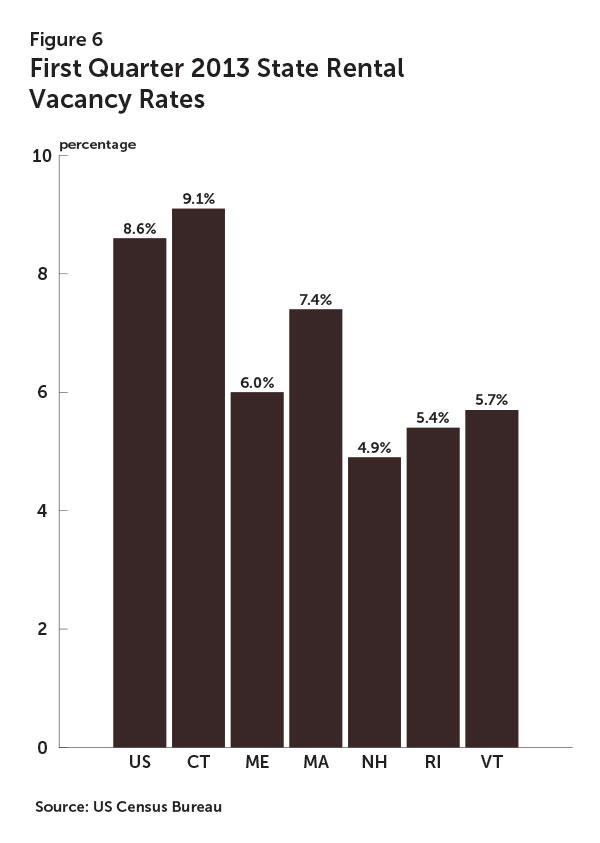
According to the census, with the exception of Connecticut, the New England states all have lower rental vacancy rates than the national rate. (Figure 6)
Drilling down into the major metropolitan areas of New England, the disjointed recovery is reflected in the different unemployment rates, ranging from a low of 3.4% in Burlington, VT, to a high of over 15% in Hartford. (Chart 3) With such high unemployment and relatively low median incomes in many of the major metropolitan areas, rents and housing costs may be driven down. Rents remained relatively stable in the period from 2009 to 2011, with few areas’ rents rising more than 3% in total. A couple cities actually saw median rents fall in the period from 2009 to 2011. In other New England cities, like Providence, RI, the unemployment rate, as of March 2013, has yet to fall below 10%. The median income trails the nation’s by almost $14,000, and the housing and rental costs exceed those nationally.
The survey respondents expected little change in the availability of affordable housing over the next six months. High unemployment and high housing costs in many New England cities make them unaffordable for many lower-income residents, and limited increase in availability of affordable housing is expected in the next six months.
Chart 3
General Housing/Demographic Characteristics of Major Cities in New England
| City | Population | Median income | Unemployment rate 03/13 | Median monthly housing cost | Median rent 2011 | Rent change 2009-2011 |
| Boston, MA | 609,942 | $51,739 | 5.8% | $1,393 | $1,238 | 1.7% |
| Worcester, MA | 180,519 | $45,846 | 7.9% | $1,045 | $886 | 0.3% |
| Providence, RI | 178,130 | $38,922 | 11.0% | $1,044 | $913 | -1.8% |
| Springfield, MA | 152,992 | $35,603 | 10.7% | $905 | $756 | 0.9% |
| Bridgeport, CT | 143,412 | $40,947 | 12.5% | $1,192 | $1,032 | 1.2% |
| New Haven, CT | 129,213 | $39,094 | 11.6% | $1,170 | $1,055 | 2.6% |
| Hartford, CT | 124,817 | $29,107 | 15.1% | $917 | $837 | 3.0% |
| Stamford, CT | 121,784 | $78,201 | 7.0% | $1,804 | $1,503 | 1.6% |
| Waterbury, CT | 110,075 | $41,499 | 13.1% | $1,029 | $881 | 0.8% |
| Manchester, NH | 109,736 | $53,278 | 6.4% | $1,131 | $963 | -2.2% |
| Portland, ME | 66,240 | $45,153 | 5.6% | $1,028 | $873 | 0.3% |
| Burlington, VT | 42,192 | $41,024 | 3.4% | $1,096 | $965 | 3.1% |
Sources: Bureau of Labor Statistics, US Census, and American Community Survey 2011.
Sequestration & Federal Budget Cuts

Source: OMB.
“…at Portsmouth Naval Shipyard, the Navy is prepared to cut the pay of its civilian workforce by 20 percent, the result of a 22-day furlough …These jobs are not just a count of government billets, a macroeconomic statistic, or an unemployment rate fluctuation. These jobs provide financial security for our constituents and health insurance for their families.”
—Senator Susan Collins (R-ME), February 20, 2013 News Release
The most recent federal budget sequester cut funds to both defense and non-defense spending. New England, with its high concentration of defense contractors, such as the naval shipyard in Kittery, ME, will likely feel the effects of the sequestration for years to come. The New England Community Outlook Survey asked a series of questions about policy challenges to communities and the funding and capacity of respondents’ organizations. For each of these questions, respondents pointed to the sequester as a major issue that directly affects lower-income communities through job loss and said that it negatively impacts the organizations that provide much-needed services to the communities.
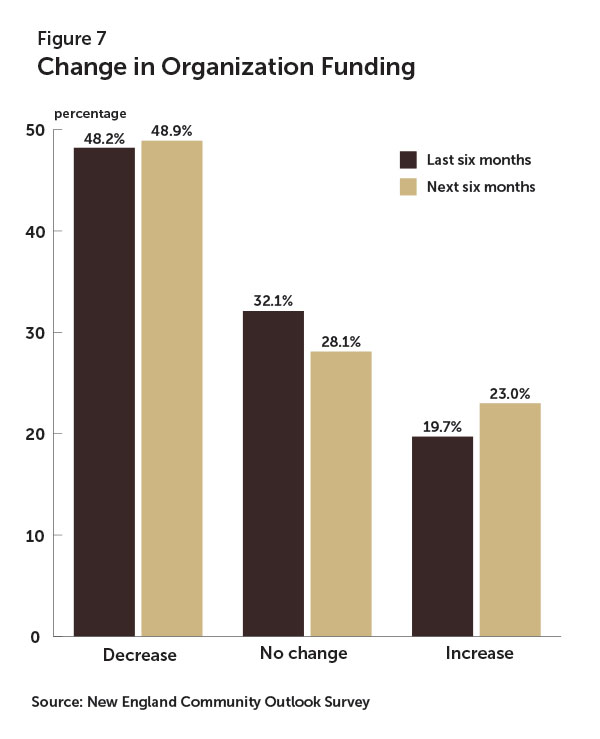
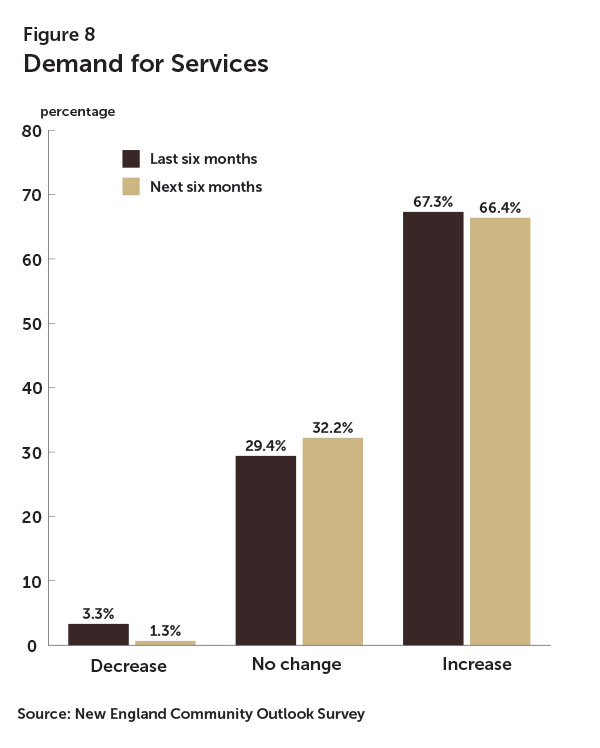
Just under half of the New England Community Outlook Survey respondents indicated there were specific policy challenges preventing them from fulfilling their mission. Of those that responded affirmatively, 65% specifically mentioned the sequester, budget issues, or lack of funding. Twenty-one respondents, about 13%, specifically mentioned the word sequester or sequestration in one of their open-ended survey responses. One-third not only saw their funding decrease in the previous six months but also expect funding to continue to decrease over the next six months. (Figure 7) At the same time, more than two-thirds of service providers saw the demand for their services increase and almost the same number expect demand to continue to rise in the next six months. (Figure 8) Amid the funding decline and increased demand, somehow service providers are finding ways to do more with less, with 78% of service providers reporting either unchanged or increased capacity over the past six months, and 69% expecting to maintain or increase capacity over the next six months. (Figure 9) But not every organization is likely to be able to do more with less in light of the dramatic cuts. According to the White House Office of Management and Budget, programs ranging from those supported by nutrition assistance funding to those supported by educational funding will be subject to severe budget cuts because of the sequester. In Maine, the Department of Education estimates the sequester will strip $7.3 million from its budget, with its special education and programs for low-income students being the hardest hit, losing $2.8 million and $2.6 million respectively.
Concerns about the sequester go beyond the financial shortfalls, with several service providers mentioning that along with less funding, less certainty about future budgets make it difficult to plan for the future. According to respondents, between cuts to service providers and direct losses of jobs, it appears the sequester hits lower-income communities the hardest.
Maine Department of Education, “Sequestration of Federal Funds Anticipated March 1,” http://mainedoenews.net/2013/02/27/sequestration-of-federal-funds-will-go-into-effect-march-1.
Conclusion
“While employment and housing show signs of improving for the nation as a whole, conditions in lower-income neighborhoods remain difficult by many measures.”
Chairman Ben Bernanke, Creating Resilient Communities At the "Resilience and Rebuilding for Low-Income Communities: Research to Inform Policy and Practice," Federal Reserve System Community Affairs Research Conference, Washington, DC, April 12, 2013
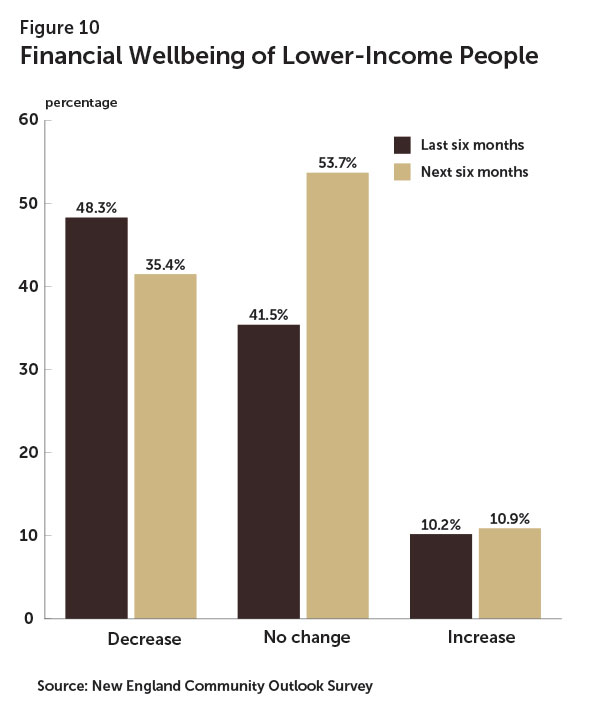
This recovery has been slow for New England’s lower-income communities, which are yet to realize the same rate of recovery as more affluent ones. Four years into the recovery, service providers continue to see no change or a decrease in their clients’ financial well-being. (Figure 10) While the United States manages a difficult and at times sluggish economic recovery, New England’s lower-income communities continue to shed low-wage jobs. Their residents are unable to secure higher paying jobs, most likely because of a lack of education or training. If this trend continues, it ensures further income disparities, which economists and service providers alike suggest lead to additional long-term negative effects on the social and economic well-being of the region. The housing market has been a focal point of the recovery, and recent reports appear cautiously optimistic about its recovery. Like the job market, housing has been slow to rebound and service providers seem largely neutral or pessimistic about availability of affordable housing. In fact, the very nature of the housing recovery entails rising home prices, which may indicate economic strength but could put good-quality, affordable housing even further out of reach for low-income residents.
This economic recovery has been a story of two recoveries, a positive one for New England’s middle- and upper-income communities and a very different recovery for those in the moderate- and lower-income brackets. The New England Community Outlook Survey will continue to ask service providers to help us understand how lower-income communities in New England are faring and how the Federal Reserve Bank of Boston can provide insight on the issues.
About the Survey
The New England Community Outlook Survey is a survey of service providers’ perceptions of the economic and financial conditions of lower-income communities and individuals in New England and the organizations that serve them.
Changes to the New England Community Outlook Survey
In late 2012, the Federal Reserve Bank of Boston’s Community Development Unit worked with an outside consultant to assess the quality of the information it assembles in the New England Community Outlook Survey and how the information is used by the Federal Reserve Bank of Boston and external organizations. The evaluation proved extremely informative, prompting changes to the survey instrument as well as to the reports. The survey’s frequency has been reduced from quarterly to semiannually, with surveys in April and October. The change was made based on information gathered during the evaluation, which suggests that circumstances do not change enough at the quarterly frequency to justify a quarterly survey. The report will continue to cover a broad array of topics while offering more in-depth focus on issues that resonate broadly with survey respondents. The report also includes more firsthand information from lower-income communities and compares the data to publicly available state, region, and national data. Readers will see an increase in the use of charts, maps, and infographics. Lastly, where appropriate, the Community Development Unit aims to supplement and triangulate survey results with additional information gathered by practitioners and policymakers: from interviews, focus groups, regional convenings, and the like.
The Federal Reserve Bank of Boston will continue to position the New England Community Outlook Survey as a leading indicator on the status and well-being of New England’s lower-income communities. We will build on the survey’s history as a source for reliable data and maintain its focus on identifying what practitioners know that can resonate broadly throughout New England and the Federal Reserve System.
The Federal Reserve Bank of Boston would like to thank all who helped improve the New England Community Outlook Survey and would appreciate any feedback at anthony.poore@bos.frb.org.
Methodology
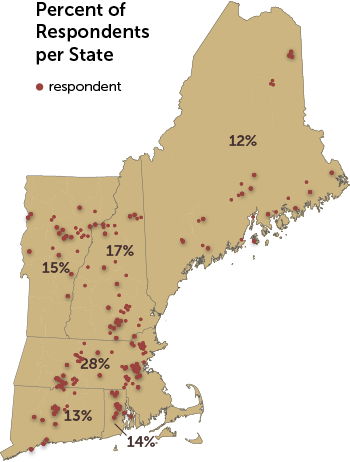
In January 2011, the Federal Reserve Bank of Boston launched the first New England Community Outlook Survey. The respondents represented organizations providing direct services to lower-income households. Organizations were asked to designate one senior staff member to respond to the six-minute survey. For the latest iteration of the survey, 157 service providers from the economic development, affordable housing, community action, human services, and workforce development sectors in each of the six New England states responded to 22 multiple-choice and fill-in questions. We asked respondents to comment on the changes in conditions over the previous six months and to project changes over the next six months. Respondents completed the survey between April 9 and April 29, 2013. Data collected represent the opinions of service providers who completed the survey. While we strive to include a reasonably representative sample in our survey, responses should not be interpreted to represent the opinions of all service providers in New England.
Federal Reserve Bank of Boston
10 images

 About the Authors
Anthony S Poore
Kaili Mauricio