August 2014: Top Challenges 

Peter Davis/Federal Reserve Bank of Boston


About the Survey
During April 2014, the Federal Reserve Bank of Boston conducted its semiannual New England Community Outlook Survey. The survey covered topics ranging from the availability of credit for small businesses to emerging issues facing lower-income communities; this time the survey also included three questions specific to issues affecting suburban lower-income communities.
New England’s population is split between rural areas, small metropolitan areas, urban centers, and suburban areas surrounding the urban centers. In the past, due to the urban bias of respondents, many New England Community Outlook Survey reports focused on the lower- and moderate-income urban experience. In January 2014, the survey was revised somewhat to shed light on the challenges facing New England’s rural communities, and this report focuses on low- and moderate-income households that till now haven’t been widely acknowledged as living within New England’s suburban communities.
In April, survey participants were asked three new questions: what proportion of their service communities are suburban, what are the top challenges facing lower-income suburban communities, and an open-ended question solicited input about what other challenges are facing these communities. The responses to these three questions were the primary sources of information for this report.
Respondents indicated that the top challenges specific to lower-income suburban communities were availability of jobs and high transportation costs. Given the slow economic recovery, concerns about the availability of jobs was not unexpected. However, less anticipated was that 80% of the respondents ranked higher transportation costs as either a moderate or very important challenge.
The open-ended question about other challenges elicited the following from respondents: Affordable housing was seen as an issue of great concern. And here again highlighted as top issues were transportation and jobs. Ranked closely as key concerns were the cost of childcare and the cost of healthcare.
With much of its population dispersed among the largest cities, Connecticut presents a unique opportunity to examine a largely suburban state with a relatively high median family income, in which many low-income families seemingly “are lost in the suburbs.” This report tries to shine some light on those families and their challenges in order to raise awareness among our readers of low- and moderate-income families living within New England’s suburban communities, as a whole.
Top Challenges Facing Lower-Income Communities
– Survey Respondent
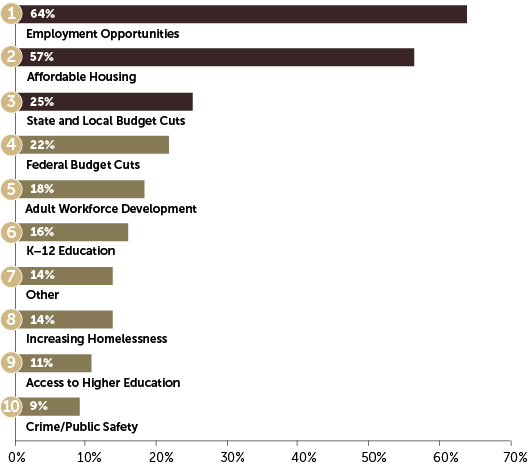
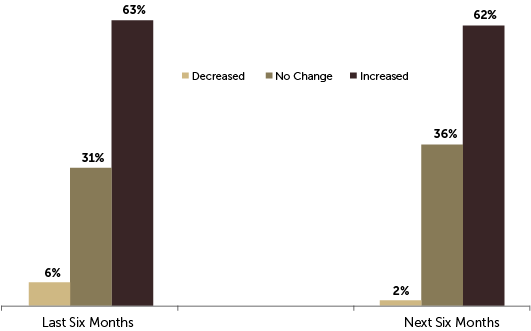
Survey respondents were asked to rank the top challenges facing lower-income communities. They ranked job availability, access to affordable housing, federal and state budget cuts, and adult workforce development as the top five challenges for the six months covering October 2013 to February 2014. The same top four challenges were cited in the previous six-month period (May 2013 to October 2013.) Crime and access to higher education replaced home foreclosures and credit scores in the list of top 10 challenges. (Figure 1)
“Housing is a major economic driver and indicator of economic success, but in state government housing is not "at the table" in representation like education, transportation, infrastructure, job development, etc.”
– Survey Respondent
Figure 1
New England Community Outlook Survey, April 2014
“Where people live influences the kinds of educational and economic opportunities and the range of public services available to them, as well as what barriers to accessing those opportunities may exist.”
– Elizabeth Kneebone, Brookings Institution.[1]
Hidden Struggles and Costs in the Connecticut Suburbs
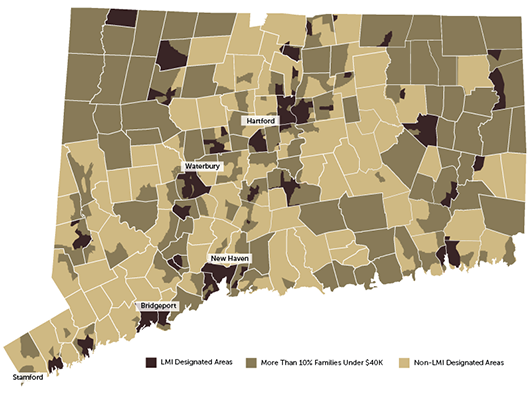
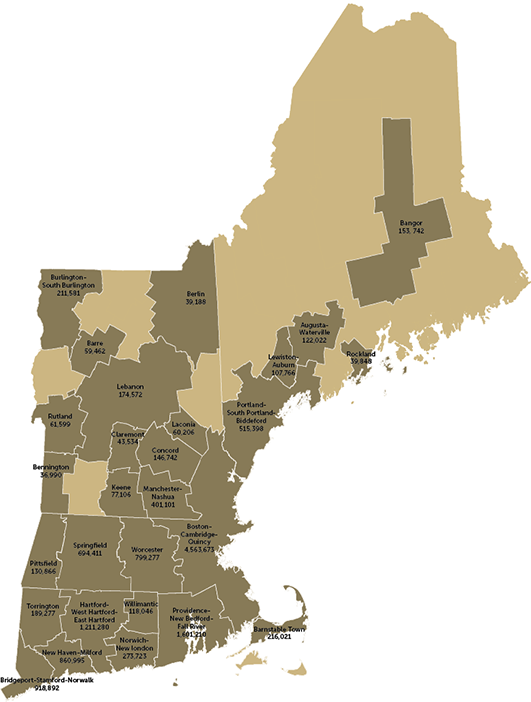
This report focuses on two specific metropolitan areas in Connecticut: Hartford and New Haven. However, the challenges described could apply to any suburban neighborhood in New England. (The share of suburban[2] populations differs among the six New England states.) In Connecticut, 69 percent of the population lives in suburban census tracts—almost 2.5 million people and 641,000 families. Using traditional U.S. Census and U.S. Department of Housing and Urban Development (HUD) thresholds, an estimated 236,000 families live in lower-income (LMI) areas[3] in Connecticut. (Figure 2)
"Do more with less" can no longer be a policy stance that is taken seriously. As it is said, only the first and last words of the phrase ring true. Evaluate the efficacy of programs and focus on the administrative overhead of public institutions. Not to cut the programs, but to see which have already been cut to the point that to cut further would fundamentally destabilize their operations.” – Survey Respondent
Figure 2
U.S. Census Bureau, 2012 American Community Survey 5-Year Estimates, Community Outlook Survey author’s calculations.
What happens to the lower-income families that do not live in the LMI–designated tracts? Many struggling families in the suburbs of Connecticut and many other states live in non-LMI–designated neighborhoods that are replete with wealth, but devoid of the social service networks offered to urban families in need. Looking for LMI families in only LMI neighborhoods overlooks a large portion of the families in need. Using a conservative estimate that limits lower-income families to those having a median family income below $40,000 (less than half the median family income in the state); there are 181,000 lower-income families in Connecticut. Of these 181,000 families, 100,000 live in officially designated LMI tracts, leaving 81,000 families in Connecticut living outside LMI tracts on less than $40,000 a year. These families live a markedly different economic reality in a state where 36% of census tracts have a median family income exceeding $100,000.
Federal Reserve Bank of Boston
Lower-income families do not always live in LMI tracts where they might be expected to live. Due to the limited resources of many service providers, and the continued (perceived) rise in demand, service providers tend to concentrate on service areas where low-income populations are easier to find and serve. This too often leads providers to LMI–specific tracts, often located in urban areas. Certainly on the basis of LMI tract designations, many federal programs, such as New Market Tax Credits or the Community Reinvestment Act (CRA) allocate funds or provide incentive for investment. (Figure 3, Figure 4) The focus of these programs is not so myopic as to limit development assistance solely to urban populations; the definitions used allow for rural communities as well. But they do focus assistance on areas where the vulnerable communities are the most concentrated. This resource distribution—while optimal for impact—drains away resources from the families who may live in more affluent, often suburban, neighborhoods. Connecticut is dominated by tracts where more than 10% of the families have incomes under $40,000. In relatively wealthy states like Connecticut with highly concentrated LMI–designated areas, suburban lower-income families reside outside the familiar service areas of respondents to this survey, and so the families may be more or less “hidden” within these higher income neighborhoods. Such neighborhoods are relatively bereft of support networks and services that focus on low-and moderate-income families living in their midst. (Figure 5)
“Without quality employment, issues of credit repair, predatory financial practices and affordable housing become moot. When workforce development is linked with higher wage occupations, an opportunity is presented to address educational needs related to such issues for and with the low-income community residents in a meaningful manner. It is not possible to escape a vicious circle of poverty related social issues without a viable path to provide for families.” – Survey Respondent
Figure 3
New England Community Outlook Survey, April 2014
Figure 4
New England Community Outlook Survey, April 2014
Figure 5
Federal Financial Institutions Examination Council (FFIEC) Tract Income Levels 2013 and 2012 U.S. Census Bureau, American Community Survey, “2012 American Community Survey 5-Year Estimates.”
Lower-income families embedded in higher-income tracts face more challenges than just a dearth of support services. The often higher costs of daily activities, easily borne by the area’s higher income residents, can place significant burden on LMI families living in the areas. Such costs may be direct costs, like higher housing costs or the higher cost of services like childcare. Or the costs may be indirect, like more time spent commuting or searching for a job that is convenient to their home. These challenges only grow worse in the suburbs, where social support is even thinner, jobs are scarcer, and basic needs like groceries and healthcare require access to a car or reliance on suburban forms of public transportation.
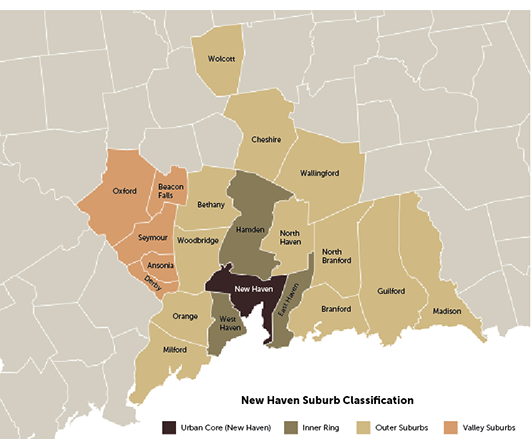
Figure 6
Federal Reserve Bank of Boston
New Haven
Poverty Dynamics across Suburban Geographies
While much of the literature on Connecticut’s burgeoning suburbanization of poverty focuses on people with incomes below the Federal Poverty Line (FPL), this universal metric fails to capture a significant proportion of the state’s suburbanites whose earnings are above the FPL but still inadequate to cover the high costs of suburban living. The burdens of such “hidden poverty” threaten the long-term economic well-being of the affected families because they continue to be overlooked by policymakers at all government levels. One particularly heavy burden identified by a number of Community Outlook Survey respondents is the lack of affordable, quality childcare for lower-income parents in suburban communities. Using the Greater New Haven region as a case study (Figure 6), the aim of the following analysis is threefold: (1) to show the magnitude and diversity of suburban poverty using the FPL and more contextualized income limits; (2) to examine the cost, availability, and use of childcare outside of the major cities; and (3) to highlight the potential impacts of costly childcare on local school systems and the economic competitiveness of the region as a whole. By illuminating some characteristics and key challenges of the families comprising the hidden poor, the next few paragraphs begin to paint a more nuanced picture of Connecticut’s suburbs and their questionable promise of an American Dream accessible to all.A Tale of Two Types of Hidden Poverty
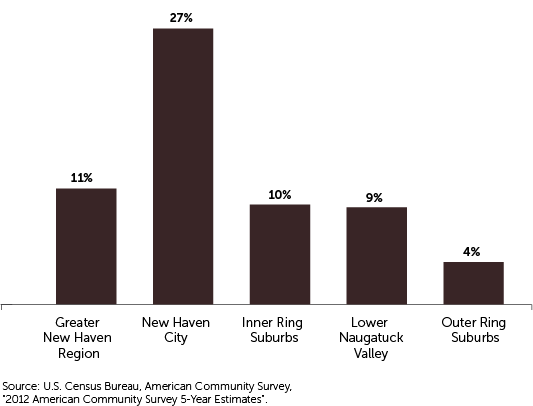
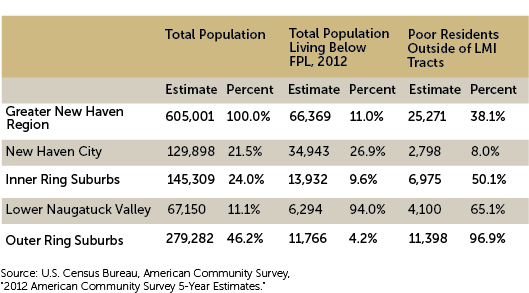
Connecticut’s suburbs seem to be grappling with two kinds of hidden poverty. The first type to be addressed in this analysis is poverty that is quantified by official census statistics (using the 2012 FPL set at $11,700) but that becomes almost indiscernible in certain types of suburban areas. The Greater New Haven Region illustrates this dynamic in the following way. Out of the 605,001 people living in the region’s 21 municipalities, about 11 percent (or 66,369 residents) had incomes below the poverty threshold.[4] While the City of New Haven contains about one-fifth of the region’s total population, it is home to over half of Greater New Haven’s poor inhabitants. Outside of the urban core, the remaining poor are disproportionately distributed between the inner-ring suburbs, outer-ring suburbs, and the Naugatuck Valley suburbs, with the inner-ring suburbs housing nearly 45 percent of the disadvantaged suburbanites. (Figure 7, Figure 8)“Housing costs in suburbs are far greater than in urban areas. Options and choice in suburban communities is often limited due to the fact there is very little rental and no affordable rental in these types of communities. Affordable rental housing tends to be concentrated in urban areas. – Survey Respondent
Figure 7
U.S. Census Bureau, American Community Survey, "2012 American Community Survey 5-Year Estimates".
“Low-income households with dual employment spouses have continued to find moderate economic stability. Any deviation from that norm, however, is becoming increasingly costly to a household's wellbeing…” – Survey Respondent
Figure 8
U.S. Census Bureau, American Community Survey, “2012 American Community Survey 5-Year Estimates.”
“Cities such as ours are increasingly becoming isolated concentrations of poverty in an otherwise affluent state - segregated by race, ethnicity, low educational and skill levels and income.” – Survey Respondent
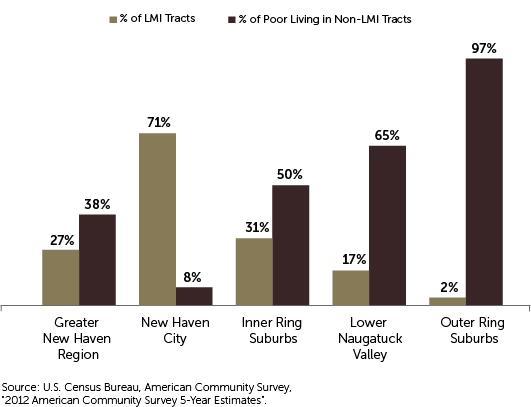
When looking at the spatial concentrations of poor suburbanites in the region, it is critical to note that a vast proportion of them (between 51–97 percent depending on the suburban area) reside outside of LMI tracts.[5] This dynamic may be partly explained by both the relatively small number of LMI–designated tracts and their uneven distribution in the region’s suburbs. Out of the 96 total census tracts in Greater New Haven (excluding the City), only 12 are LMI tracts, and 9 of them are concentrated in the inner-ring suburbs. Consequently, most of the 11,766 poor residents in the outer-ring suburbs live in non-LMI tracts. In fact, in Greater New Haven, only one outer-ring tract is classified as LMI. Over 80 percent of poor suburban households in the wealthier inner- and outer-ring suburbs of New Haven are single-parent families. Marginalized in mixed-income neighborhoods, such households—possibly in need of services—may be virtually invisible to social service providers and policymakers. (Figure 9)
Figure 9
U.S. Census Bureau, American Community Survey, “2012 American Community Survey 5-Year Estimates.”
A second type of poverty in the suburbs represents a proportion of families with an income above 200 percent of the poverty line, which is barely sufficient to cover the uncommonly high cost of living and raising kids in this geography. Drawing on this theme, Connecticut’s Wider Opportunities for Women (WOW) created the Basic Economic Security Tables (BEST) to tabulate the minimum income figures[6] that would allow various types of families (in various regions) to pay for basic needs and develop financial stability. According to the 2012 tables, a family of dual earners with employment benefits and no kids required an annual income of $49,464 (or $60, 840 for workers without employment benefits) to afford both paying for basic essentials and saving a few hundred dollars for emergencies and retirement. For the same family to afford to raise an infant, its income would need to increase by over $21,000 to account for child care, a larger apartment, healthcare expenses, etc.[7]
Despite the high cost of having only one small child under the age of 6, a Connecticut family is initially eligible to qualify for subsidized daycare from the State if its income is below 50 percent of the state family median income, which is $42,893 for a three-person family or $51,063 for a four-person family in 2012.[8] The same eligibility criteria are used for many other child assistance programs, including subsidized lunch, and after-school programs. In the case of Greater New Haven, about 23,600 families with children earn too much to qualify for government assistance but earn too little to afford quality childcare and other child-related expenses. About 45 percent of these struggling families live in one of the three inner-ring suburbs, 30 percent in the Valley area, and the rest reside in one of the 12 outer-ring suburbs.
The Challenges of Being a Suburban Lower-income Parent
One of the major findings of the aforementioned 2012 WOW report is that “the high cost of quality childcare is the greatest threat to family security in many parts of Connecticut.” According to this study, for families with more than one child, the cost of licensed daycare arrangements becomes the greatest expense they have to worry about each month. It is not uncommon for one parent to drop out of the labor force in order to care for a child. This reality is reflected in the economic data for suburban New Haven: about 72 percent of kids, aged 0–5, have all parents participating in the labor force, and this figure increases to 81 percent for kids, aged 6–17.[9]
According to a “Connecticut Childcare Availability and Affordability Report,” published annually by 2-1-1 Childcare (United Way of Connecticut), childcare costs do not differ markedly between the urban core and its suburbs.[10] See Figure 10, which presents the average costs of childcare for the Greater New Haven region.
“Affordable day combined with transportation costs, are the two highest barriers to employment. Educational attainment level is the highest barrier to those underemployed”. – Survey Respondent
Figure 10.
Average Childcare Cost greater New Haven
| Service Type | Average Cost |
| Infant/Toddler Center, Full Time | $253.40/week |
| Infant/Toddler Home, Full Time | $188.26/week |
| Preschool Center, Full Time | $210.65/week |
| Preschool Home, Full Time | $179.94/week |
| School-age Center | $106.01/week |
| School-age Home | $84.55/week |
A second type of poverty in the suburbs represents a proportion of families with an income above 200 percent of the poverty line, which is barely sufficient to cover the uncommonly high cost of living and raising kids in this geography. Drawing on this theme, Connecticut’s Wider Opportunities for Women (WOW) created the Basic Economic Security Tables (BEST) to tabulate the minimum income figures[6] that would allow various types of families (in various regions) to pay for basic needs and develop financial stability. According to the 2012 tables, a family of dual earners with employment benefits and no kids required an annual income of $49,464 (or $60, 840 for workers without employment benefits) to afford both paying for basic essentials and saving a few hundred dollars for emergencies and retirement. For the same family to afford to raise an infant, its income would need to increase by over $21,000 to account for child care, a larger apartment, healthcare expenses, etc.[7]
Despite the high cost of having only one small child under the age of 6, a Connecticut family is initially eligible to qualify for subsidized daycare from the State if its income is below 50 percent of the state family median income, which is $42,893 for a three-person family or $51,063 for a four-person family in 2012.[8] The same eligibility criteria are used for many other child assistance programs, including subsidized lunch, and after-school programs. In the case of Greater New Haven, about 23,600 families with children earn too much to qualify for government assistance but earn too little to afford quality childcare and other child-related expenses. About 45 percent of these struggling families live in one of the three inner-ring suburbs, 30 percent in the Valley area, and the rest reside in one of the 12 outer-ring suburbs.
The Challenges of Being a Suburban Lower-income Parent
One of the major findings of the aforementioned 2012 WOW report is that “the high cost of quality childcare is the greatest threat to family security in many parts of Connecticut.” According to this study, for families with more than one child, the cost of licensed daycare arrangements becomes the greatest expense they have to worry about each month. It is not uncommon for one parent to drop out of the labor force in order to care for a child. This reality is reflected in the economic data for suburban New Haven: about 72 percent of kids, aged 0–5, have all parents participating in the labor force, and this figure increases to 81 percent for kids, aged 6–17.[9]
According to a “Connecticut Childcare Availability and Affordability Report,” published annually by 2-1-1 Childcare (United Way of Connecticut), childcare costs do not differ markedly between the urban core and its suburbs.[10] See Figure 10, which presents the average costs of childcare for the Greater New Haven region.
Figure 11.
Preschool/Nursery Enrollment By Geography
| Estimate | Percent | |
| Greater New Haven Region | 9,185 | 69.4% |
| New Haven City | 1,914 | 58.1% |
| Inner-Ring Suburbs | 2,208 | 70.0% |
| Lower Naugatuck Valley | 1,066 | 62.2% |
| Outer-Ring Suburbs | 3,997 | 79.3% |
Does this discrepancy reflect a shortage of child care slots in the former geographies or is it a matter of affordability? According to the latest 2-1-1 Connecticut publication on child care capacity/availability/enrollment, the inner-ring and Valley daycare centers have over 90 and 210 vacant slots for infants/toddlers and preschool kids, respectively. For family-based care, which tends to be about 20 percent cheaper in this geography, the number of available preschool spots is around 230, and there are only about 110 available slots for infant/toddler care.[11] While these vacancy figures generally suggest that licensed childcare facilities are underutilized in these places, the total number of available slots would barely cover even 30 percent of the children who are not receiving licensed care.
Federal Reserve Bank of Boston
The Ramifications of Unaffordable Childcare
This analysis makes no formal attempt to establish a relationship between formal early childcare enrollment and children’s kindergarten readiness in Greater New Haven. However, it is interesting to compare each area’s preschool participation rates with the kindergarteners’ skill levels, assessed by a test at the beginning of the year.[12] It seems that kids in the inner-ring and Valley suburbs of New Haven are more than twice as likely to have scores in the lowest quartile of the distribution,[13] as compared to their outer-ring counterparts. Not only do the inner-ring and Valley municipalities have high shares of underprepared kindergarteners, but their entire local school systems also seem to be underachieving, given that five out of the 30 lowest-performing school districts in the entire state are housed in these parts of Greater New Haven.[14]
The two types of hidden poverty in Connecticut’s suburbs have serious implications for the future population growth and prosperity of the region. In a state where the population pyramid is top heavy with citizens over the age of 45, attracting young families to the state and improving the availability of affordable care for their children are critical for the state’s economy.
Hartford
Suburban Challenges
In the Hartford Metropolitan Statistical Area (MSA), over 46,000 families live on less than $40,000 a year, and of those, 28,000 are tucked away in the non-LMI suburbs, just getting by. In the April 2014 Community Outlook Survey, this idea of “just making ends meet” is mirrored in what were considered the two biggest challenges facing lower-income suburban families: lack of local employment and the higher cost of transportation (Figure 12).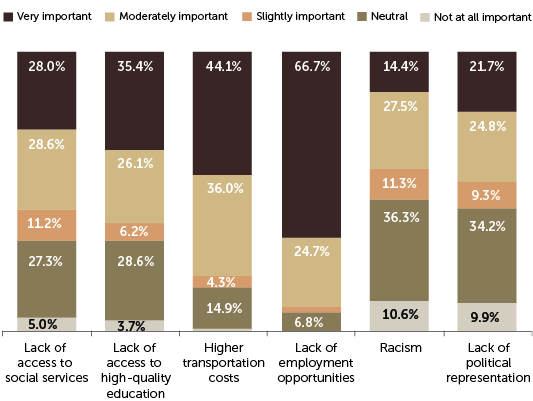
Figure 12
New England Community Outlook Survey, April 2014
In a largely suburban state, the Hartford MSA is the largest in Connecticut, covering roughly one-third of the state. Although the MSA’s central city, Hartford, is relatively small in area, its total population consists of a large suburban population. The Hartford MSA stretches from the Long Island Sound to the Massachusetts border and contains one-third of Connecticut’s population. Ninety percent of the Hartford MSA’s population lives in the suburban areas surrounding Hartford proper, and they commute to one of the towns within the MSA.
Further examination of the largely suburban MSA using data from the U.S. Department of Transportation[15] reveals more about where Hartford’s commuters come from and where they work. Sixty-eight percent of people who work in Hartford commute from the surrounding area, and due to a limited transportation infrastructure to access job centers, most workers in Hartford must drive daily to their jobs, a costly endeavor for families with limited income. This is not to say that Hartford has ignored the issue of low-income commuters in the area. An extensive bus network exists throughout the Hartford area with monthly passes costing just $54. In addition, the CTTRANSIT bus service is in the midst of building CTfastrak[16], a rapid bus-transit system between New Britain and Hartford.
The Cost of Transportation
In Connecticut, with its small-dispersed towns and underdeveloped public transportation system, many residents choose to drive and pay the costs associated with car ownership. According to the Federal Highway Administration (FHWA), from 2002 to 2012, Connecticut had the fourth highest number of licensed drivers per capita in the United States; Connecticut is a driver’s state. Suburban commuters in the Hartford MSA commute on average an estimated 25 miles per day,[17],[18] barely more than their urban counterparts who average 23 miles per day. The major difference between the two lies in the methods of transportation. Suburban commuters are 1.5 times more likely to drive alone to work, whereas urban commuters are twice as likely to carpool and nine times more likely to take public transportation than their suburban counterparts are.[19] These distances are not isolated to Connecticut commuters; both Massachusetts and Rhode Island’s suburban populations display similar statistics.
Connecticut’s car preference comes at a cost to suburban commuters. Using the Internal Revenue Service mileage rate as a conservative estimate, the cost of driving to work for one suburban driver in the Hartford MSA is around $3,500 per year. For a family with two commuters that cost could easily double. For a family with an income of $40,000, this represents at least 9% of their monthly income (Figure 13).
Figure 8 presents the budget reality many suburban commuting families face. After the estimated monthly tax withholding, a conservative estimate for food, rent, and the cost of just a single commuter, only 7% of their monthly income remains. That 7% has to account for everything from healthcare costs to utility bills and childcare. As mentioned in this report, childcare costs alone can account for much more than just 7% of low-income families’ monthly budgets. Amid all the numbers, the reality is that low- and moderate-income families survive in the suburbs, by making choices and stretching every dollar.
Figure 13.
Hartford Metropolitan Statistical Area (MSA) Estimated Monthly Budget
| Annual | Monthly |
Percent of income |
|
| Starting income | $40,000 | $3,333 | 100% |
| Federal taxes[20] | $10,000 | $833 | 25% |
| Social Security/Medicare[21] | $2,400 | $200 | 6% |
| CT State Taxes | $2,000 | $167 | 5% |
| Thrifty food plan (family of four)[22] | $6,733 | $561 | 17% |
| Fair Market Rent in Hartford MSA[23] | $12,444 | $1,037 | 31% |
| Cost of transportation[24] | $3,500 | $292 | 9% |
| Balance of income remaining for daycare, etc. | $2,923 | $244 | 7% |
Conclusion
The issues described in this report are not exhaustive representations of all the challenges lower-income suburban families face. Childcare and transportation are just two. The April 2014 New England Community Outlook Survey responses cited a plethora of suburban challenges, ranging from access to healthcare to affordable healthy food options.
In recent months, the unacknowledged struggling suburban families are emerging from anonymity. For example, in April 2014, a Boston Globe article looked at emerging food stamp usage in the gentrifying town of Bristol, Rhode Island,[25] and the New Hampshire Business Magazine devoted a cover story in June 2014, to the working poor.[26] As Figure 13 shows, each day lower-income families in the suburbs face the challenge of figuring out how to make ends meet. This report focused not only on families below the poverty threshold but also those in-the-middle families that make $40,000 or $50,000 but still cannot afford childcare or have to make sacrifices to pay for commuting to work.
New England’s suburban community economic development challenges benefit from the experience, knowledge and motivation of community organizations working within our region every day. Often the suburban populations face similar challenges to those in small towns and urban neighborhoods. While this report tried to shine some light on two of the concerns, providers throughout the area are addressing other critical issues like affordable housing and quality education in the suburbs.
The New England Community Outlook Survey will continue to ask service providers for local knowledge about how lower-income communities are faring and how the Federal Reserve Bank of Boston can provide insight.
Methodology
For the past two years, the Federal Reserve Bank of Boston has conducted the New England Community Outlook Survey. The respondents represent organizations providing direct services to lower-income households. Organizations are asked twice a year to designate a senior staff member to respond to the six-minute survey. For the latest iteration of the survey, 175 service providers from the economic development, affordable housing, community action, human services, and workforce development sectors in each of the six New England states responded to 24 multiple-choice and fill-in questions. We asked respondents to comment on the changes in conditions over the previous six months and to project changes over the next six months. Respondents completed the survey April 8–30, 2014. Data collected represent the opinions of service providers who completed the survey. While we strive to include a reasonably representative sample in our survey, responses should not be interpreted to represent the opinions of all service providers in New England.
For the purposes of this report, a methodology described in a Brookings Institution report[27] was slightly modified to determine whether census tracts were urban, suburban, small metropolitan or non-metropolitan (rural). Brookings used 2008 population data; this report uses 2012 population data. The methodology is described as follows:
“…each tract is assigned to one of three main geography types using GIS mapping software: large metropolitan areas, small metropolitan areas, and non-metropolitan communities. The U.S. Office of Management and Budget identified 366 metropolitan statistical areas (MSAs) in 2008. Large metropolitan areas include the 100 most populous based on 2008 population estimates, while the remaining 266 regions are designated as small metropolitan areas. Any tract in a county that falls outside of a metropolitan statistical area is considered non-metropolitan. Within the 100 largest metro areas, we designate primary city and suburban tracts. Primary city tracts include those with a centroid that falls within the first city in the official metropolitan statistical area name or within any other city in the MSA name with a population over 100,000.”[28]
The methodology identifies the primary cities as the 100 largest (by population) MSAs and then, using the methods described above, assigns either urban (metropolitan), suburban, small metropolitan or non-metropolitan labels to individual tracts in New England.
Figure 14
Federal Reserve Bank of Boston

 About the Authors
Anthony S Poore
Kseniya Benderskaya
Kaili Mauricio
Endnotes
S. McMahon, J. Horning, Y. Nam, and Y.S. Lee, “The Basic Economic Security Tables for Connecticut: 2012” (report, Connecticut Wider Opportunities for Women, 2012) (located at http://ctpcsw.files.wordpress.com/2012/04/basic-economic-security-tables-index-for-connecticut-2012-2.pdf).
United Way of Connecticut, 2-1-1 Childcare, “Connecticut Child Care Availability and Affordability Report,” July 2013 (located at http://www.211childcare.org/reports/2-1-1-child-care-affordability-availability-report-2013/).
United Way of Connecticut, 2-1-1 Childcare, “Annual Child Care Capacity, Availability and Enrollment Survey” (report for South Central Region), Fall 2013 (located at http://www.211childcare.org/reports/capacity/).
Data extracted from Connecticut Data Collaborative, “Kindergarten Skills Quartile Scores” 2011 (located at http://ctdata.org/weaveit-1-12422#).
Connecticut State Department of Education, “List of Alliance Districts” (located at http://www.sde.ct.gov/sde/lib/sde/pdf/alliance_districts/list_of_alliance_districts.pdf). More information on Alliance Districts is located at http://www.sde.ct.gov/sde/cwp/view.asp?a=2683&Q=334226.
Two bedrooms in the Hartford MSA. U.S. Department of Housing and Urban Development, “Fiscal Year 2013 Fair Market Rent Documentation System”(located at http://www.huduser.org/portal/datasets/fmr/fmrs/fy2013_code/2013summary40.odn?inputname=METRO25540M25540*Hartford-West+Hartford-East+Hartford,+CT+HUD+Metro+FMR+Area&force_40=yes&data=2013&year=2013).
A. Berube, W.H. Frey, A Friedhoff, E. Garr, E. Istrate, E. Kneebone, R. Puentes, A. Singer, A. Tomer, H. Wial, and J.H. Wilson, “State of Metropolitan America: On the Front Lines of Demographic Transformation” (Washington, D.C.: Brookings Institution, 2010) (located at http://www.brookings.edu/~/media/research/files/reports/2010/5/09%20metro%20america/metro_america_report1.pdf).
E. Kneebone, C. Nadeau, and A. Berube. “The Re-Emergence of Concentrated Poverty: Metropolitan Trends in the 2000s” (Washington, D.C.: Brookings Institution, November 2011) (located at http://www.brookings.edu/~/media/Files/rc/papers/2011/1103_poverty_kneebone_nadeau_berube/1103_poverty_kneebone_nadeau_berube.pdf).