August 2015: Top Challenges 

Peter Davis/Federal Reserve Bank of Boston


About the Survey
The Federal Reserve Bank of Boston conducted its semiannual New England Community Outlook Survey in April 2015. As before, the survey covered topics ranging from the availability of credit for small businesses to emerging issues facing lower-income communities. This time the survey included additional questions on workforce development, student debt and the availability of jobs in respondents' communities.
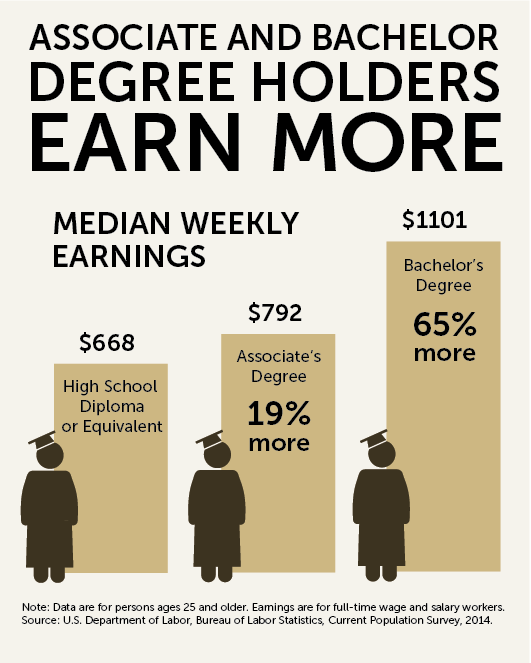
The conventional narrative leading to employment success has been to go to college, obtain a degree, and land a job with opportunities for advancement. College degree holders earn significantly higher incomes relative to high school graduates and are less likely to be unemployed (Figure 1). Over a lifetime, the earnings of college degree holders and those of high school graduates differ markedly.[1] In his 2012 report, Hout concluded that "People who pursue more education and achieve it make more money, live healthier lives, divorce less often, and contribute more to the functioning and civility of their communities than less educated people do."[2]
Having analyzed responses to the April 2015 New England Community Outlook Survey, we report here on the cost of furthering one's education and how it is paid for. Then we examine current and future job demand in New England and the skills needed for these jobs.
Figure 1.
Earnings and unemployment rates by educational attainment
|
Educational level attained |
Percent unemployment (2014) |
Median weekly earnings (2014) |
|---|---|---|
|
Doctoral degree |
2.1% |
$1,591 |
|
Professional degree |
1.9% |
$1,639 |
|
Master's degree |
2.8% |
$1,326 |
|
Bachelor's degree |
3.5% |
$1,101 |
|
Associate's degree |
4.5% |
$792 |
|
Some college, no degree |
6.0% |
$741 |
|
High school diploma |
6.0% |
$668 |
|
Less than a high school diploma |
9.0% |
$488 |
|
All workers |
5.0% |
$839 |
Note: Data are for persons ages 25 and older. Earnings are for full-time wage and salary workers.
Source: U.S. Department of Labor, Bureau of Labor Statistics, Current Population Survey, 2014
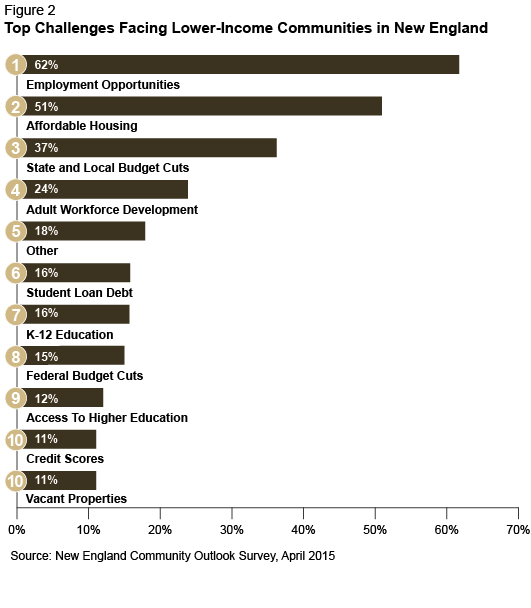
Top Challenges Facing Lower-Income Communities
Survey respondents were asked to rank the top challenges facing lower-income communities (Figure 2). They ranked job availability, access to affordable housing, and state and local budget cuts as the top three challenges. Perhaps prompted by the additional questions in this survey, student loan debt rose two spots to the sixth spot. This is the second consecutive survey in which adult workforce development has ranked in the top five. The "other challenges" category shot into the top five, as almost 6% of respondents felt that the 18 other choices did not adequately represent one of the top three challenges facing lower-income communities.
Analyzing the "other challenges" in greater detail, drug addiction was mentioned specifically by eight of the 22 respondents who chose "other challenges" as a top challenge. (See our preceding New England Community Outlook Survey report that addressed drug and alcohol dependency in New England.) In the "other challenges" category, respondents also specifically mentioned job readiness and excessive regulation of small businesses.
This is also the first time that the presence of vacant properties has been ranked among the top 10 challenges. While none of the respondents offered further details on how vacant properties represent a challenge to lower-income communities, in cities around the United States, vacant properties have led to declines in home values [3].
Figure 2
Cost of College and College Debt
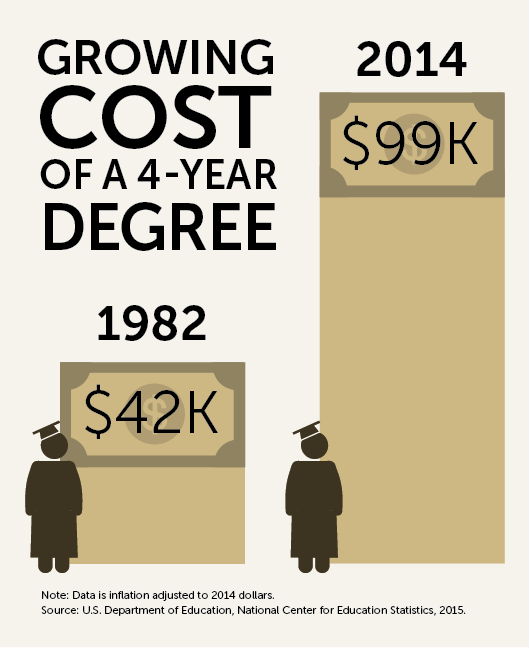
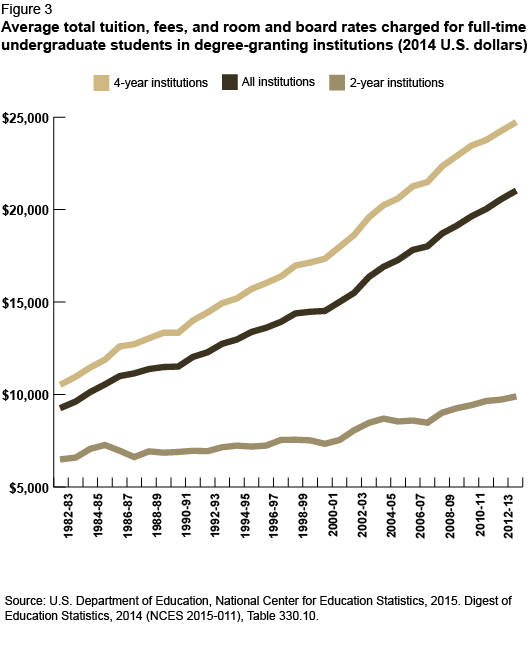
For the past few decades in the United States, the recommended pathway to success for many Americans has been obtaining a college degree in preparation for being hired into a job. Four-year college degrees have not always been mandatory, and the subsequent job may not have been in the subject areas studied, but generally the formula worked. Unforeseen by most Americans, something happened along the way: the cost of a college education has become inexorably more expensive with each passing year (Figure 3). In 1992-93, on average, it cost slightly more than $14,000 per year to attend a four-year institution.[4], [5] For a less-expensive alternative, many opted for two-year institutions that cost, on average, just under $7,000 annually. By 2014, the cost of attending a four-year institution had increased by 71% and for a two-year institution by 43%. According to a 2011 Pew Research Center poll, 75% of respondents indicated that college was "too expensive for most Americans to afford."[6]
With such high housing and transportation costs in our area, the addition of student loan debt can be significant as a continuing household debt and have a huge impact on daily purchases. —Survey Respondent
Figure 3
The cost of higher education is staggering and the debt many clients have upon graduation is significant. Often time's salaries of entry level jobs in chosen professions or launching a business does not cover the costs of the repayment, housing, transportation and other basic needs. —Survey Respondent
The ways in which students have been paying for their education has evolved; today they primarily are relying on student debt. The Federal Reserve Bank of New York [7] reports that in the first quarter of 2015, there was $1.19 trillion in student loan debt in the United States. This figure is up from $260 billion just 10 years earlier—an increase of over 300%. Admittedly, this rise in the rate of debt burden may partly reflect the availability of efficiently priced post-secondary educational borrowing without which pursuing higher education would not be possible for many. Nonetheless, the rapid growth in the magnitude of student debt warrants examination, since it is unprecedented in recent history.
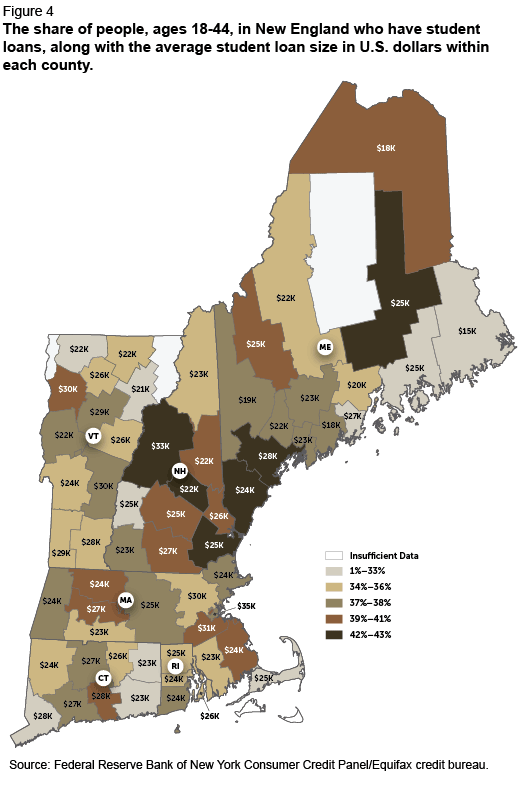
Figure 4
"…carrying the debt and paying it down reduces the flexibility in young adult's finances. It also limits the use of resources. So, we see students living at home in order to cover auto and student loan debt. Young adults defer the purchase of a first home. Prudent choices are being made but they are limiting overall economic development." —Survey Respondent
We asked our respondents a few questions about how student debt affects the lower-income communities they serve. The survey began with a question about how the daily expenses of their constituencies are affected. Respondents were split down the middle on whether student loans impacted their clients'/constituents' ability to purchase daily necessities. However, 70% of survey respondents felt that the burden of student debt does affect the timing of financial decisions such as buying a home or car. The most common life event mentioned by respondents was delaying the purchase of a home, perhaps a consequence of the fairly rigid formulas lenders adhere to regarding existing debt and loan amounts carried by a prospective buyer. A 2014 report by the Federal Reserve Bank of Boston [9]corroborates our survey respondents' assumptions, noting that "having student debt outstanding is associated with a lower rate of homeownership as well as with lower wealth holdings." The majority of student debt is held by people under the age of 45. [10]
Despite the ramifications for home ownership, a 2011 Pew Research Center poll [11] that had asked individuals about their college experience found that, among the general population, 86% of college graduates said that college was a good investment.
Relevant to any assessment of the interaction between college debt burden and the ultimate attainment of a college degree are those students who start down the college path but never finish. On the basis of 2013 U.S. Census data, it is estimated that one out of every five persons, ages 25-34, [12] has enrolled in and attended college courses but has not earned a diploma. Such individuals may be paying off student loans, while lacking the increased income associated with actually earning a college degree.
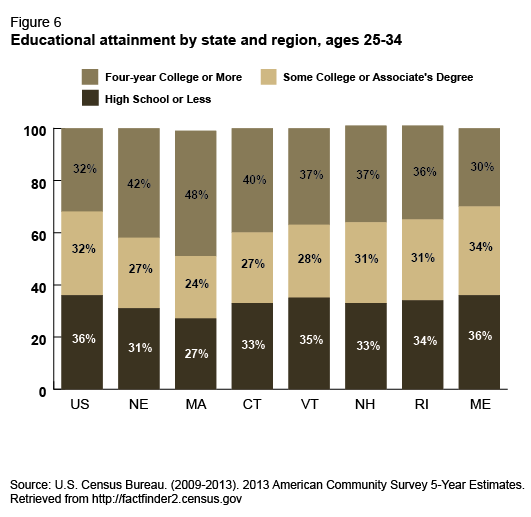
By the age of 25, almost 70% of New England residents have tried to go to college (Figure 5). Most succeed in obtaining a degree, but around 30% of those who try have not graduated by the age of 34 and have only attained some college education. As Figure 1 above shows, each step towards a more advanced degree improves a person's median salary level and decreases the unemployment rate. This is true even for those who only attain some college education or earn an associate's degree (Figure 6).
Figure 5.
Educational attainment by state and region, ages 25-34
|
Less than 9th Grade |
Incomplete |
High School or |
Some College |
Associate's |
College |
Graduate |
|
|---|---|---|---|---|---|---|---|
|
United States |
4.0% |
8.1% |
24.1% |
23.3% |
8.5% |
22.5% |
9.5% |
|
New England |
2.4% |
5.6% |
22.8% |
19.5% |
7.3% |
28.0% |
14.5% |
|
Massachusetts |
2.5% |
5.1% |
19.9% |
17.7% |
6.5% |
30.9% |
17.4% |
|
Connecticut |
2.8% |
6.2% |
24.0% |
20.3% |
6.9% |
25.3% |
14.6% |
|
Vermont |
1.0% |
5.6% |
28.6% |
19.2% |
8.4% |
27.4% |
9.8% |
|
New Hampshire |
1.4% |
5.6% |
25.7% |
21.4% |
9.4% |
26.8% |
9.7% |
|
Rhode Island |
3.6% |
7.1% |
22.9% |
22.2% |
8.5% |
24.9% |
10.8% |
|
Maine |
1.0% |
5.0% |
30.1% |
24.4% |
9.5% |
22.8% |
7.1% |
Source: U.S. Census Bureau. (2009-2013). 2013 American Community Survey 5-Year Estimates. Retrieved from http://factfinder2.census.gov
Figure 6
Mortgage lenders, such as ourselves as a non-profit Community Development Financial Institution; have seen an increase in mortgage application declines due to high debt ratios attributable to high student loan debt. —Survey Respondent
As the rising costs of higher education have driven up student debt totals, student debt default rates have risen to over 10%, a default rate higher than that for credit cards.[13]
The news is not all bad, however. A movement is afoot to drive down the cost of a quality college education, independent of how it is financed. President Barack Obama, in his January 2015 State of the Union address, put forth a goal "to lower the cost of community college—to zero." Predating the President's remarks, the state of Tennessee, in 2014, launched the "Tennessee Promise" program that aims to make a community college education affordable to all state residents by covering the shortfall between the actual cost of tuition and the financial aid provided by federal and other educational grants. In July 2015, Tennessee was joined by Oregon, which launched its own "Oregon Promise" program, aimed at providing free community college education through a model similar to Tennessee.
One of the largest sources of aid promoting access to post-secondary education, the existing Federal Pell Grant Program provides financial relief for many lower-income post-secondary students. Those eligible for need-based Pell grants can apply them towards a college education, thereby lowering the total cost of their education. These grants do not have to be repaid.
Several colleges have taken a slightly different approach, taking out or underwriting insurance policies on graduates' future job prospects. An expansion of existing programs like the Career Options Assistance Program [14] at Yale Law School provides substantial post-graduation assistance with educational loan repayment for those graduates who choose lower-paying jobs. Adrian College in Michigan offers a loan repayment assistance program to students that "offers to pay all or part of its student's loans if they are unable to secure a well-paying job post-graduation."[15]
Another way to approach the rising cost of education is to promote individual savings, or children's savings accounts. All six states in New England have either implemented children's savings account programs or are actively exploring the development of programs. One example is the Harold Alfond College Challenge,[16] which provides $500 toward college for every baby born to a Maine resident. Five-hundred dollars may seem like a small amount in the face of a six-figure college debt, but the benefit of reduced dependency on borrowed funds accrues over the long term to future students.
Since these programs are new, their long-term effects on employment rates and income levels cannot be projected in any meaningful way now. In the meantime, the cost of a traditional postsecondary education and how it is financed will have to evolve in order to meet the future educational needs of the United States.
Future of Jobs
In every New England Community Outlook Survey, the top challenge facing lower-income communities has been availability of employment opportunities. In previous surveys, respondents were asked about the next six months; this time, however, the survey questions solicited a longer term view. The April 2015 Community Outlook Survey asked respondents to estimate the availability of jobs in their communities over the next five years in order to get a better idea of their impressions of the longer term job prospects for all residents in their communities.
What is the market going to look like for the high school graduates of 2015, many of whom will be emerging in 2020 with the ink still wet on their bachelor's degrees? Optimistically, 68% of respondents thought that the availability of jobs over the next five years would increase. Responses differed somewhat regionally; 75% of respondents from the southern New England states anticipated an increase in jobs, and slightly less than 61% of respondents in the northern tier states (Maine, New Hampshire and Vermont) predicted an increase.
Survey respondents were less optimistic about how prepared New England communities will be to take advantage of job growth. Only one-third of respondents felt confident in their community's ability to supply the educated workforce that the expected job growth will demand. Thirty-seven percent of respondents felt that their communities would not be able to meet the educational needs and 30% didn't know.
Only one-third of respondents believed that the increase in jobs would require a bachelor's degree or higher. The majority (57%) of survey respondents projected that the jobs of the next five years will only require an associate's degree or a certificate, and just 10% thought that a high school degree would suffice. The picture painted by survey respondents was of a work environment dominated by middle-skilled workers in the health care, hospitality, and retail industries (Figure 7.)
The majority of constituents would say that the job market and society demanded it. It was a requirement to even interview in the field of work in which I participate. But, most of my training has been on-the-job. I value what I learned in college, but could do my work without the degree. Whether or not my debt has been worth it is a question I struggle with almost every day. —Survey Respondent
Figure 7.
Survey respondents' perspective on employment opportunities by industry for the next five years
Survey question: In the next five years, which industries will provide the most job opportunities within the community you serve?
|
Industry |
Responses |
|---|---|
|
Health Care and Social Assistance |
24% |
|
Leisure and Hospitality |
18% |
|
Retail Trade |
11% |
|
Construction |
9% |
|
Professional and Business Services |
9% |
|
Manufacturing |
9% |
|
Educational Services |
7% |
|
Finance and Insurance |
6% |
|
Other |
3% |
|
Government |
3% |
Source: New England Community Outlook Survey, April 2015
If I had known the earnings potential my chosen profession offered, I would have either chosen a different profession or obtained a degree from an institution that wasn't as expensive. That to me is the crux of student loan debt problem…Allowing consumers to take on levels of debt without any consideration to their earnings potential which will dramatically impact their ability to pay back the debt. If that doesn't become part of the discussion/solution we'll never solve the problem. —Survey Respondent
A Boston Fed paper [17] found that in New England, there is now and will be in the future a gap between the market demand for middle-skilled workers and the workforce supply. The gap arises not only from the creation of new jobs as the economy grows but also from the vacancies in existing jobs as the workforce ages and many in the baby-boomer generation retire.
Expecting an increased number of retirees, the U.S. Bureau of Labor Statistics (BLS) has undertaken forecasts of the national occupational growth for the time period 2012 to 2022. Figure 8 shows the top occupations (by expected number of open positions) that pay a wage greater than 200% of the 2012 U.S. Department of Health & Human Services Poverty Guidelines. In contrast to the perceptions of our survey respondents, the majority (60%) of the BLS forecasted positions will just require a high school diploma or less, whereas only one in 10 respondents to the survey felt that this would be the case. Almost a quarter of the total occupations forecasted by the BLS will require a certificate or associate's degree, and these occupations are nursing-related, which parallels our survey responses projecting that the top area for job growth would be in the middle-skilled health-care industry.
In 2013, Georgetown University published a report that stated: "By 2020, 65 percent of all jobs in the economy will require postsecondary education and training beyond high school."[18] The report specifically mentions that "postsecondary education and training" does not necessarily mean a bachelor's degree; in fact, 30% of the future jobs will require only "some college or an associate's degree."
The nation seems to be in a bit of a quandary. According to Modestino's research, there will be a lack of workers to fill the anticipated vacancies in middle-skilled jobs over the next few years. At the same time, the national picture may be exhibiting a long-term structural polarization [19], [20] of the job market, resulting in the gradual disappearance of middle-skilled jobs. The BLS numbers are indicating a concentration of middle-skilled occupations within a single industry, and a majority of positions that only require a high school diploma or less. From their grass-roots perspective, very few of our survey respondents predict growth in the future for jobs only requiring a high school diploma.
Our survey analysis and review of the literature corroborates that the data points in different directions regarding the future of jobs. Some anticipate a middle-skills gap, others project a slow disappearance of middle-skills jobs, and some see a future replete with job openings for lower-skilled workers.
During the recession many adults went back to college as the messaging, both academically and politically, suggested that this would enable them to qualify for better employment opportunities. In the area we serve most "quality" jobs have been moved and retail and hospitality are the driving force of the economy. These are low paying, weak benefit, and seasonal positions. —Survey Respondent
Figure 8.
U.S. Bureau of Labor Statistics top 10 occupations earning living wage, 2012-2022 [21]
|
Occupation |
No. of Jobs (2012) |
Expected Jobs (2022) (Thou- sands) |
Growth (no. of jobs in (Thou- sands) |
% Change |
Expected Openings by 2022 (Thou- sands) |
Median Salary |
Education Needed for Entry |
|---|---|---|---|---|---|---|---|
|
Registered nurse |
2,711.5 |
3,238.4 |
526.8 |
19.4 |
1,052.6 |
$65,470 |
Associate's degree |
|
Customer service representative |
2,362.8 |
2,661.4 |
298.7 |
12.6 |
941.6 |
$30,580 |
High school diploma or equivalent |
|
Laborer; freight, stock, and material mover hand |
2,197.3 |
2,439.2 |
241.9 |
11.0 |
922.5 |
$23,890 |
Less than high school |
|
Office clerk, general |
2,983.5 |
3,167.6 |
184.1 |
6.2 |
810.9 |
$27,470 |
High school diploma or equivalent |
|
General and operations manager |
1,972.7 |
2,216.8 |
244.1 |
12.4 |
613.1 |
$95,440 |
Bachelor's degree |
|
Nursing assistant |
1,479.8 |
1,792.0 |
312.2 |
21.1 |
593.6 |
$24,420 |
Post- |
|
Secretary and administrative assistant, except legal, medical, and executive |
2,324.4 |
2,632.3 |
307.8 |
13.2 |
587.6 |
$32,410 |
High school diploma or equivalent |
|
Accountant/ auditor |
1,275.4 |
1,442.2 |
166.7 |
13.1 |
544.2 |
$63,550 |
Bachelor's degree |
|
First- |
1,418.1 |
1,589.6 |
171.5 |
12.1 |
508.0 |
$49,330 |
High school diploma or equivalent |
|
Construction laborer |
1,071.1 |
1,331.0 |
259.8 |
24.3 |
489.1 |
$29,990 |
Less than high school |
Source: Employment Projections program, U.S. Department of Labor, U.S. Bureau of Labor Statistics
Future of New England
The future seems bright for New England. Seventy-five percent of our survey respondents foresee job growth in the next five years. New England residents appear to want to go to college and the majority of the next generation is trying to do so. However, nearly one-third of New Englanders, ages 25-29, have been unable to complete their college dreams and may be stuck holding debt though they lack the improved employment chances that accompany attainment of a college degree. But with some college-level courses under their belts, they may be earning a bit more money; so for now, the college investment may be worth the cost.
The cost of educating the next generation will be borne not only by the next generation but also by the broader economy as former students enter the workplace with debt, delaying the significant financial decisions (home or car purchases) that require creditworthiness and lighter debt burdens. The problem isn't just the existence of debt but the amount of debt, as the cost of higher education continues to outpace inflation and does not appear to be slowing. When they graduate, those who take out loans to pay for all or most of the $100,000 expected cost of a four-year education need a job that pays at least $49,000 to stay on the right side of the debt-to-income ratio (that is, 30% debt to income) when they graduate. Furthermore, the unemployment rate for young adults (ages 20-24) hovers around 10%, so finding a job to enable paying off the debt is difficult.
Citizens of New England are fortunate in that no one grows up more than a stone's throw from a world-class college education. This suggests that having the right workers for the right jobs is well within reach in New England as regional and local economic development efforts gain momentum.
The New England Community Outlook Survey will continue to ask regional service providers for local knowledge about how lower-income communities are faring and how the Federal Reserve Bank of Boston can provide insight and expertise pertinent to the issues confronting these communities.
Methodology
For the past two years, the Federal Reserve Bank of Boston has conducted the New England Community Outlook Survey. The respondents represent organizations providing direct services to lower-income households. Organizations are asked twice a year to designate a senior staff member to respond to the six-minute survey. For the latest iteration of the survey, 160 service providers from the economic development, affordable housing, community action, human services, and workforce development sectors in each of the six New England states responded to 22 multiple-choice and fill-in questions. We asked respondents to comment on the changes in conditions over the previous six months and to project changes over the next six months. Respondents completed the survey between October 1 and October 18, 2013. For the purposes of this report, USDA Rural Urban Commuting Areas (RUCA) from 2006 were used to classify zip codes as either rural or urban. Data collected represent the opinions of service providers who completed the survey. While we strive to include a reasonably representative sample in our survey, responses should not be interpreted to represent the opinions of all service providers in New England.

 About the Authors
Anthony S Poore
Kaili Mauricio
Endnotes
- C. R. Tamborini, , C. H. Kim, and A. Sakamoto. "Education and Lifetime Earnings in the United States." Demography, June 2015, 25 pp. doi:10.1007/s13524-015-0407-0
- M. Hout. (2012). "Social and economic returns to college education in the United States." Annual Review of Sociology 38, p. 394.
- Accordino, J., and G. Johnson. (2000) "Addressing the Vacant and Abandoned Property Problem," Journal on Urban Affairs 22 (3): 301-315.
- U.S. Department of Education, National Center for Education Statistics, 2015. Digest of Education Statistics, 2014 (NCES 2015-011), Table 330.10.
- The average for public and private institutions in 2014 U.S. dollars.
- Located at http://www.pewsocialtrends.org/2011/05/15/is-college-worth-it/
- Federal Reserve Bank of New York, Quarterly Report on Household Debt and Credit, May 2015. Located at http://www.newyorkfed.org/householdcredit/2015-q1/data/pdf/HHDC_2015Q1.pdf
-
This map appeared in the Summer 2015 issue of Communities & Banking magazine. Located at
http://www.bostonfed.org/commdev/c&b/2015/summer/Mauricio-mapping-New-England-student-loans.htm - D. Cooper and J. C. Wang. Student Loan Debt and Economic Outcomes. Federal Reserve Bank of Boston Current Policy Perspectives No. 14-7, October 2014. Located at http://www.bostonfed.org/economic/current-policy-perspectives/2014/cpp1407.htm
- According to the Pew Research Center, as of 2012, "Seventy percent of total student debt was owed by households headed by those under age 45." R. Fry, "A Record One-in-Five Households Now Owe Student Debt. Pew Research Center, Social Trends and Demographics. September 26, 2012. Located at http:// www.pewsocialtrends.org/2012/09/26/section-2-who-owes-the-outstanding-student-debt
- Pew Research Center. "Is College Worth It? College Presidents, Public Assess Value, Quality and Mission of Higher Education," May 16, 2011. Located at http://www.pewsocialtrends.org/2011/05/15/is-college-worth-it/
- U.S. Census Bureau. (2009-2013). 2013 American Community Survey 5-Year Estimates
- Federal Reserve Bank of New York, Quarterly Report on Household Debt and Credit, May 2015. Located at http://www.newyorkfed.org/householdcredit/2015-q1/data/pdf/HHDC_2015Q1.pdf
- The Career Options Assistance Program (COAP) offers financial aid to Yale Law School graduates who are employed in lower-income positions while still carrying a significant debt burden. More information can be found at http://www.law.yale.edu/admissions/finaid_COAP.htm
- Located at http://adrian.edu/admissions/financial-aid/adrianplus
- Located at https://www.500forbaby.org/
- A. S. Modestino, Mismatch in the Labor Market: Measuring the Supply of and Demand for Skilled Labor in New England. Boston: Federal Reserve Bank of Boston, New England Public Policy Center, November 2010. Located at https://www.bostonfed.org/economic/neppc/researchreports/2010/neppcrr1002.htm
- Carnevale AP, Smith N, Strohl J, Recovery: Job Growth and Education Requirements Through 2020, Georgetown University Center on Education and the Workforce. 2013. Located at https://cew.georgetown.edu/report/recovery-job-growth-and-education-requirements-through-2020/
- A. Cheremukhin, Middle-Skill Jobs Lost in U.S. Labor Market Polarization. Economic Letter 9(5), 2014. Federal Reserve Bank of Dallas. Retrieved from http://dallasfed.org/assets/documents/research/eclett/2014/el1405.pdf
- Cheremukhin attributes the losses of middle-skills jobs from 1980 to 2007 to increased automation and globalization of the labor market.
- It should be noted that these are the top 10 occupations out of nearly 800 occupations, and these represent 19% of all forecasted jobs that meet the livings-wage requirement.