How the Student Loan Payment Pause Affected Borrowers’ Credit Access and Credit Use 


Federal Reserve Bank of Boston
The views expressed herein are solely those of the authors and should not be reported as representing the views of the Federal Reserve Bank of Boston, the principals of the Board of Governors, or the Federal Reserve System.
In March 2020, early in the COVID-19 pandemic, the Trump administration paused federal student loan payments and interest accruals as a temporary relief measure for borrowers. The pause covered roughly 90 percent of all outstanding student loans, affecting about 38 million individuals, who collectively held a balance of $1.5 trillion.1 At the outset, the duration of the pause was uncertain, but the policy would be extended multiple times through September 2023.
The effects of this policy change were nontrivial. For each of the 17 million student loan borrowers in active repayment, the pause freed up $280 a month,2 on average, or about $13,500 per person over the entire 43-month period that the policy remained in effect. (In comparison, a childless individual with an adjusted gross income of less than $75,000 received a total of $3,200 from the three rounds of Economic Impact Payments in 2020 and early 2021.) In addition, federal student loans—even those held by the 21 million borrowers not in active repayment because their loans already were in deferment or forbearance—effectively were switched to interest-free loans during the pause, representing an additional, nontrivial benefit in the form of a lifetime wealth gain for borrowers. Our conservative estimate suggests an average gain from this zero-interest period of about $9,350 per borrower, or $280 billion overall.
Sign up for Research Department Updates.
Another important feature of the pause was the provision that offered large-scale forgiveness of derogatory marks (DM) against individuals who had previously defaulted on a student loan. While this change came without direct monetary implications, we show that it had a noticeable impact on borrower outcomes. In particular, wiping away these borrowers’ records of past payment troubles improved their credit scores (almost mechanically), providing them with expanded access to other forms of borrowing.3
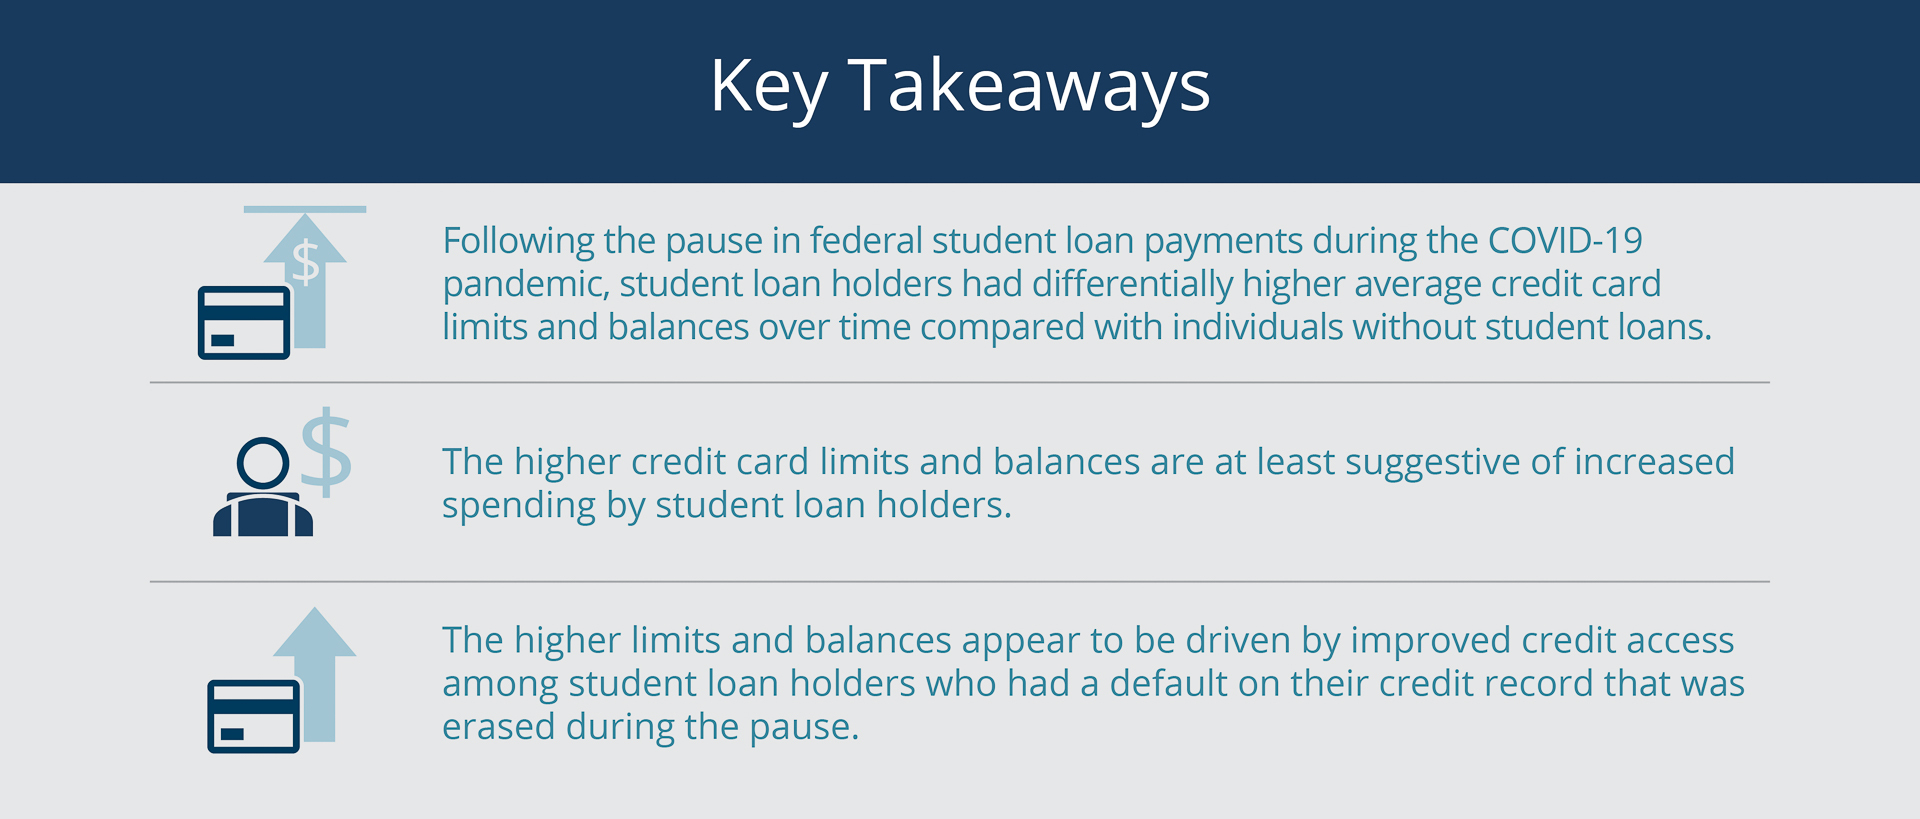
We examine how the pause affected federal student loan holders’ credit access and credit use—specifically their access to and use of credit cards. We do not include private student loan borrowers in our analysis because the pause did not affect their loans. Assessing the impact of the pause is important for understanding the efficacy of the policy change or of similar policies that could be considered during future periods of economic distress.4 To this end, we analyze student loan and other tradeline credit data from the Federal Reserve Bank of New York Consumer Credit Panel (CCP) provided by Equifax. We focus on credit cards partly because they are linked to household expenditures, which may have changed due to the increased cash flows from the pause. We don’t examine the direct link between the pause and consumer spending because that is beyond the scope of our data. However, we find evidence that, over time following the pause, federal student loan holders (referred to as SLHs hereafter) had differentially higher average credit card limits and higher average balances than individuals without student loans (non-SLHs), both of which are at least suggestive of increased spending by SLHs.5 We also show that these patterns appear to be driven by improved credit access among SLHs who had a student-loan-related DM on their credit records that was forgiven during the pause.6
All Federal Student Loan Holders Benefited from the Pause
The payment pause placed all federally owned student loans, or about 90 percent of all student loans, into deferment whereby no payments were required and no interest accrued. Roughly 17 million borrowers, or 45 percent of all federal student loan holders, benefited from both of these changes. The pause had less of an impact on the roughly 55 percent of SLHs (about 21 million individuals) whose loans were already in deferment or forbearance.
SLHs in forbearance (about 16 million individuals) had already had their payments suspended for a variety of reasons, but they benefited from the interest on their loans temporarily not accruing. SLHs in deferment (about 5 million) already were not making payments or accruing interest, but the policy change likely extended these benefits for some of those borrowers.7
Note that SLHs can be in deferment or forbearance while they are in school or during periods of financial hardship or unemployment.8
Credit Limits and Balances Grew Faster for Student Loan Holders than for Individuals without Student Loans
We restrict our analysis of SLH credit outcomes and behavior to individuals aged 25 to 40. The goal is to focus on borrowers in the earlier years of student debt repayment, when the benefits of the pause were likely greater. This approach enables us to compare SLHs to individuals without student loans (non-SLHs)9 in a way that observed differences between the two groups are not going to be due simply to age, since individuals older than 40 may have had student loans but finished repaying them. We find that while the two groups are distributed similarly across ages within the 25- to 40-year-old range, their credit scores were noticeably different at the start of the pandemic.10 In particular, the SLH credit scores were, on average, roughly 30 points lower than the non-SLH scores, and the differences were even larger at the lower end of the credit score distribution. (See the Appendix for additional details.) As we noted earlier and will discuss more later, for SLHs, improvement in their credit ratings was one of the important benefits from the pause. (Dinerstein, Yannelis, and Chen [2024] also highlight the improvement in credit scores.)
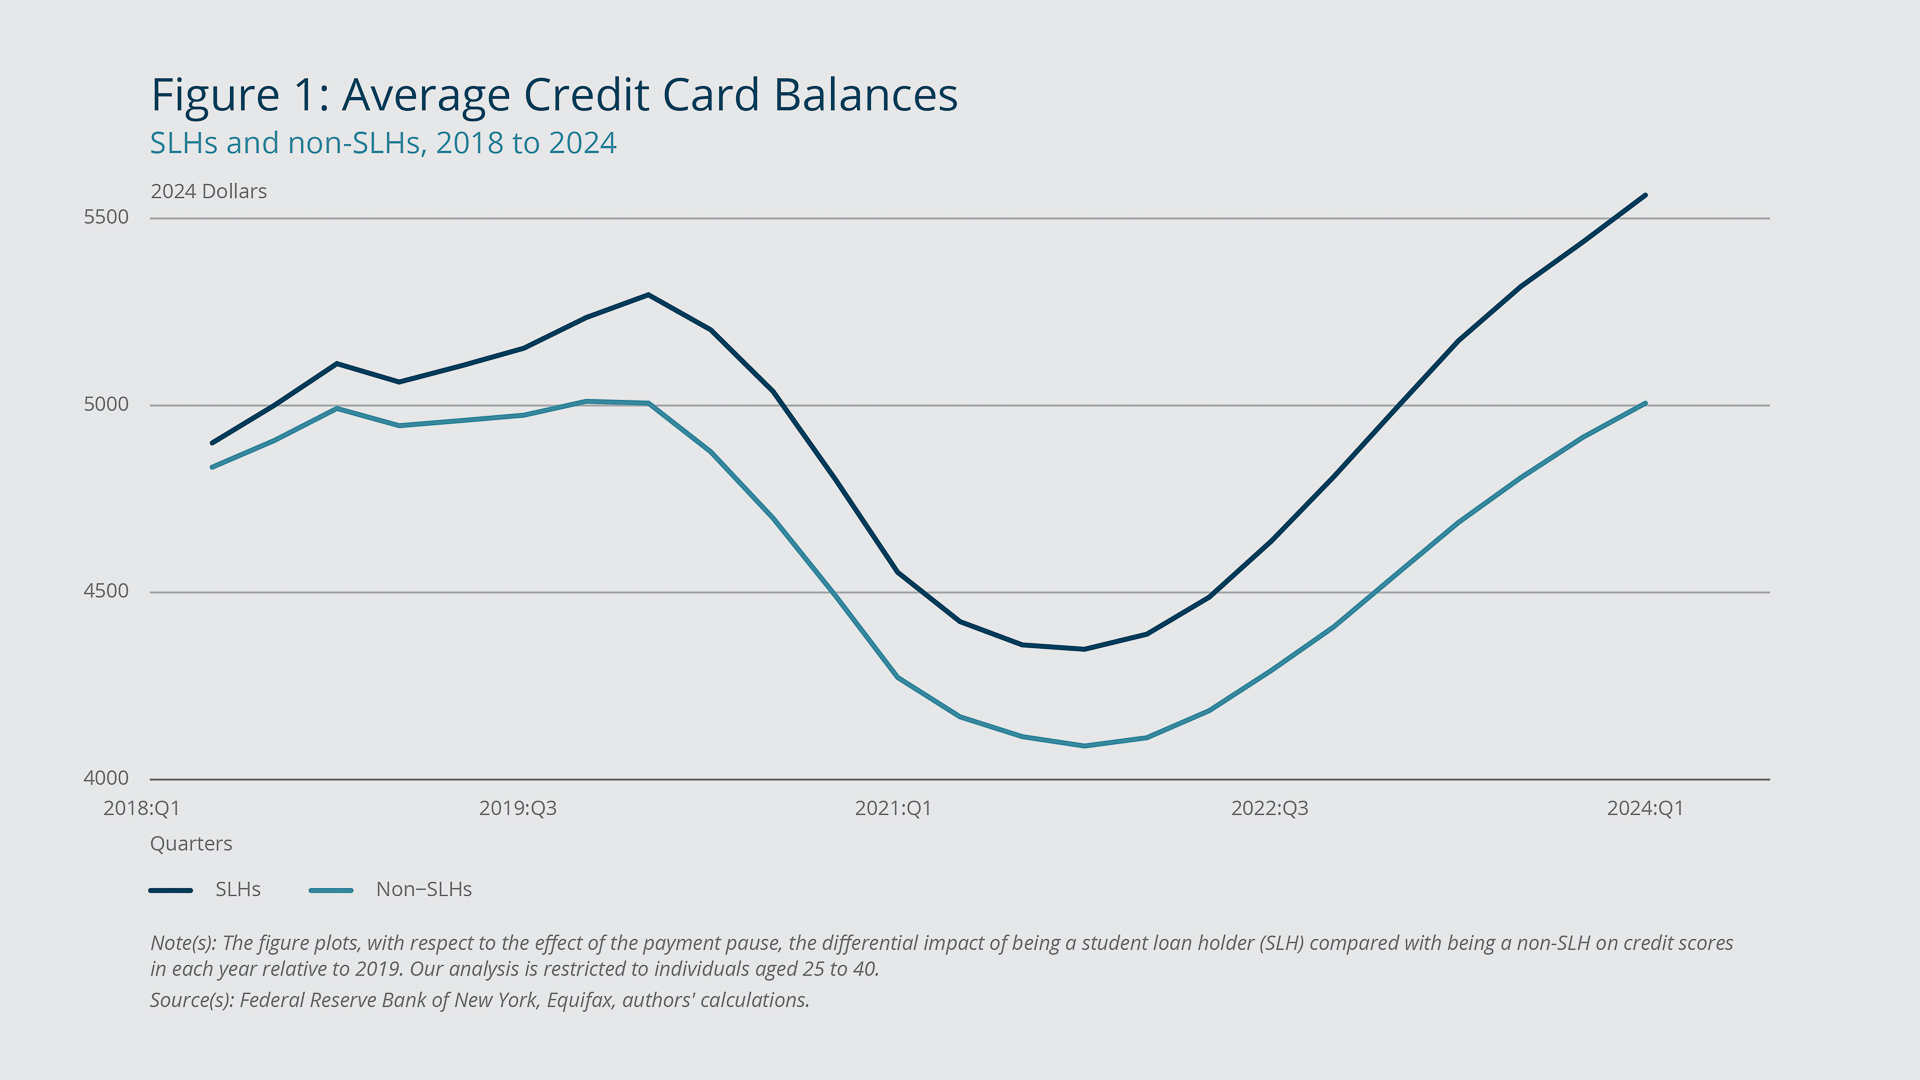
On the eve of the pandemic, in the fourth quarter of 2019, the SLHs and non-SLHs in our sample had similar credit card balances. The mean balances were $4,200 for SLHs and $4,050 for non-SLH; the medians were $1,400 and $1,200, respectively. As Figure 1 highlights, credit card balances declined for both groups from March 2020, when the pause went into effect, through 2021:Q4 (18 percent and 17 percent cumulatively for SLHs and non-SLHs, respectively). This change was likely driven by a combination of less new spending, given the government-mandated restrictions on activities involving social contact, and a reduced need to borrow due to the substantial pandemic-era fiscal support, which many individuals also used to pay down existing debt (Kosar et al. 2023).11 During the ensuing recovery, both groups’ average balances increased, growing slightly faster for SLHs and reaching more than 5 percent higher than pre-pandemic levels by 2024:Q1.
Federal Reserve Bank of Boston
Some of the increase in SLH balances relative to before the pandemic is likely due to increased borrowing capacity. At the end of 2019, SLHs had lower overall credit card limits than non-SLHs, on average, but they experienced a much larger increase in average borrowing capacity during the pandemic recovery—to the point that the two groups’ average credit limits are now similar. SLHs’ mean credit limit increased 14 percent, from $12,000 to $14,000, over the 2019:Q4–2024:Q1 period (the median increase was 20 percent, $6,400 to $8,000), while the average gain for non-SLHs was comparatively negligible, $13,400 to $13,600 (mean) and $6,800 to $7,200 (median). This large difference in credit limit growth is likely due to more SLHs actively seeking out and receiving or passively receiving additional credit cards over this period. Indeed, SLHs now have more credit cards, on average, than non-SLHs—which was not the case before the pandemic. SLHs may also have obtained, actively or passively, credit line increases on existing cards.12 Both outcomes are consistent with SLHs’ increased access to or demand for credit as a result of the pause.13
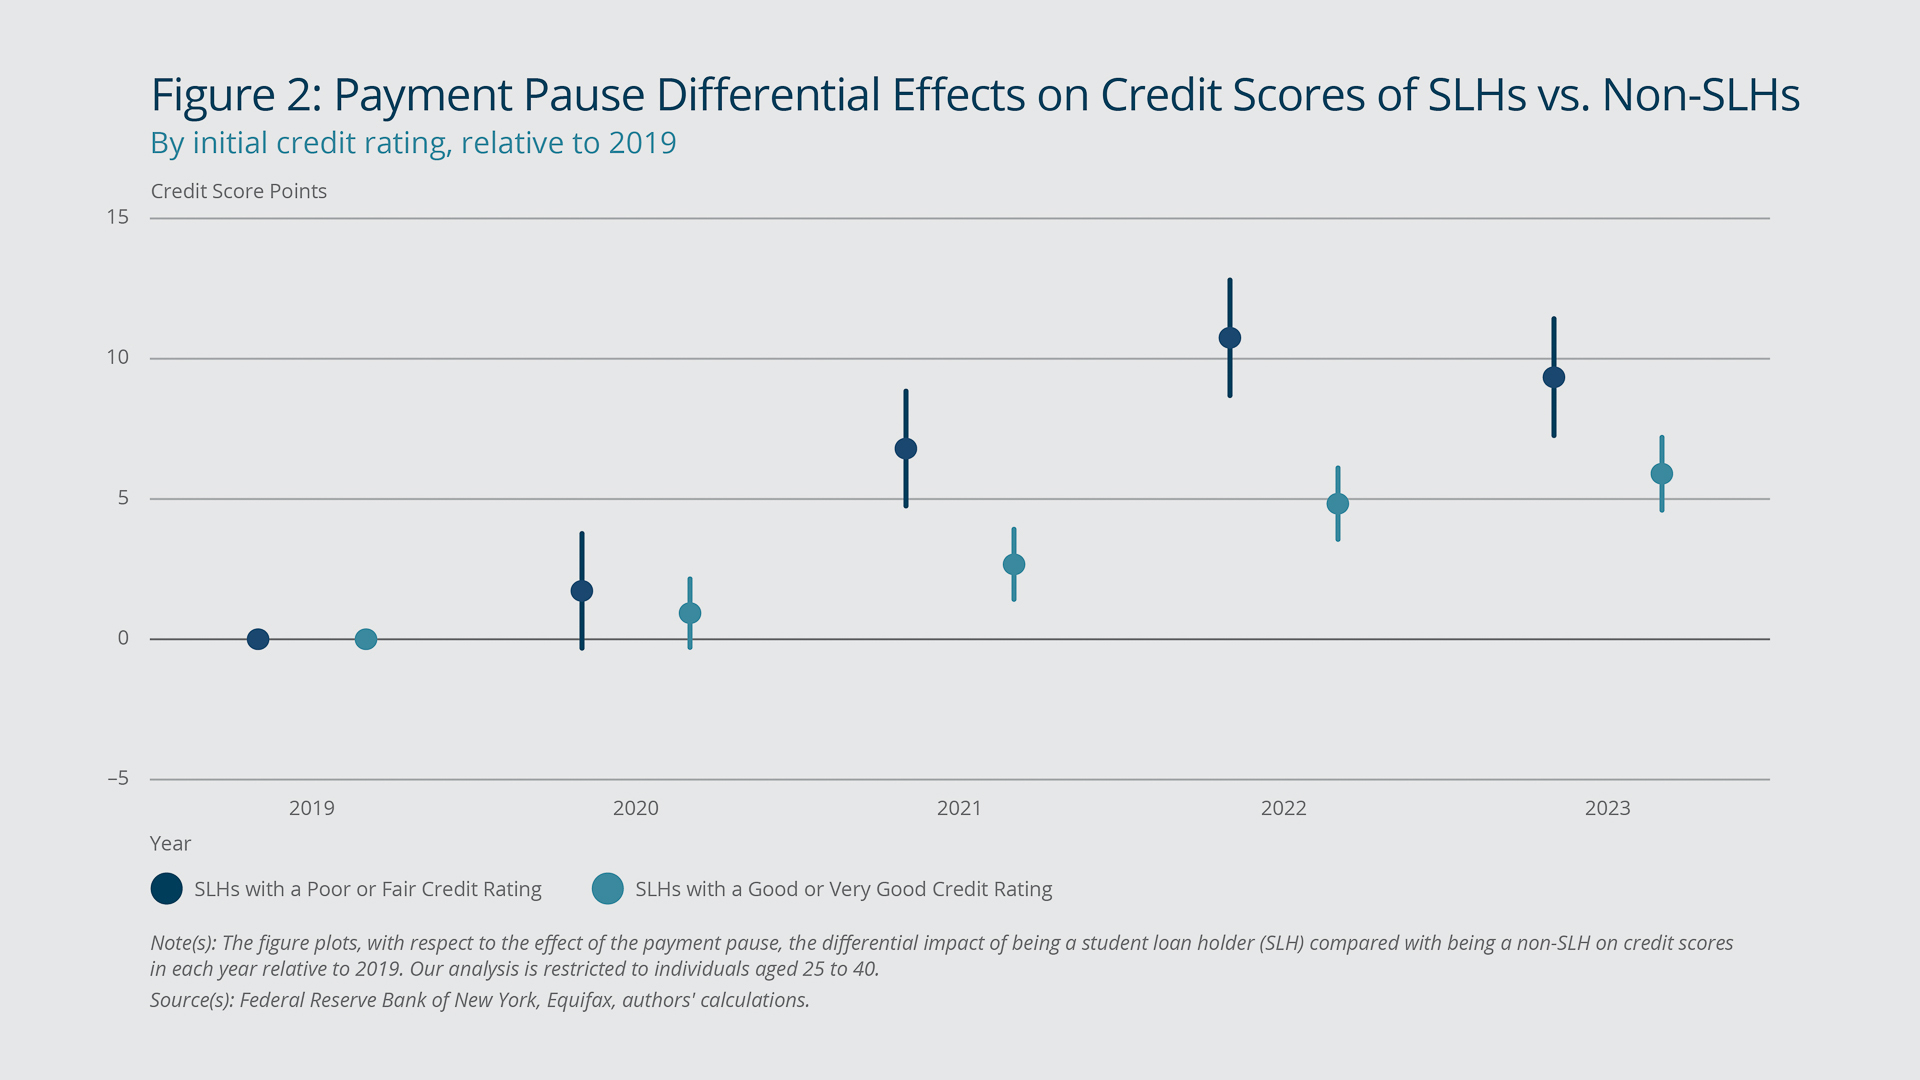
Consistent with SLHs’ increased credit access and supply, their credit scores exhibited larger improvements than non-SLHs’ scores during the pandemic recovery. By 2024, SLH credit scores had gained 33 points on average compared with an average of only 19 points for non-SLH scores. Figure 2 plots the differential effect of being an SLH versus being a non-SLH on credit scores in each year relative to 2019 (before the pandemic). The estimates control for potential changes in economic conditions or other time-varying factors that could impact all borrowers. They also control for borrower age and any unobserved time-invariant borrower characteristics. The estimation equation is included in the appendix.
Federal Reserve Bank of Boston
We report results for individuals with credit ratings of “poor,” “fair,” “good,” or “very good” but not for those with “excellent” scores because that rating applies to only a small portion of SLHs.14 The figure shows that after the pause went into effect, SLHs saw larger credit score gains compared with non-SLHs in the same initial score range. The figure also shows that the increases for SLHs with lower initial credit ratings were greater than those for SLHs with higher ratings. The SLH effect for borrowers with poor or fair credit scores peaked in 2022, although it was still significantly positive in 2023. Overall, these results are consistent with the pause helping improve SLH’s credit ratings and credit access.
Pause Had a Stronger Impact on Borrowers with a Previous Default
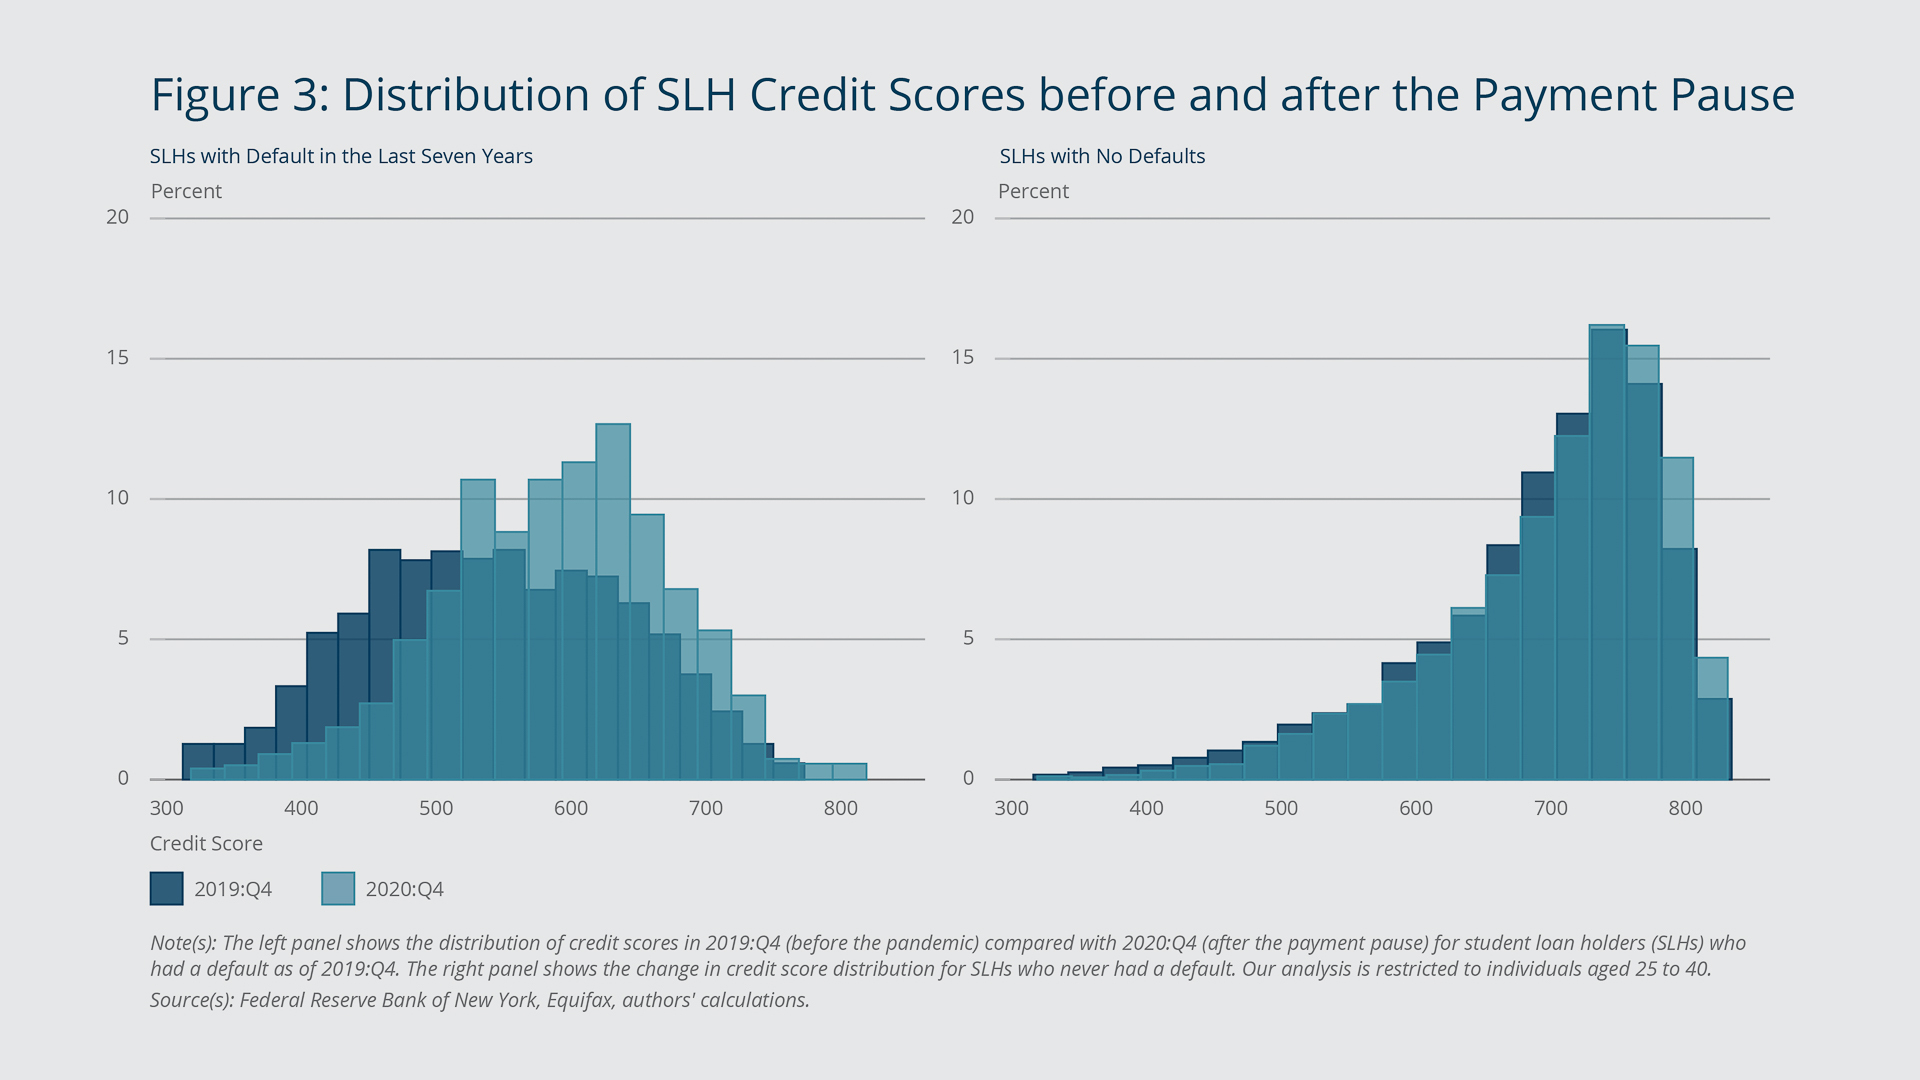
Digging deeper, we find that, perhaps not surprisingly, the increase in credit scores and individuals’ related credit access was driven by SLHs who, before the pandemic, had a DM on their credit record from a past student loan default. Figure 3 highlights this finding. The left panel shows the distribution of credit scores in 2019:Q4 compared with 2020:Q4 for SLHs with a DM as of 2019:Q4. The right panel shows the same, but for SLHs without a DM. (Note that from here forward we focus only on SLHs and compare those with a DM to those without one.) The results are striking, as the distribution of credit scores shifts notably higher for SLHs with a previous DM and changes little for SLHs with no DMs.
These differences are not surprising given that a DM tends to weigh heavily on an individual’s credit rating. Note that in late 2019, median credit scores were about 570 for SLHs with a DM and slightly higher than 700 for SLHs without a DM. While other factors may also help explain this large difference in initial credit ratings, Figure 3 speaks to how the pause, with its elimination of DMs on SLHs’ credit records, resulted in a seemingly mechanical increase in credit scores for affected individuals. Indeed, immediately following the implementation of the pause, credit scores increased, on average, 33 points for SLHs with a DM and 14 points for SLHs with no DM.
Federal Reserve Bank of Boston
Pause Had a Stronger Impact on Borrowers with a Previous Default
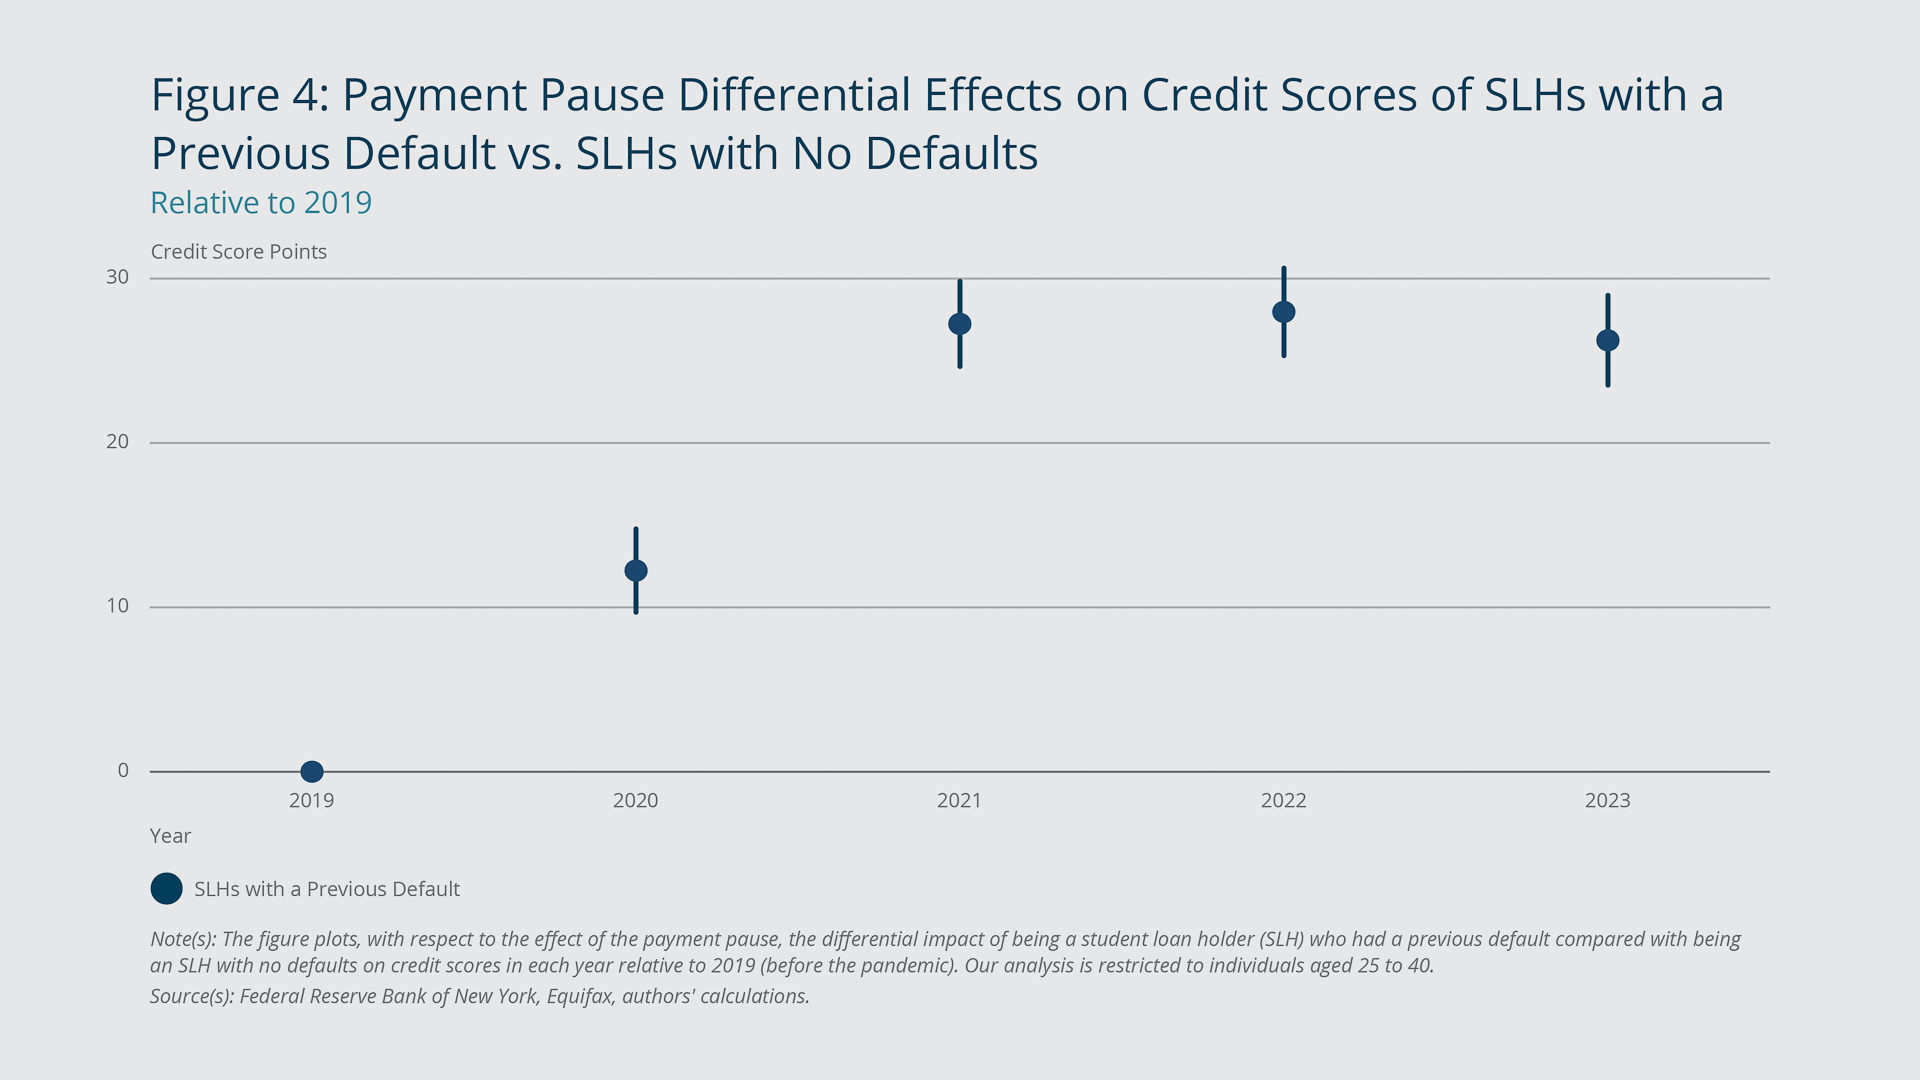
In addition to the initial, unconditional average improvement in credit scores for SLHs with a DM, there is also a differential improvement over time. Here, we conduct the same type of analysis as we do in Figure 2 but compare only the two groups of SLHs we just analyzed, those with DMs and those without DMs. Figure 4 shows the results. By mid-2021, credit scores for SLHs with past payment troubles were 27 points higher than those for SLHs with a clean payment record before the pandemic. These findings emphasize again that while the pause likely temporarily improved SLHs’ cash flows, a perhaps more important benefit was improved credit scores primarily for SLHs with DMs.
Federal Reserve Bank of Boston
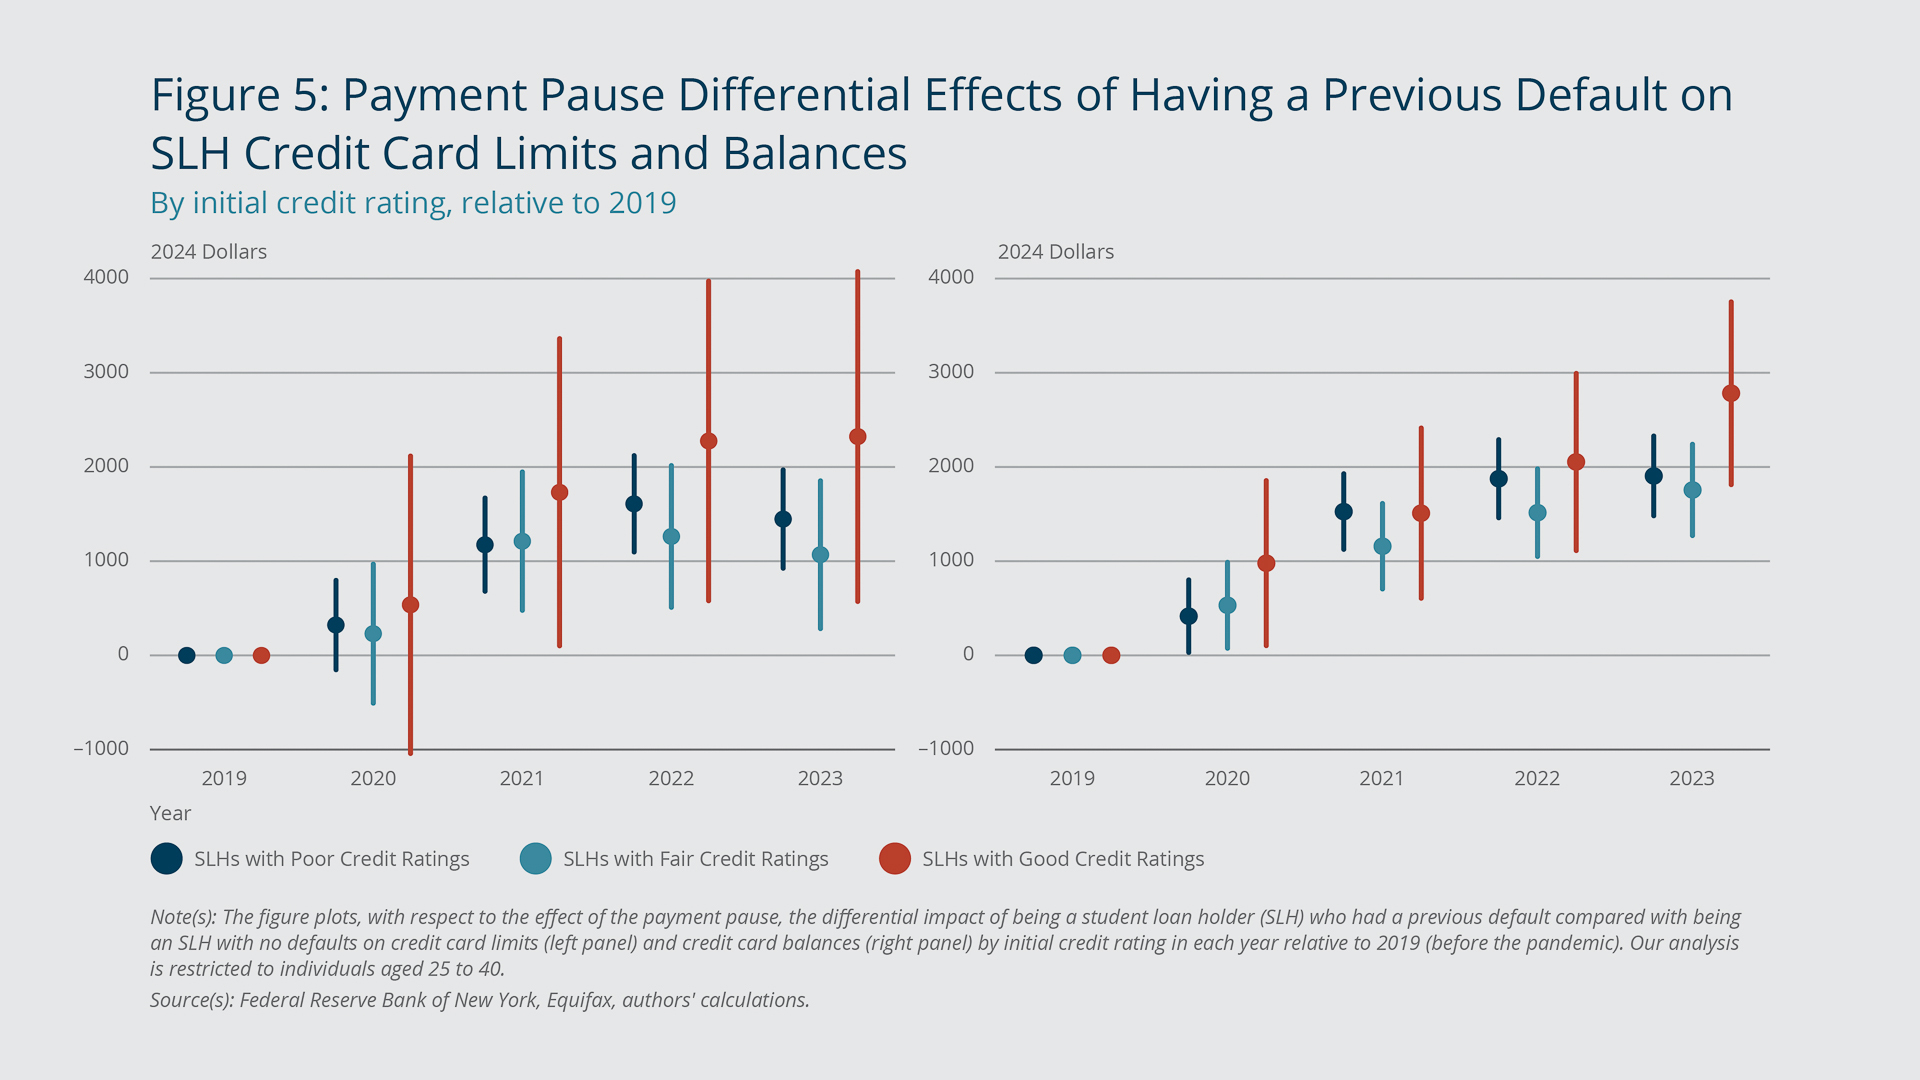
Consistent with the elimination of DMs leading to higher credit scores and improved credit access, we find a differentially larger increase in credit card limits in the years since the pause for SLH with a previous DM. Here, we focus on individuals with a credit rating of good or lower before the pandemic because, not surprisingly, very few SLHs with a DM were in the higher credit score categories.
The left panel of Figure 5 highlights that following the implementation of the pause, credit limits increased differentially more for SLHs with a DM compared with SLHs without a DM. The difference is particularly striking for individuals with good credit ratings—about $2,300 by mid-2023. The effects are also notable, but smaller in magnitude, for SLHs with a DM and lower initial credit ratings (although the differences across the credit limit increases of the three DM groups are not statistically significant).
Federal Reserve Bank of Boston
It makes sense that individuals with good credit scores exhibit the largest differential effects. Their relatively high initial credit scores suggest that the DM from past student loan payment troubles is the only blemish (or one of very few) on their credit record, which leads to the large differential score increases we observe in Figure 4 when the DM is removed.15 In turn, banks are more willing to lend to them, and their credit access improves notably. In addition, the differential increase in credit limits for SLHs with a DM and only poor or fair credit ratings highlights that SLHs with lower credit scores and limited credit access also benefited in a meaningful way from the elimination of their DMs.
A similar pattern emerges with credit card balances, as highlighted in the right panel of Figure 5. It shows that balances were notably higher (especially in more recent years) on a relative basis for SLHs who had a DM and a good initial credit rating compared with SLHs in the same credit group who never had a DM. The figure also shows that balances were differentially higher, but to a lesser degree, for SLHs who had a DM and poor or fair initial credit. These results suggest that SLHs with DMs, who benefited the most from improved credit ratings and higher credit limits, used at least some of their increased borrowing capacity.
Of course, we cannot know for certain what portion of these higher credit card balances represents new spending versus more revolving debt, but increases in balances due to just limited payments and interest accrual seems unlikely, especially for SLHs with good initial credit. Because the results are relative to others in the same credit rating group and control for unobserved factors such as whether individuals tended to be credit revolvers in the past, at least some of the balance changes most likely reflect new spending, even if some of that spending has turned into more revolving debt.
Endnotes
- Here and elsewhere, unless otherwise specified, the results are based on our calculations using the Federal Reserve Bank of New York Consumer Credit Panel provided by Equifax. It is a nationally representative, anonymous, 5 percent sample of all individuals with a credit record in the United States.
- All reported amounts are in 2024 dollars based on the total personal consumption expenditure (PCE) price deflator. Flows are calculated by observing scheduled payments in the quarter before the pause.
- While nearly anyone enrolled in school can obtain a federal student loan, other credit markets are much more tightly underwritten (see Mezza, Ringo, and Sommer 2024), and an individual’s credit score, borrowing, debt repayment history, income, and other factors affect their ability to obtain financing.
- Dinerstein, Yannelis, and Chen (2024) also evaluate the effects of the 2020 student loan policy changes. While the authors look at some of the same outcomes as we do, they use the policy change to evaluate the efficacy of debt moratoria more generally in stimulating the economy relative to the efficacy of direct cash transfers. In addition, for identification purposes, they restrict their sample to individuals who have had student loans since before 2010. Therefore, as they highlight, their results generally pertain to older SLHs who, because of the standard timeline of student loan repayment, have likely fallen behind on repaying their loans. By contrast, we focus on how the gains from the payment pause and the erasure of previous student loan default records affected the credit behavior of a representative sample of younger SLHs.
- SLH credit card balances could have been higher due to new spending and/or existing balances revolving from month to month (and the interest accrued on those balances).
- To identify federal loan holders with a DM, we first identify loan servicers in our data that handle only federal loans. (Loan servicers are companies assigned by the Federal Student Aid office to collect monthly payments and perform other administrative tasks associated with student loans.) We further ensure that no loans managed by a servicer on our list became delinquent during the pause and then mark a student loan as a federal loan if it is serviced by one of these companies. We drop any loans that had an increasing balance during the pause and/or monthly payments not set to zero. Based on a marker in the data regarding a student loan’s repayment status, we flag federal loans that had defaulted in the seven years before the pandemic and classify these individuals as having potentially benefited from the erasure of their student loan default history. (Based on our method of identifying federal loans, we estimate $1.38 trillion in federally owned debt outstanding as of 2023:Q3, which is close to the $1.36 trillion reported by the US Department of Education.
- We do not know when such SLHs would have come out of deferment absent the policy change.
- For simplicity, we use the term “forbearance” to refer to any period when payments on a student loan are suspended but interest still accrues, and we use the term “deferment” to denote when payments are suspended and additional interest does not accrue. The US Department of Education uses somewhat more nuanced definitions of forbearance and deferment, as a small number of loan types fall under slightly different rules during forbearance.
- We exclude borrowers with only private student loans from our comparison, even though they too were unaffected by the pause, because they may be inherently different from borrowers without any student loans.
- The credit scores we discuss and use are Equifax Risk Scores in the CCP. Equifax scores are highly correlated with, though can differ from, FICO scores, which are used by the majority of lenders (for more details, see https://www.equifax.com/personal/help/article-list/-/h/a/what-is-difference-between-fico-score-and-equifax-credit-score/). Note also that an individual’s age and credit score are the only demographic information available.
- Katz (2024) investigates what individuals did in response to both their economic stimulus receipts and the student loan payment pause and finds that they tended to repay their student loans as a result of the payment pause, but not from their stimulus checks.
- Card issuers often will raise borrowers’ credit limits without a request when their reported income increases or their payment history improves.
- The relative gains in credit capacity for SLHs hold even after we control for borrower characteristics and other factors.
- In accordance with Equifax credit score categories (see https://www.equifax.com/personal/education/credit/score/articles/-/learn/credit-score-ranges/), individuals with “poor” credit have scores from 300 to 579, “fair” credit from 580 to 669, “good” credit from 670 to 739, “very good” credit from 740 to 799, and “excellent” credit 800 and higher. The results are qualitatively very similar if we look at the differential effects separately for each rating group.
- This is indeed the case if we tabulate delinquencies and defaults on other types of debt before 2019 by credit score group.
References
Dinerstein, Michael, Constantine Yannelis, and Ching-Tse Chen. 2024. “Debt Moratoria: Evidence from Student Loan Forbearance.” American Economic Review: Insights 6(2): 196–213. DOI: http://dx.doi.org/10.1257/aeri.20230032
Katz, Justin. 2024. “Saving and Consumption Responses to Student Loan Forbearance.” Harvard University. http://dx.doi.org/10.2139/ssrn.4344262
Kosar, Gizem, Davide Melcangi, Laura Pilossoph, and David Wiczer. 2023. “Stimulus through Insurance: The Marginal Propensity to Repay Debt.” Federal Reserve Bank of New York Staff Reports No. 1065. https://www.newyorkfed.org/research/staff_reports/sr1065
Mezza, Alvaro, Daniel Ringo, and Kamila Sommer. 2024. “Student Loans, Access to Credit, and Consumer Credit Demand.” The Review of Financial Studies 37(12): 3761–3801. https://doi.org/10.1093/rfs/hhae046

 About the Authors
Daniel H. Cooper,
Federal Reserve Bank of Boston
Daniel H. Cooper is a vice president and economist in the research department at the Federal Reserve Bank of Boston.
Email: Daniel.Cooper@bos.frb.org
Maddie Haddix,
Federal Reserve Bank of Boston
Maddie Haddix is a senior research assistant in the Federal Reserve Bank of Boston Research Department.
Email: Maddie.Haddix@bos.frb.org
Resources
Site Topics
Keywords
- student loans ,
- payment pause ,
- consumer credit behavior ,
- credit cards
JEL Codes
- H81 ,
- G51 ,
- I22
Citation
Cooper, Daniel H., and Maddie Haddix. 2025. “How the Student Loan Payment Pause Affected Borrowers’ Credit Access and Credit Use.” Federal Reserve Bank of Boston Current Policy Perspectives.