New England Economic Conditions through October 17, 2023 


Key Takeaways
- Nonfarm payroll employment in New England has fully recovered from the COVID-19 pandemic, with its August figure 0.4 percent higher than the February 2020 figure. However, job recovery has been uneven across states and sectors. Employment levels in Rhode Island and Vermont are still about 3 percent lower than their pre-pandemic values. The leisure and hospitality sector remains 6 percent below its pre-pandemic level. In addition, the New England and US job-openings rates continue trending downward while staying above their February 2020 levels.
- At 2.7 percent, the unemployment rate in New England for August 2023 was lower than both the national rate and the region’s pre-pandemic level. In each New England state, the unemployment rate is now lower than the US unemployment rate. In particular, New Hampshire and Vermont hold the second-lowest rates in the country.
- Labor force participation in New England still has not returned to its pre-pandemic level. Data suggest that workers near retirement age (55 to 64) experienced the largest drop in labor force participation and that female prime-age workers had a larger decline in participation compared with male prime-age workers.
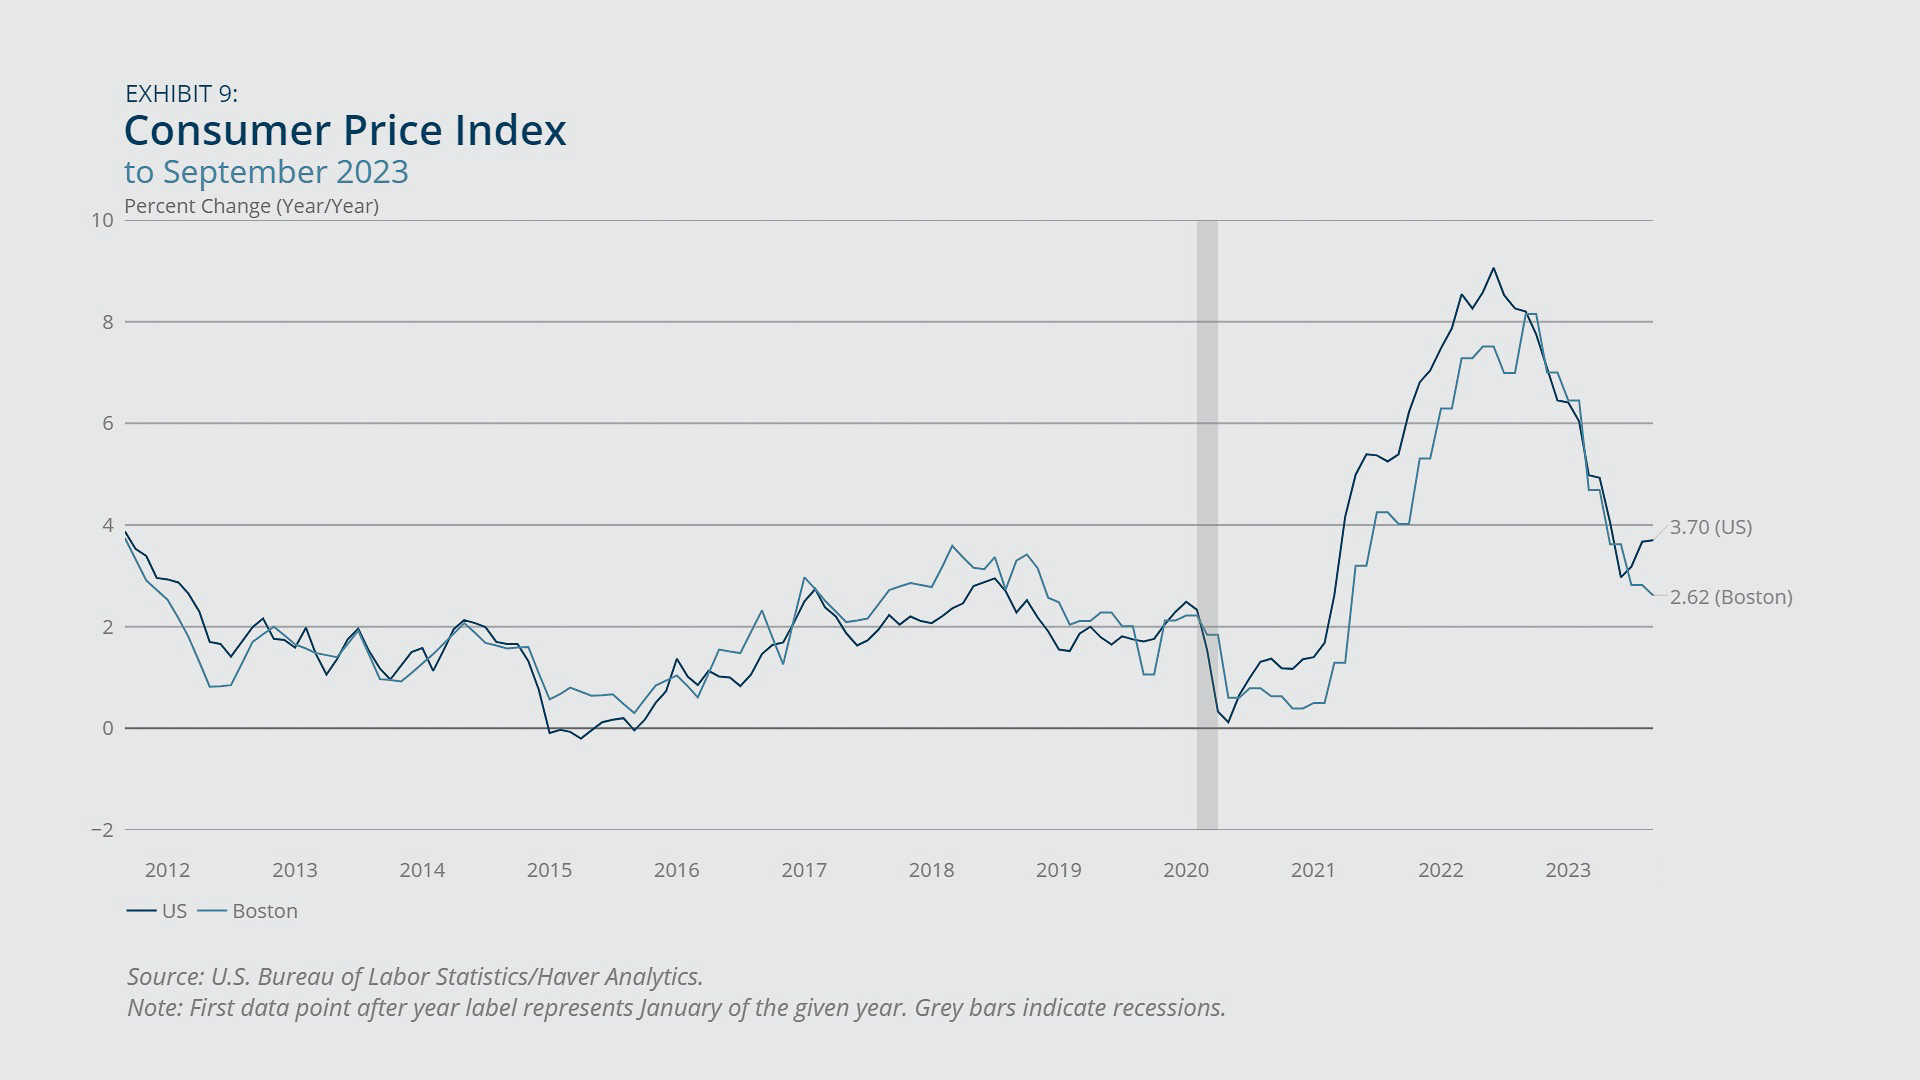
- The Boston area has experienced a steady decline in overall inflation since last fall. The year-over-year change in the Consumer Price Index (CPI) for Boston in September 2023 was 2.6 percent, which was 1.1 percentage points lower than the national inflation rate. The overall price increase was largely driven by a 6.9 percent rise in shelter prices, which was partially offset by a 31.8 percent decrease in natural gas prices and a 7.4 percent drop in prices for used cars and trucks.
Sign up for new research and data on the New England economy.
Payroll Employment
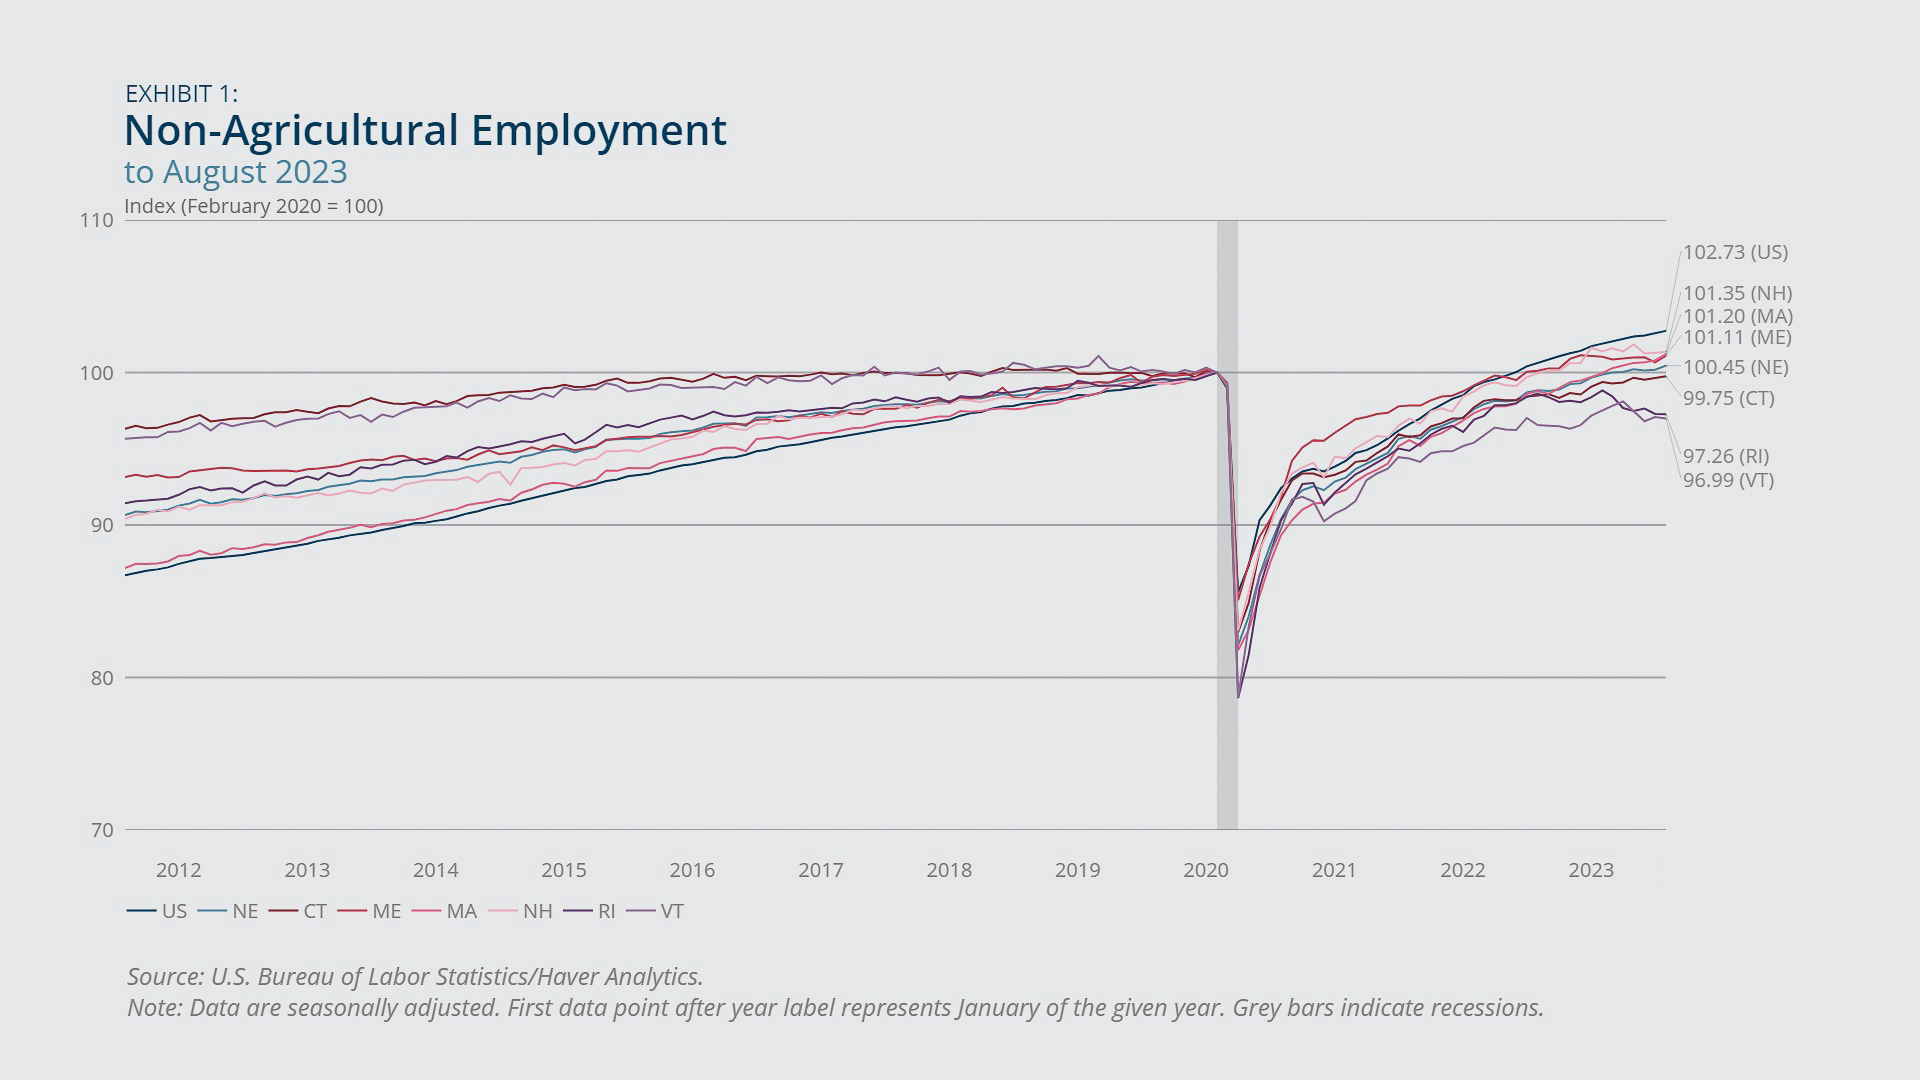
- Total payroll employment in New England continues to grow and has fully recovered from the COVID-19 pandemic.
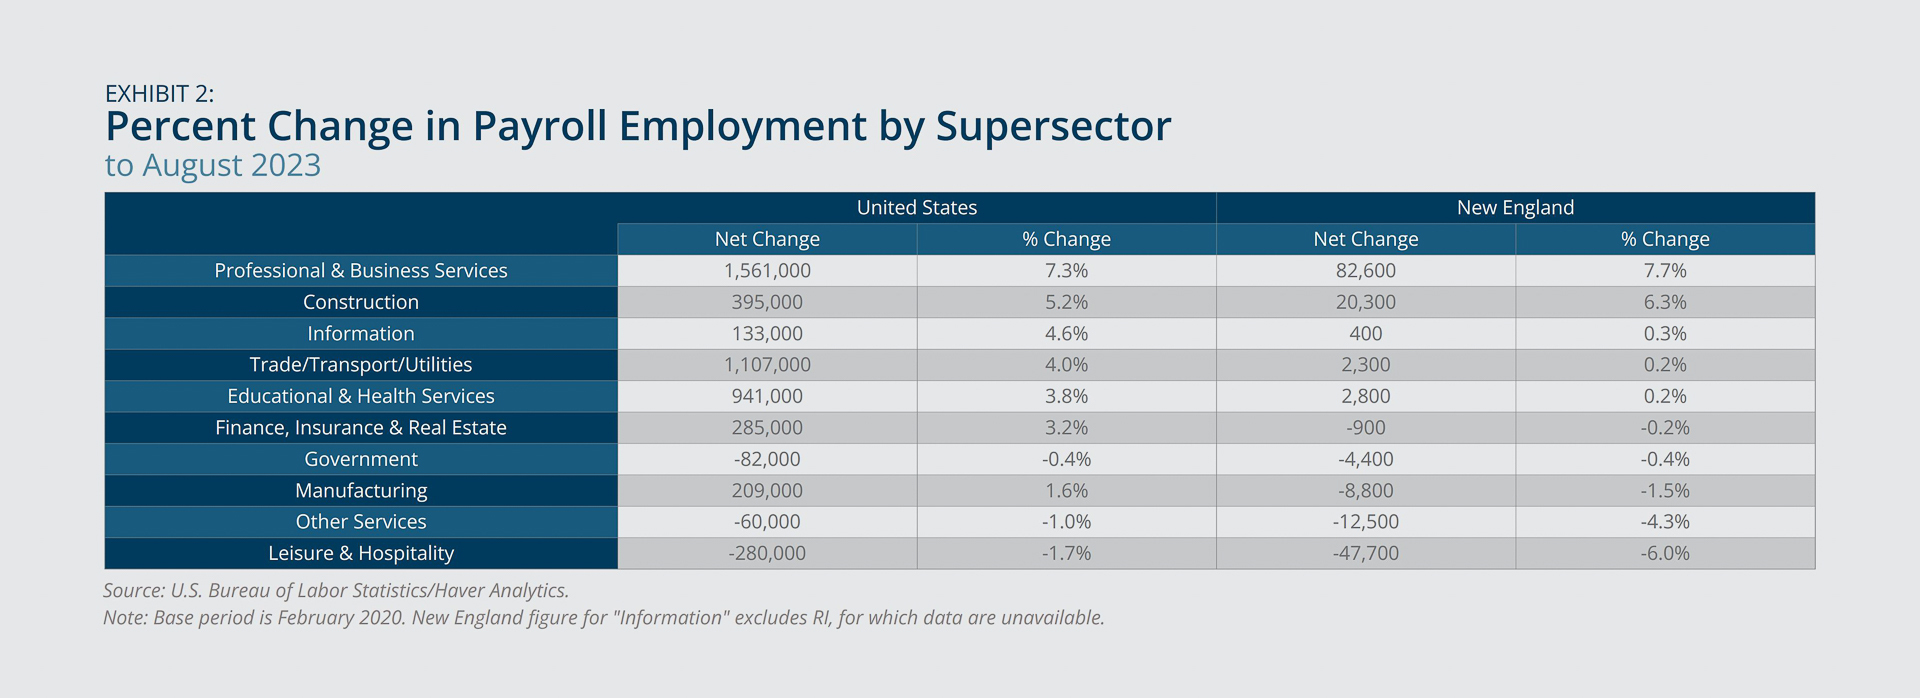
- The recovery is uneven across sectors, with employment in the leisure and hospitality sector remaining 6 percent below its pre-pandemic level.
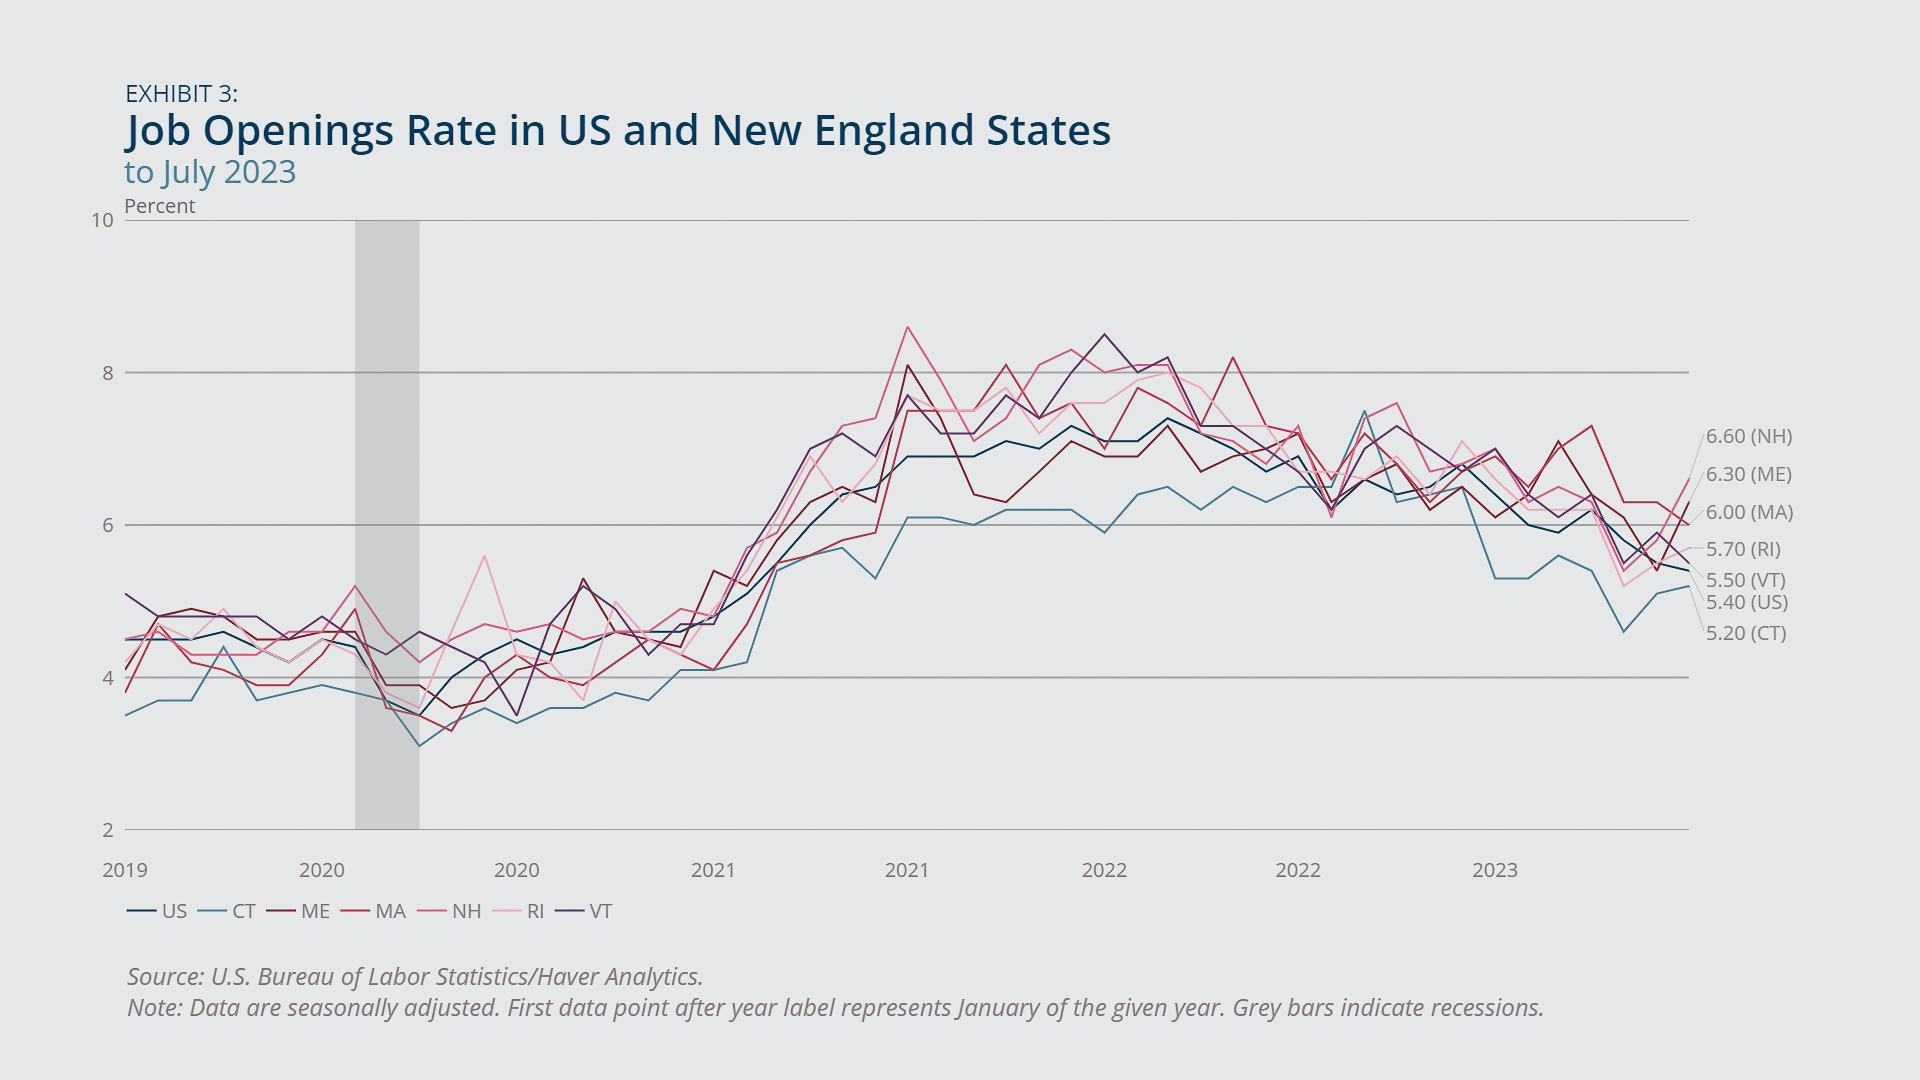
- Job-openings rates continue trending downward but remain above the February 2020 rates for both the region and the country.
New England continued to see growth in nonfarm payroll employment in the 12-month period leading up to August 2023, but the region’s recovery from the COVID-19 pandemic remained behind the nation’s (Exhibit 1). Both the United States and the region have returned to their pre-pandemic employment levels; the employment figures for the country and New England were 2.7 percent and 0.4 percent higher, respectively, in August 2023 compared with February 2020. New Hampshire, Massachusetts, and Maine passed their pre-pandemic values. Connecticut almost reached its pre-pandemic employment level, while Rhode Island and Vermont were still down about 3 percent.
Among job supersectors, professional and business; construction; information; trade, transportation, and utilities; and education and health services surpassed their February 2020 employment levels in New England (Exhibit 2). Within the education and health services sector, health employment reached its pre-pandemic level, and education employment surpassed its level. On the other hand, employment in the leisure and hospitality sector remained 6 percent below its pre-pandemic level in the region. This sector continues to face difficulty in recruiting and retaining employees, as workers find more opportunities in other sectors for better pay, more flexible hours, and greater job stability.1 In addition, all supersectors in the region, except professional and business, construction, and government, performed worse than their national counterparts in job recovery from the pandemic.
Job-openings rates continue trending downward both in New England and across the country (Exhibit 3). The US job-openings rate in July 2023 was down 1.5 percentage points compared with a year earlier. The year-over-year declines were smaller for the New England states, ranging from 0.7 percentage point for New Hampshire to 1.3 percentage points for Connecticut. Nevertheless, the job-openings rates for the US and each of the New England states in July 2023 were at least 1 percentage point higher than their February 2020 rates.

Federal Reserve Bank of Boston
Federal Reserve Bank of Boston
Federal Reserve Bank of Boston
Unemployment
- The unemployment rate in every New England state in August was lower than the US rate, with New Hampshire and Vermont seeing the second-lowest rates in the country.
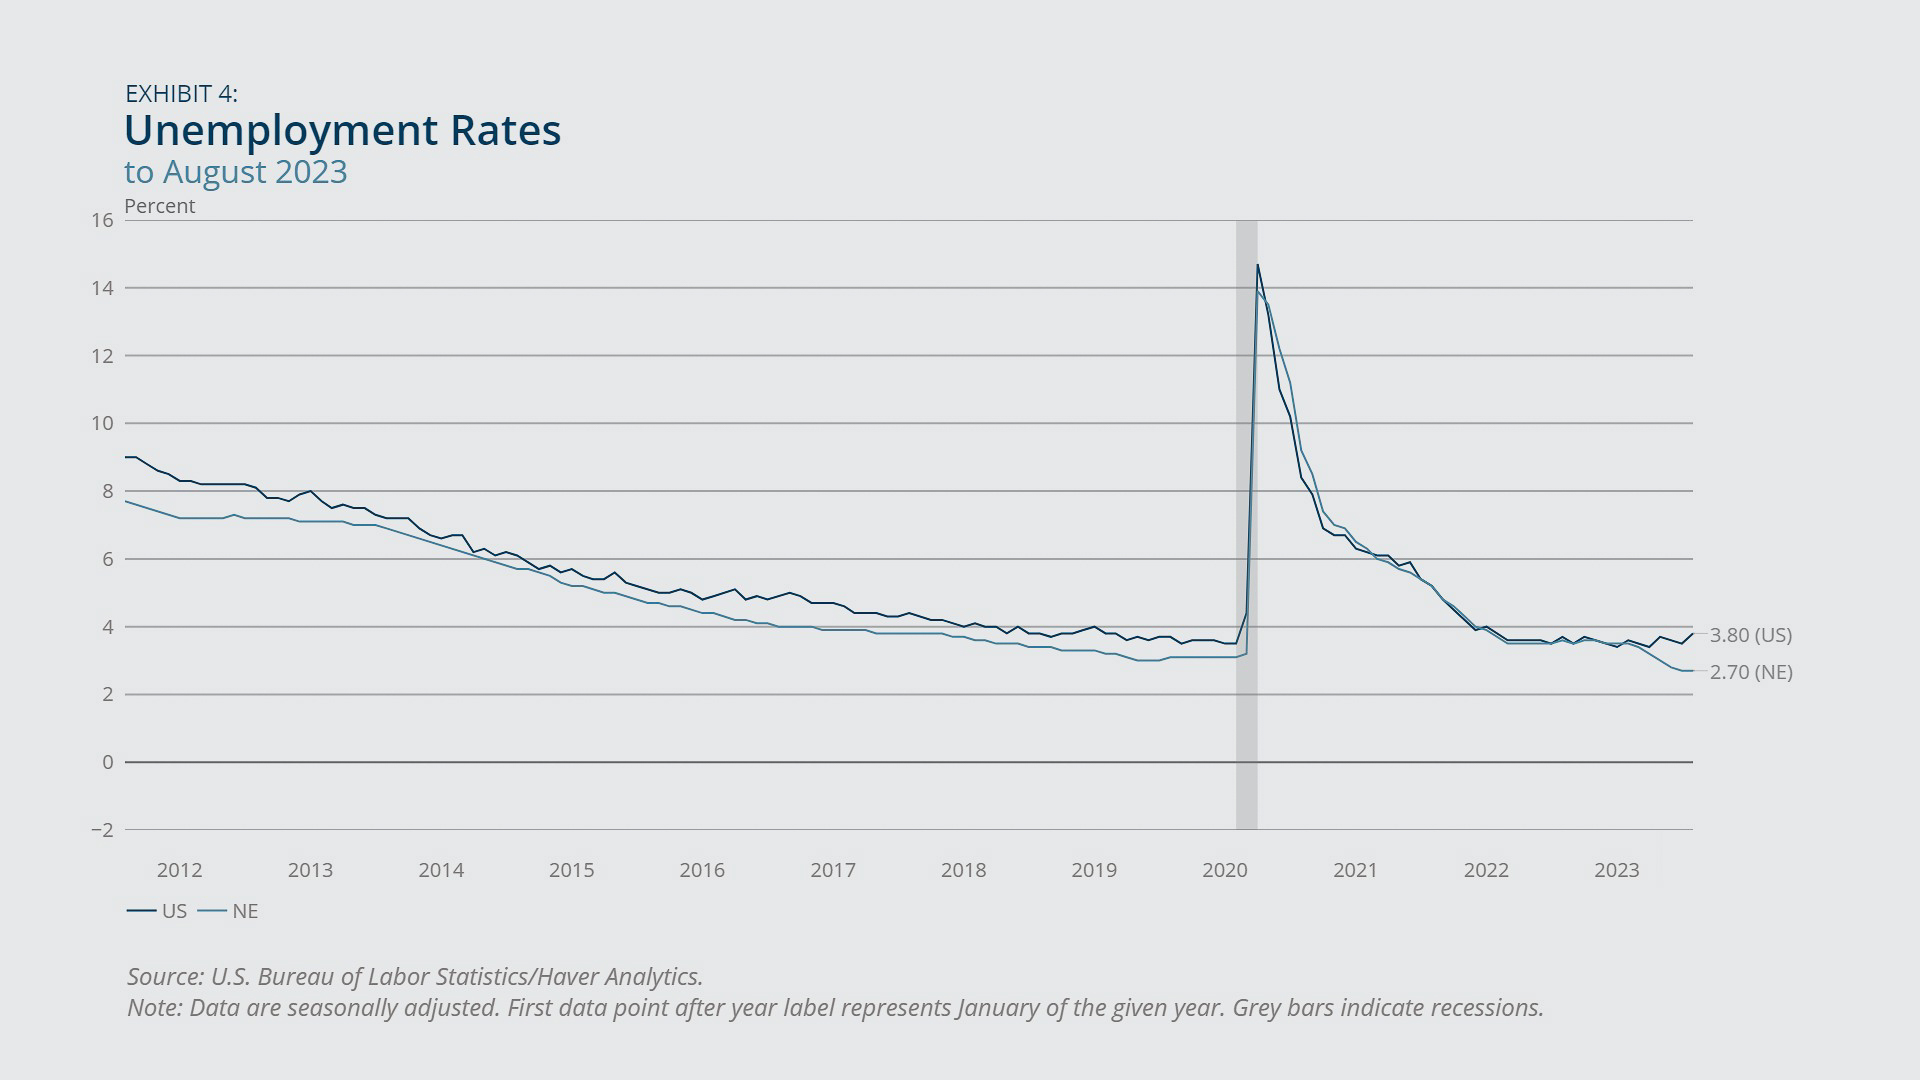
- The New England states all saw their unemployment rates drop below pre-pandemic values.
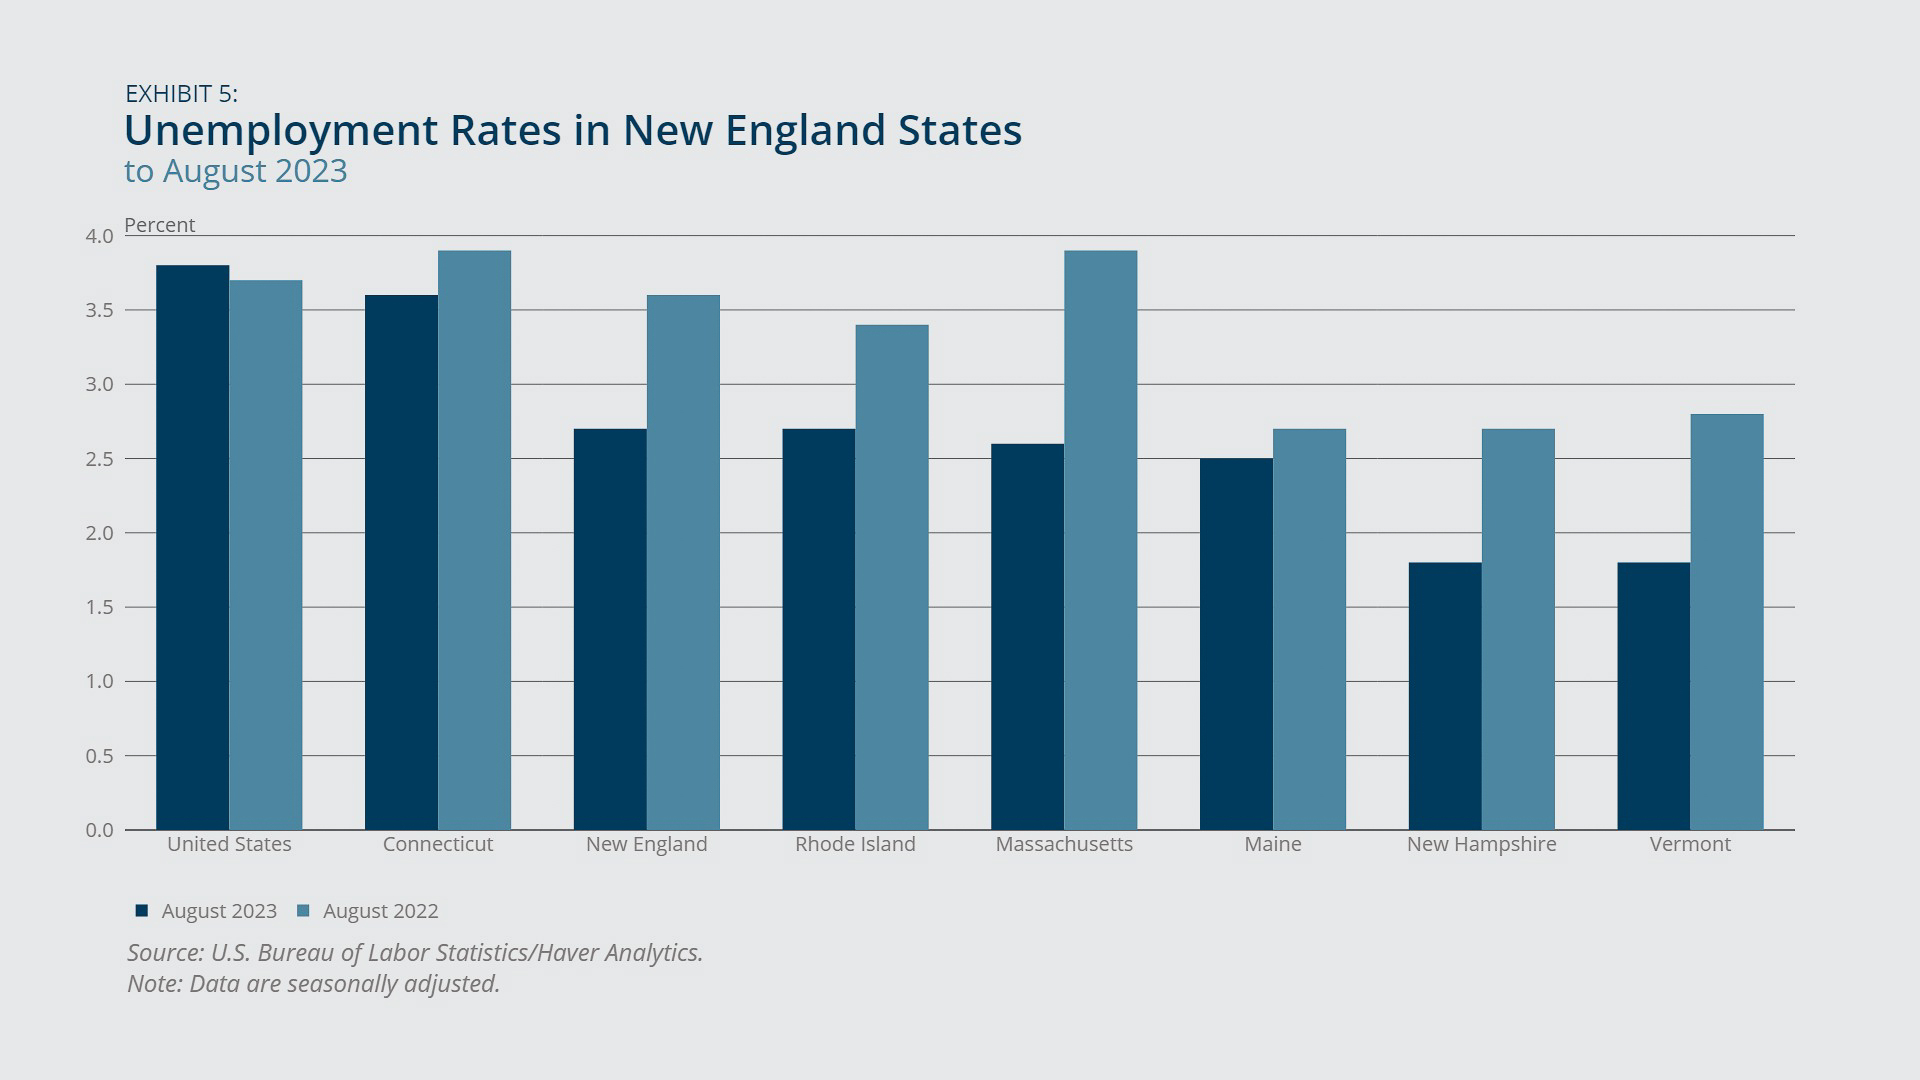
The unemployment rate in New England continued to decline (Exhibit 4). It stood at 2.7 percent and was 1.1 percentage points lower than the national rate in August 2023.
Every state in the region now has a lower rate than the national rate (Exhibit 5). In August 2023, New Hampshire and Vermont had the lowest unemployment rates in the region at 1.8 percent. Their rates were the second-lowest in the country. Maryland had the lowest rate at 1.7 percent.
While the August unemployment rate for the United States was 0.3 percentage point higher than its February 2020 level, all of the New England states saw their unemployment rates drop below pre-pandemic values. The decline from February 2020 ranged from 0.2 percentage point for Massachusetts to 1 percentage point for Rhode Island.
Federal Reserve Bank of Boston
Federal Reserve Bank of Boston
Labor Force Participation
- Labor force participation in New England remains well below the pre-pandemic level.
- Workers near retirement age experienced the largest drop in labor force participation in the region.
- The decline in labor force participation was greater for female prime-age workers than for male prime-age workers.
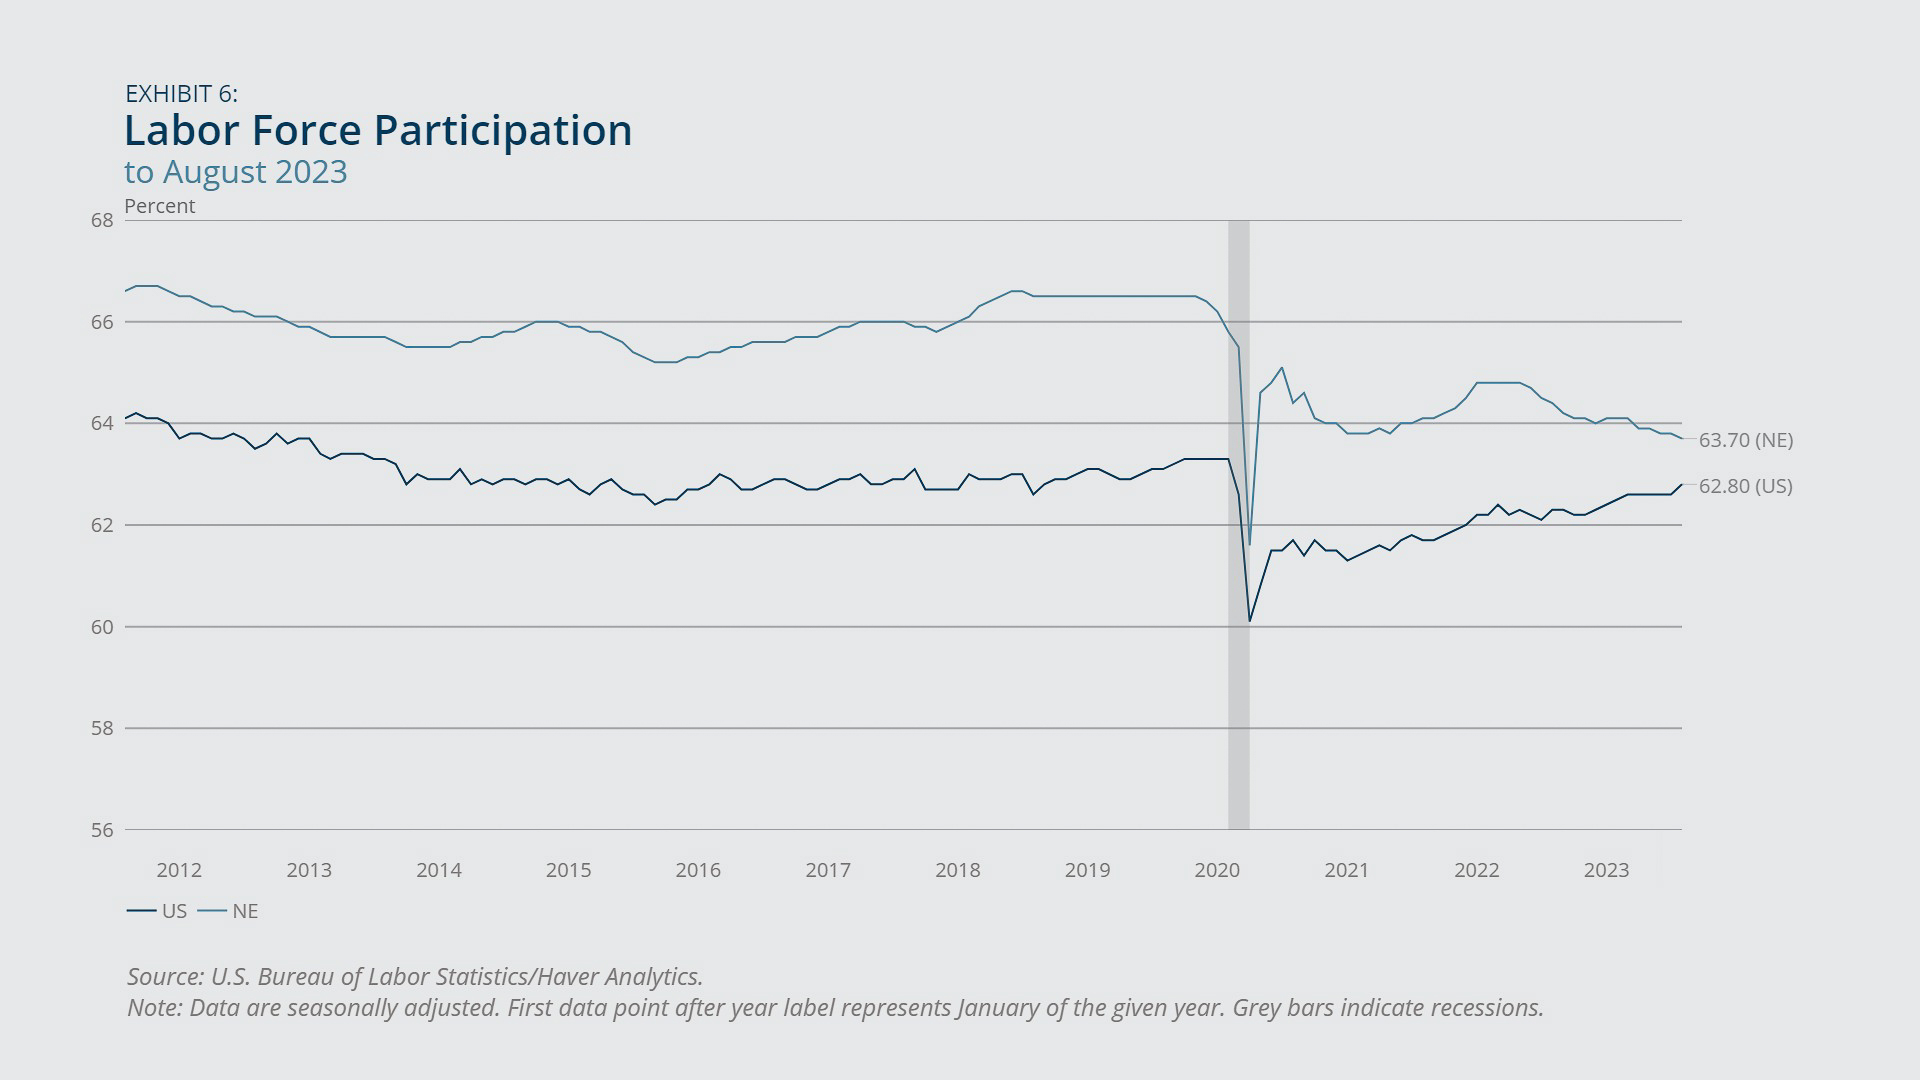
Despite a significant improvement since its lowest point during the pandemic, labor force participation remained below its February 2020 level for both the United States and New England (Exhibit 6). The county’s labor force participation rate was closer than the region’s to its pre-pandemic level, with a gap of 0.5 percentage point versus a gap of 2.2 percentage points for New England. Among the New England states, the drop from February 2020 ranged from 0.9 percentage point for Rhode Island to 3.9 percentage points for New Hampshire.
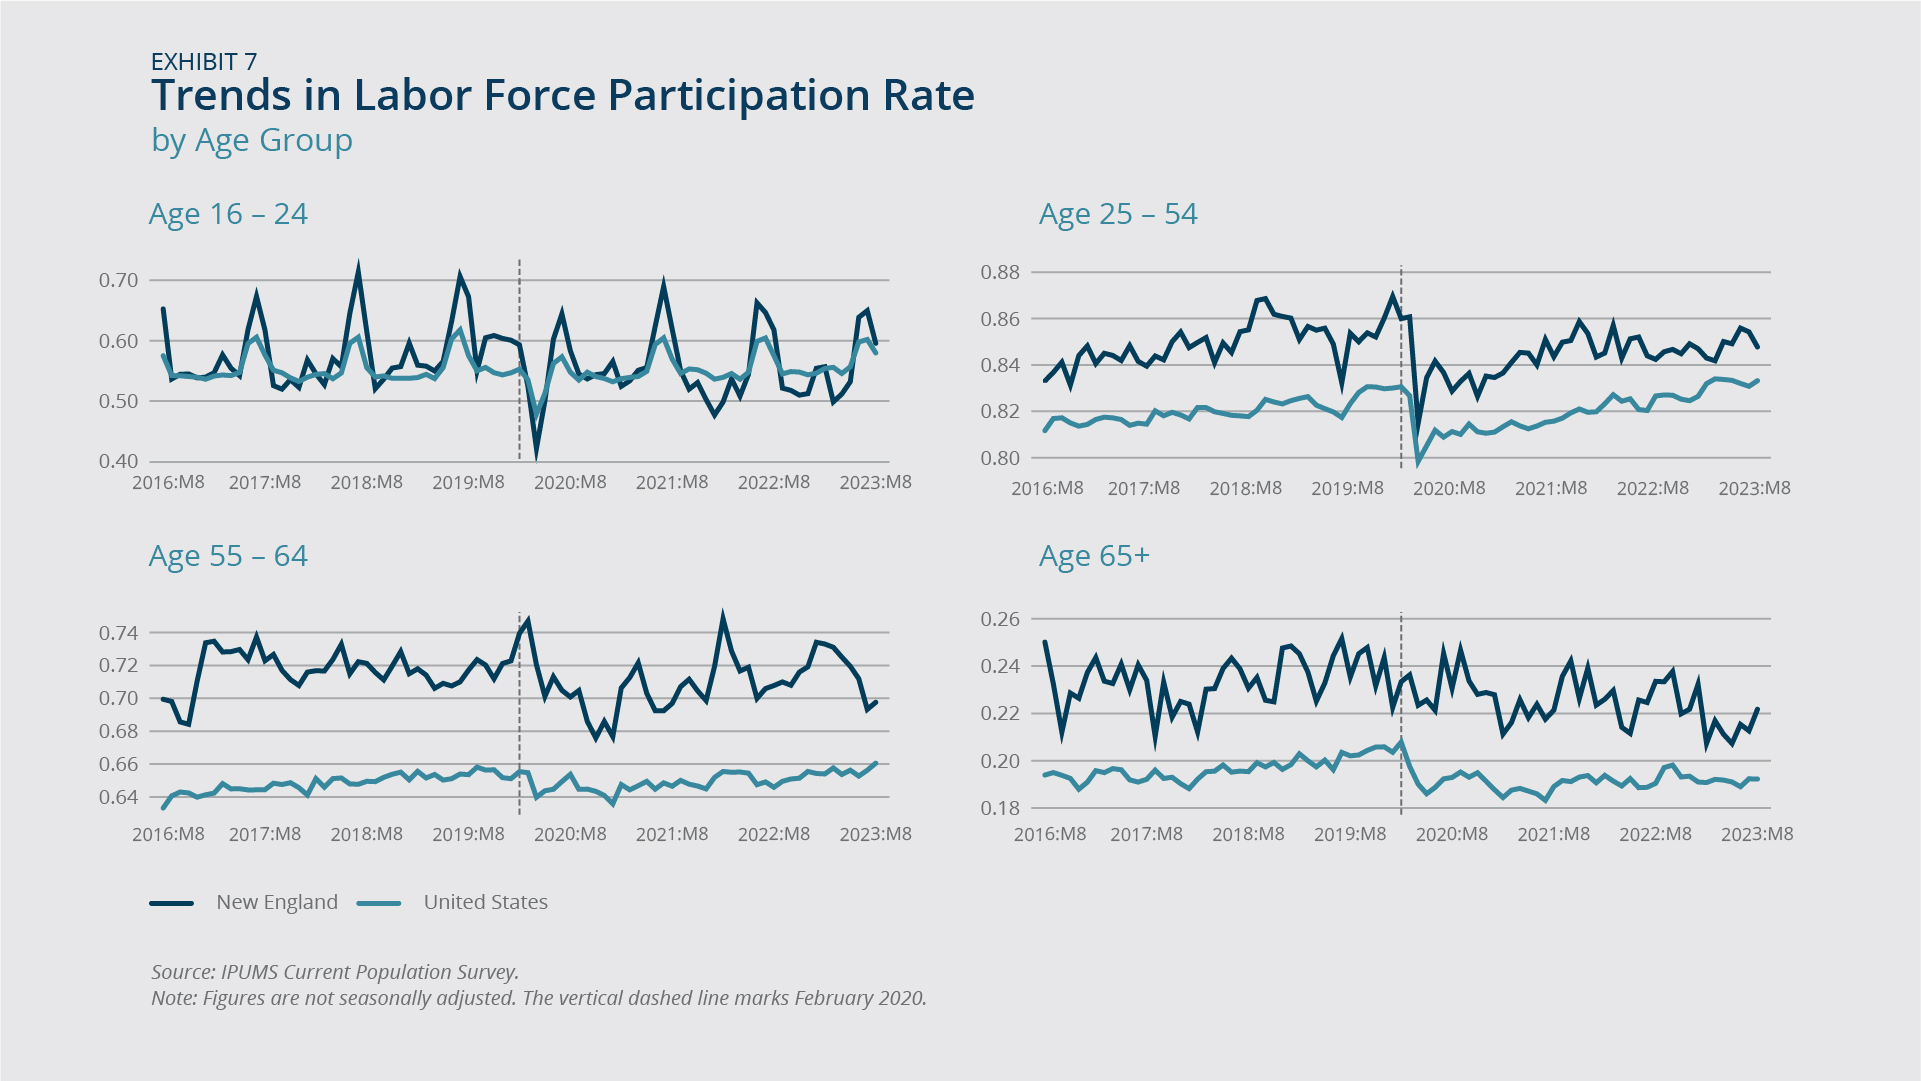
Using Current Population Survey (CPS) data, Exhibit 7 shows the non-seasonally adjusted monthly labor force participation rates for different age groups (16 to 24, 25 to 54, 55 to 64, and 65-plus) in New England and the United States through August 2023. Except for the 16–24 age group, labor force participation rates for all age groups in New England have not returned to their February 2020 levels. The 55–64 age group experienced the largest drop. By contrast, national labor force participation rates for all age groups except for 65-plus were above their pre-pandemic levels in August 2023.
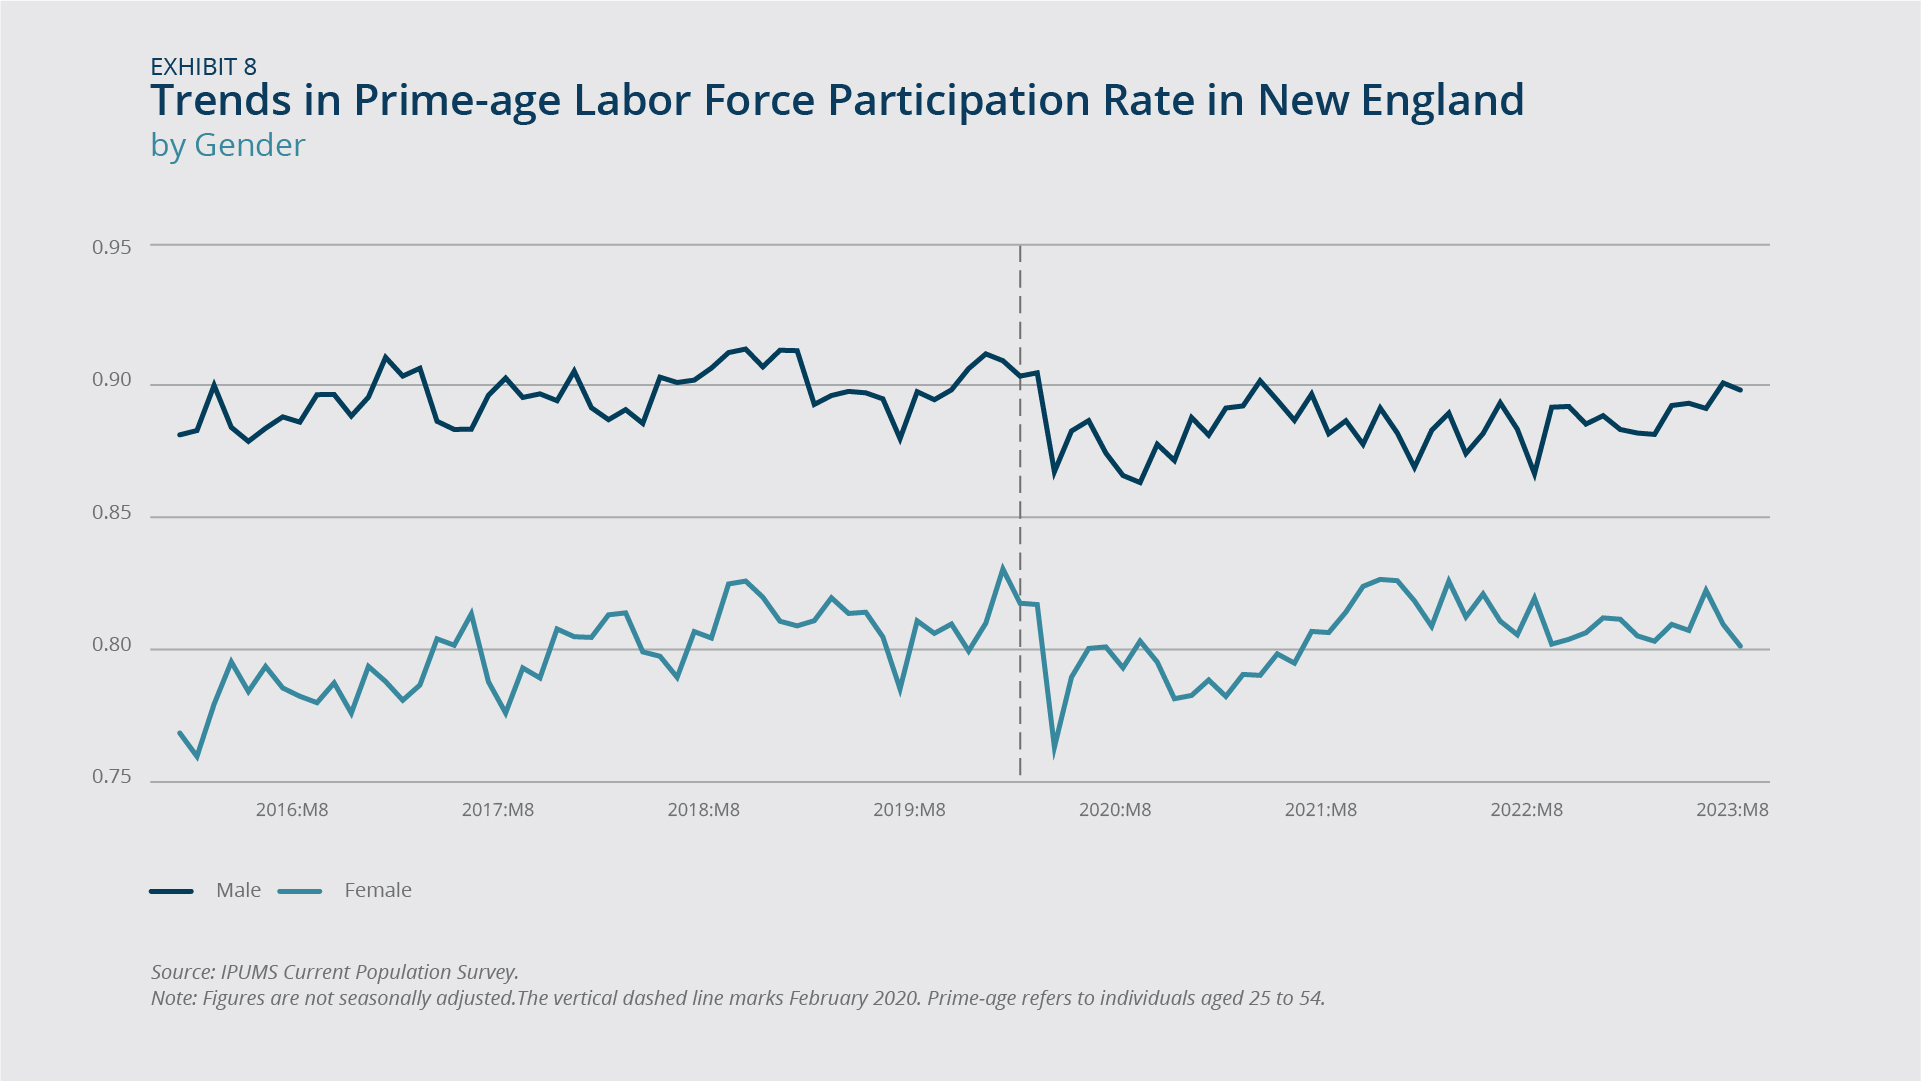
Among New England prime-age workers (aged 25 to 54), the female group experienced a larger decline than the male group from February 2020 to August 2023 (Exhibit 8). The labor force participation rate for prime-age females in August 2023 was 1.6 percentage points below its February 2020 rate, while the gap for prime-age males was 0.5 percentage point. However, each group’s rate in August 2023 was slightly higher than its average rate for the 48 months leading up to the start of the pandemic.
Federal Reserve Bank of Boston
Federal Reserve Bank of Boston
Federal Reserve Bank of Boston
Inflation
- Boston’s overall inflation has remained above 2 percent but steadily declined since last fall.
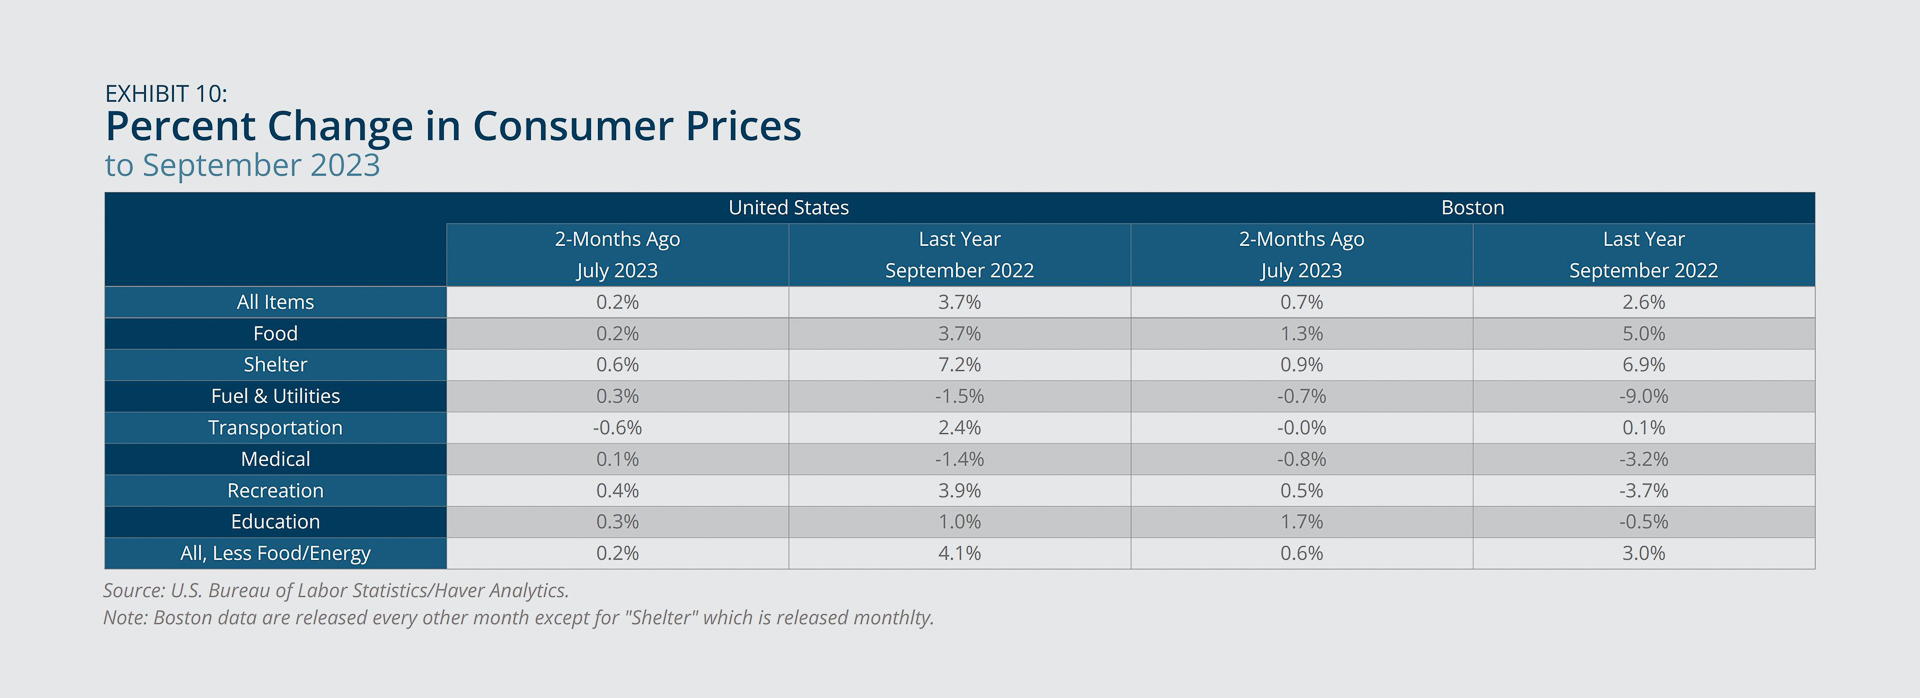
- Boston experienced both a large year-over-year increase in shelter prices and a large decrease in natural gas prices.
Boston has seen a steady decrease in overall inflation since September 2022 (Exhibit 9). The year-over-year consumer price change for Boston was 2.6 percent for September 2023. It was lower than the national rate of 3.7 percent, as the latter ticked back up from 3.0 percent in June 2023.
Boston’s overall inflation was largely driven by a 6.9 percent rise in shelter prices (Exhibit 10). Food prices also rose, climbing 5 percent in the last 12 months. In the sub-categories within fuels and utilities and transportation (not shown in Exhibit 10), Boston experienced a 31.8 percent decrease in natural gas prices and a 7.4 percent drop in prices for used cars and trucks.2 Gasoline prices were unchanged compared with a year earlier.
Federal Reserve Bank of Boston
Federal Reserve Bank of Boston
Consumer Confidence
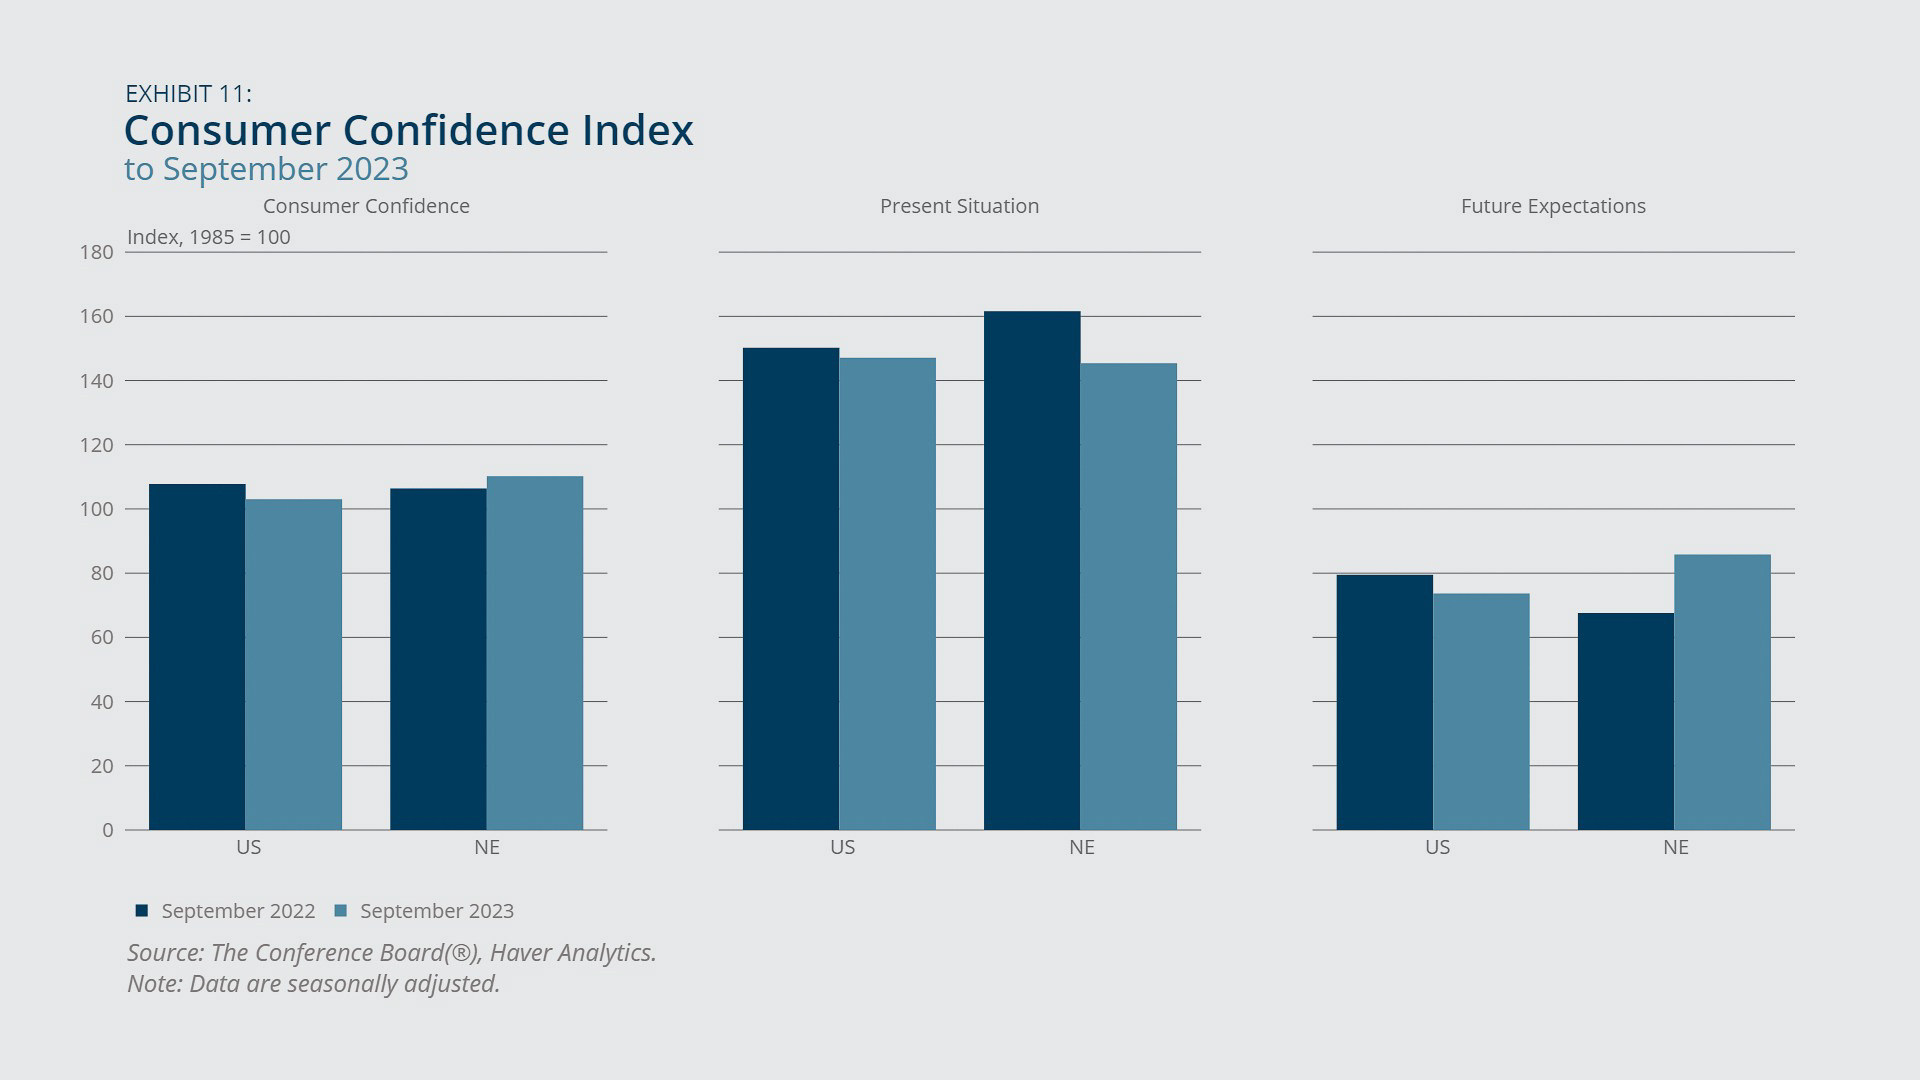
- New England consumers’ confidence has improved compared with a year prior.
- The region’s consumers were more optimistic about the short-term economic outlook.
Consumer confidence in New England increased year-over-year through September 2023 (Exhibit 11). The increase was entirely driven by consumers’ rising future expectations. By contrast, the United States as a whole saw a decline in consumer confidence during this period. Nationwide, consumers were less satisfied with the present situation and were less optimistic about the short-term economic outlook than they were a year earlier. The Conference Board reports that “consumers continued to be preoccupied with rising prices in general, and for groceries and gasoline in particular.”3
Federal Reserve Bank of Boston
Endnotes
- See Kenneth R. Gosselin, “CT’s Hotels Face a Worker Shortage, with More than 4,000 Job Openings in the State,” Hartford Courant, June 19, 2023; Alicia Hoisington, “Staffing Shortages Persist Despite Hiring Efforts, Record Wages,” Hotel Management, June 12, 2023; Stephanie Ferguson, “Understanding America’s Labor Shortage: The Most Impacted Industries,” US Chamber of Commerce, August 10, 2023; Abha Bhattarai and Maggie Penman, “Restaurants Can’t Find Workers Because They’ve Found Better Jobs,” Washington Post, February 3, 2023.
- U.S. Bureau of Labor Statistics. October 12, 2023. “Consumer Price Index, Boston-Cambridge-Newton — September 2023.” https://www.bls.gov/regions/northeast/news-release/ConsumerPriceIndex_Boston.htm (Accessed October 16, 2023).
- The Conference Board. September 26, 2023. “US Consumer Confidence Fell Again in September.” https://www.conference-board.org/topics/consumer-confidence/press/CCI-Sept-2023 (Accessed October 16, 2023).

 About the Authors
Bo Zhao,
Federal Reserve Bank of Boston
Email: Bo.Zhao@bos.frb.org
Acknowledgments
Gregory Longfield, Federal Reserve Bank of Boston
Resources
Site Topics
Related Content
Improving High-Skill Immigration Policy for New England: A regional perspective on demand for H-1B visas and an exploration of potential policy improvements
New England Economic Conditions through January 9, 2024
New England Economic Conditions through April 2, 2024
New England Economic Conditions through March 5, 2024