New England Economic Conditions Through October 15, 2024 


Key Takeaways
- The unemployment rate in New England increased by 0.3 percentage point year-over-year in August 2024, reflecting changes in the labor force participation margin primarily rather than a decline in employment shares.
- Inflation in New England remained elevated in September 2024 compared with the national average, a consequence of accelerated price growth during the first half of the year. The region's recent upward inflationary trend has been driven mainly by persistently elevated inflation in shelter costs and rising inflation in medical care costs.
- House price growth has slowed for both New England and the United States since February 2024, gradually approaching pre-pandemic levels. The commercial real estate market in Boston has continued to face challenges, with vacancy rates in both downtown and suburban Boston rising faster than the national average, while office rents have remained largely stagnant.
Sign up for new research and data on the New England economy.
Payroll Employment
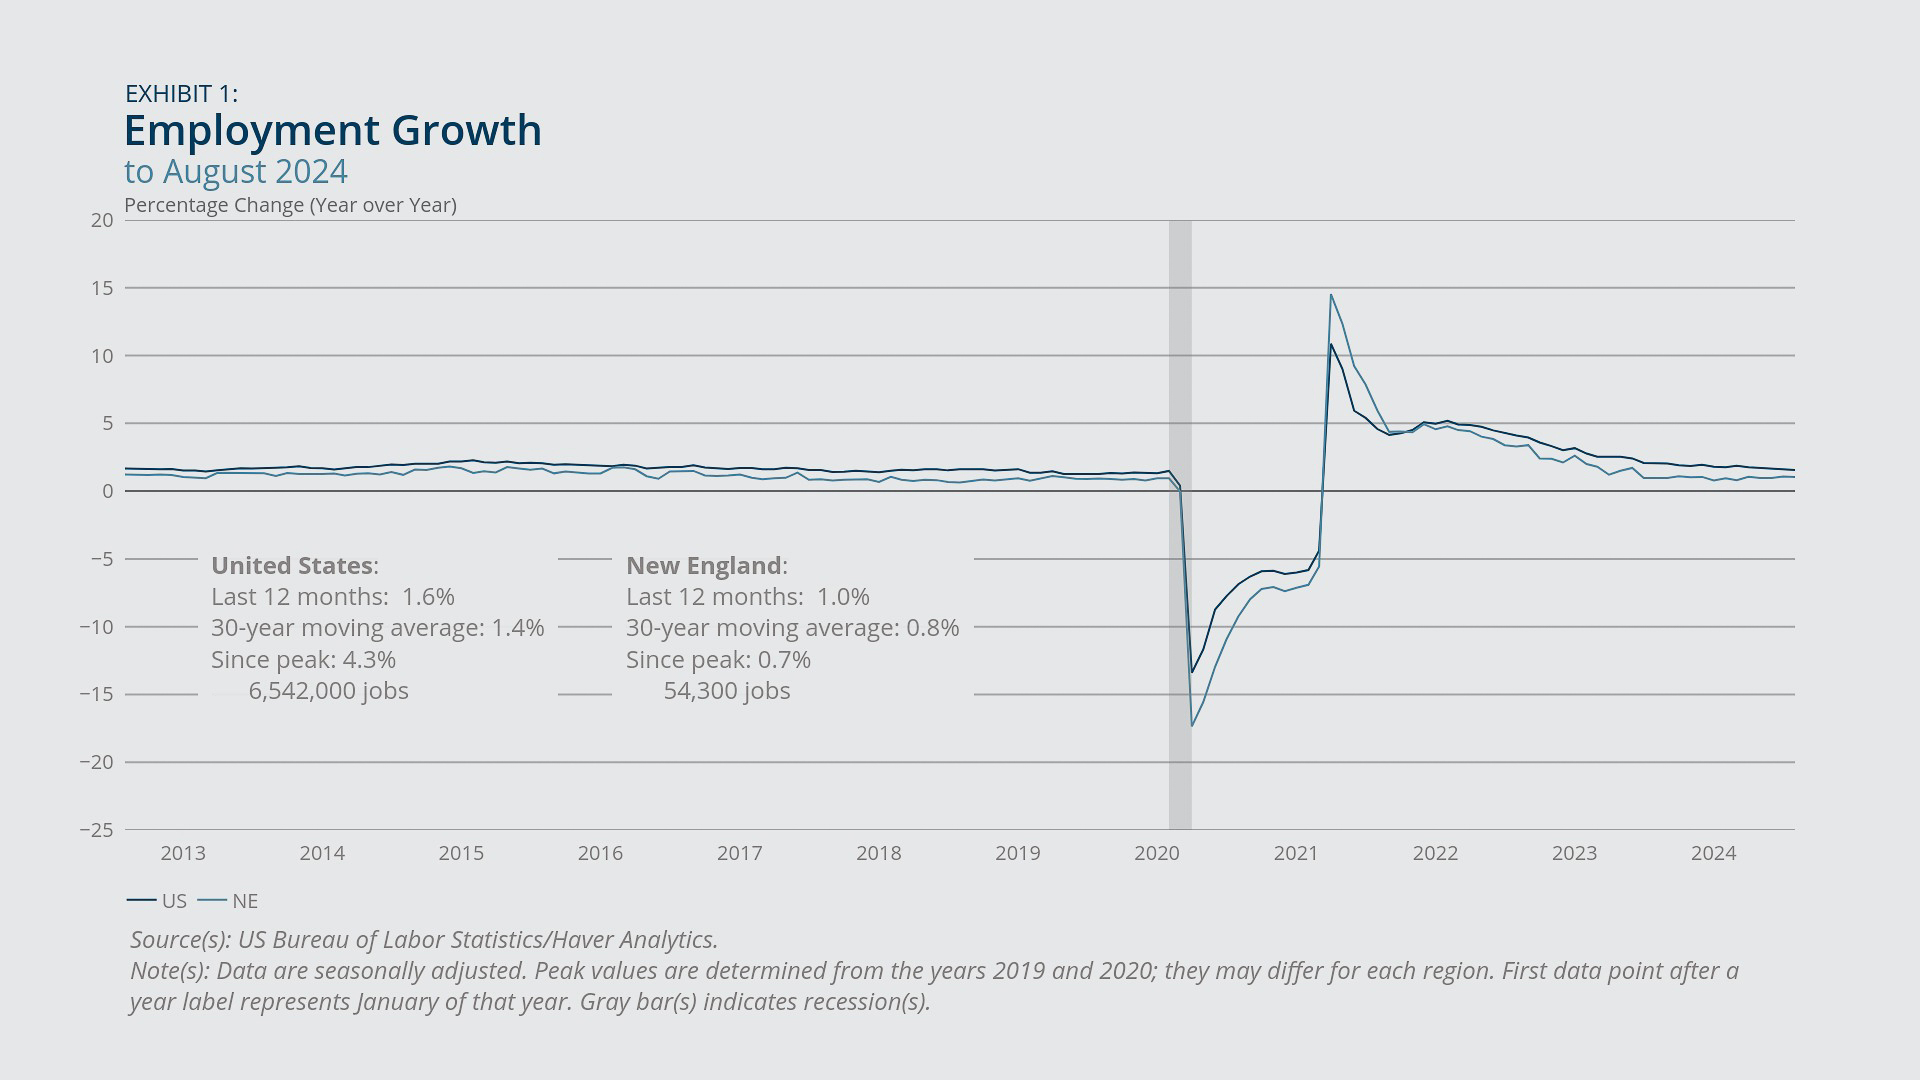
- Payroll employment growth in New England has stabilized since July 2023, with year-over-year rates hovering around 1.0 percent, which is on par with pre-pandemic rates.
- Although the region’s current and pre-pandemic employment growth rates are comparable, the geographic and sectoral drivers of that growth have shifted notably since the pre-pandemic period.
In August 2024, payroll employment in New England grew 1.0 percent year-over-year (Exhibit 1). The region's employment growth has been largely stable since July 2023, with year-over-year growth consistently measured at about 1 percent. This lower rate contrasts with the faster growth observed from April 2021 to June 2023, when the economy was recovering from pandemic-related job losses and adding jobs at a faster, but likely not sustainable, rate. The current stability suggests that the labor market has transitioned from the recovery phase to a steadier state in which employment growth is comparable to the average rate for the three years before the pandemic (Exhibit 2).
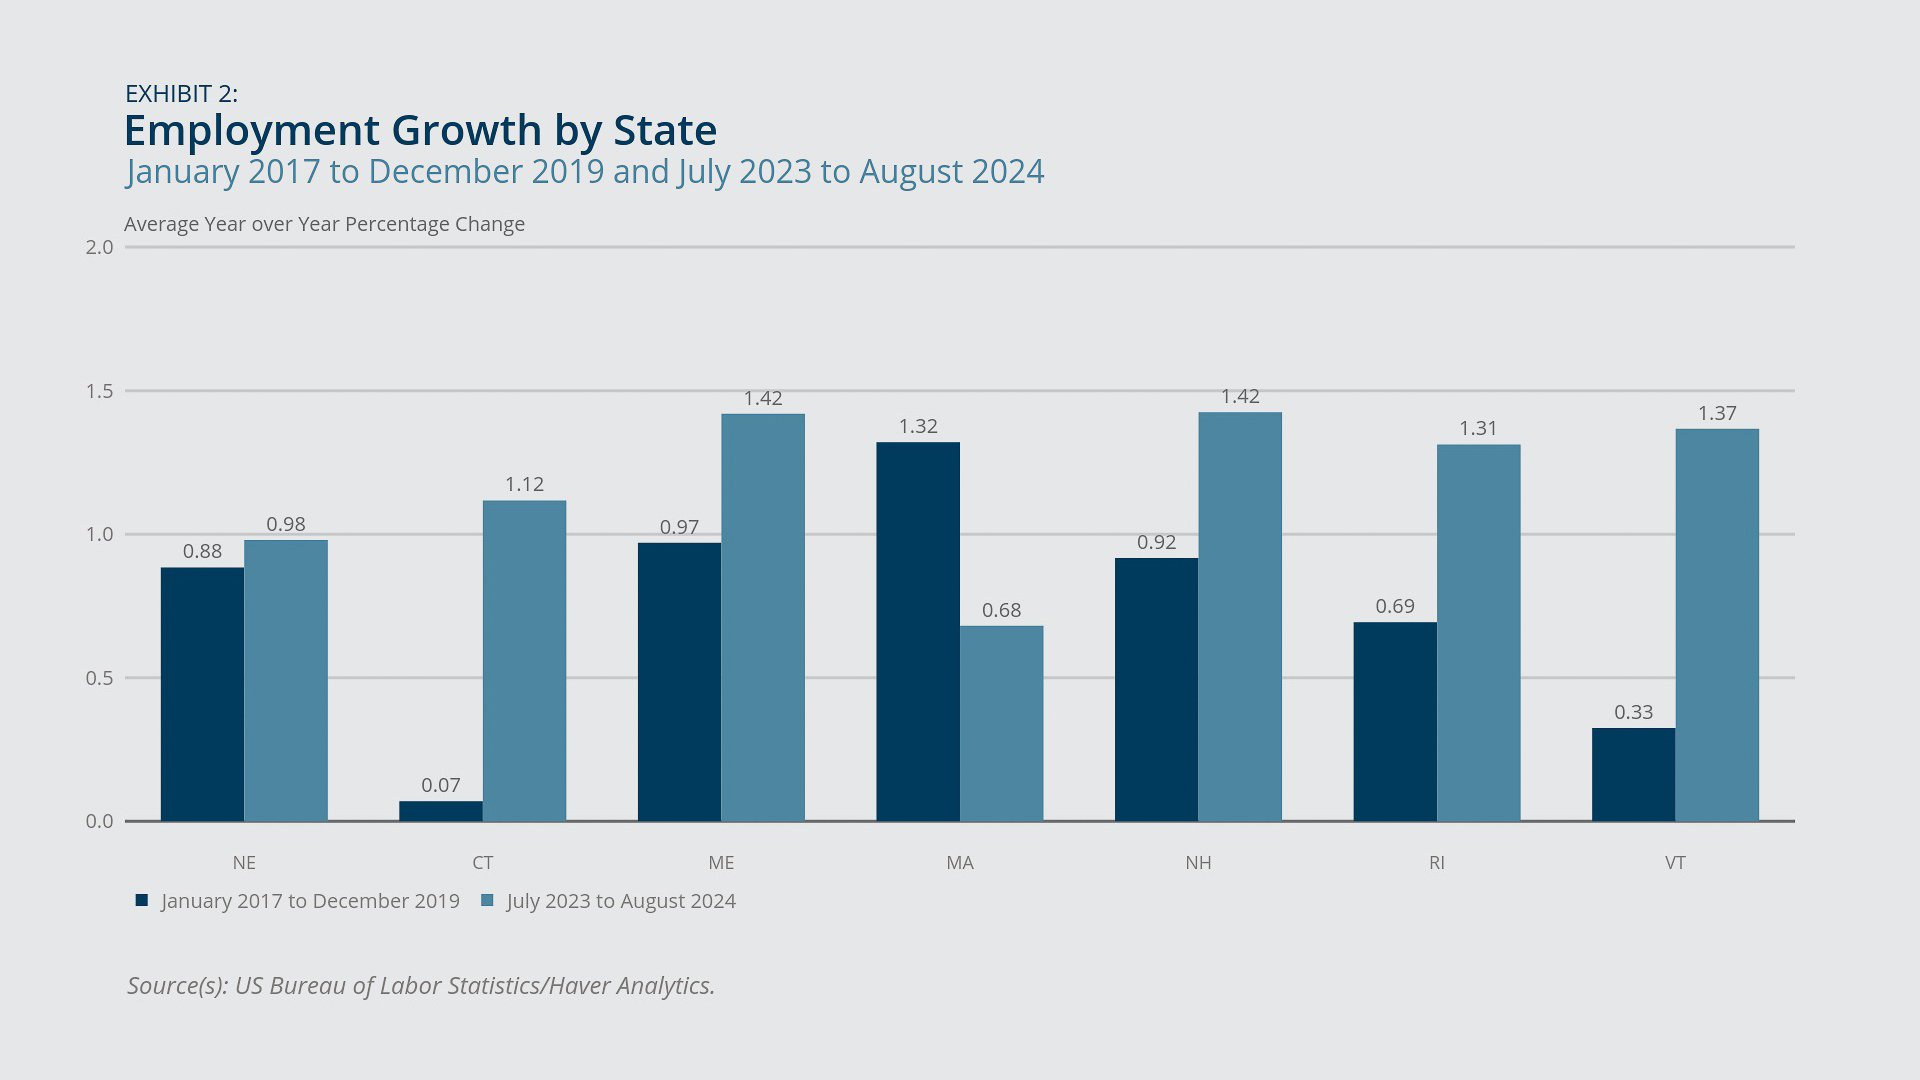
While current employment growth is comparable to the pre-pandemic rate, the geographic drivers of that growth have changed notably (Exhibit 2). From 2017 through 2019, Massachusetts led the region’s employment growth with an average monthly year-over-year rate of 1.3 percent. By contrast, from July 2023 through August 2024, the state’s average monthly year-over-year rate fell to 0.7 percent while each of the other New England states saw a significant increase from its pre-pandemic baseline rate.
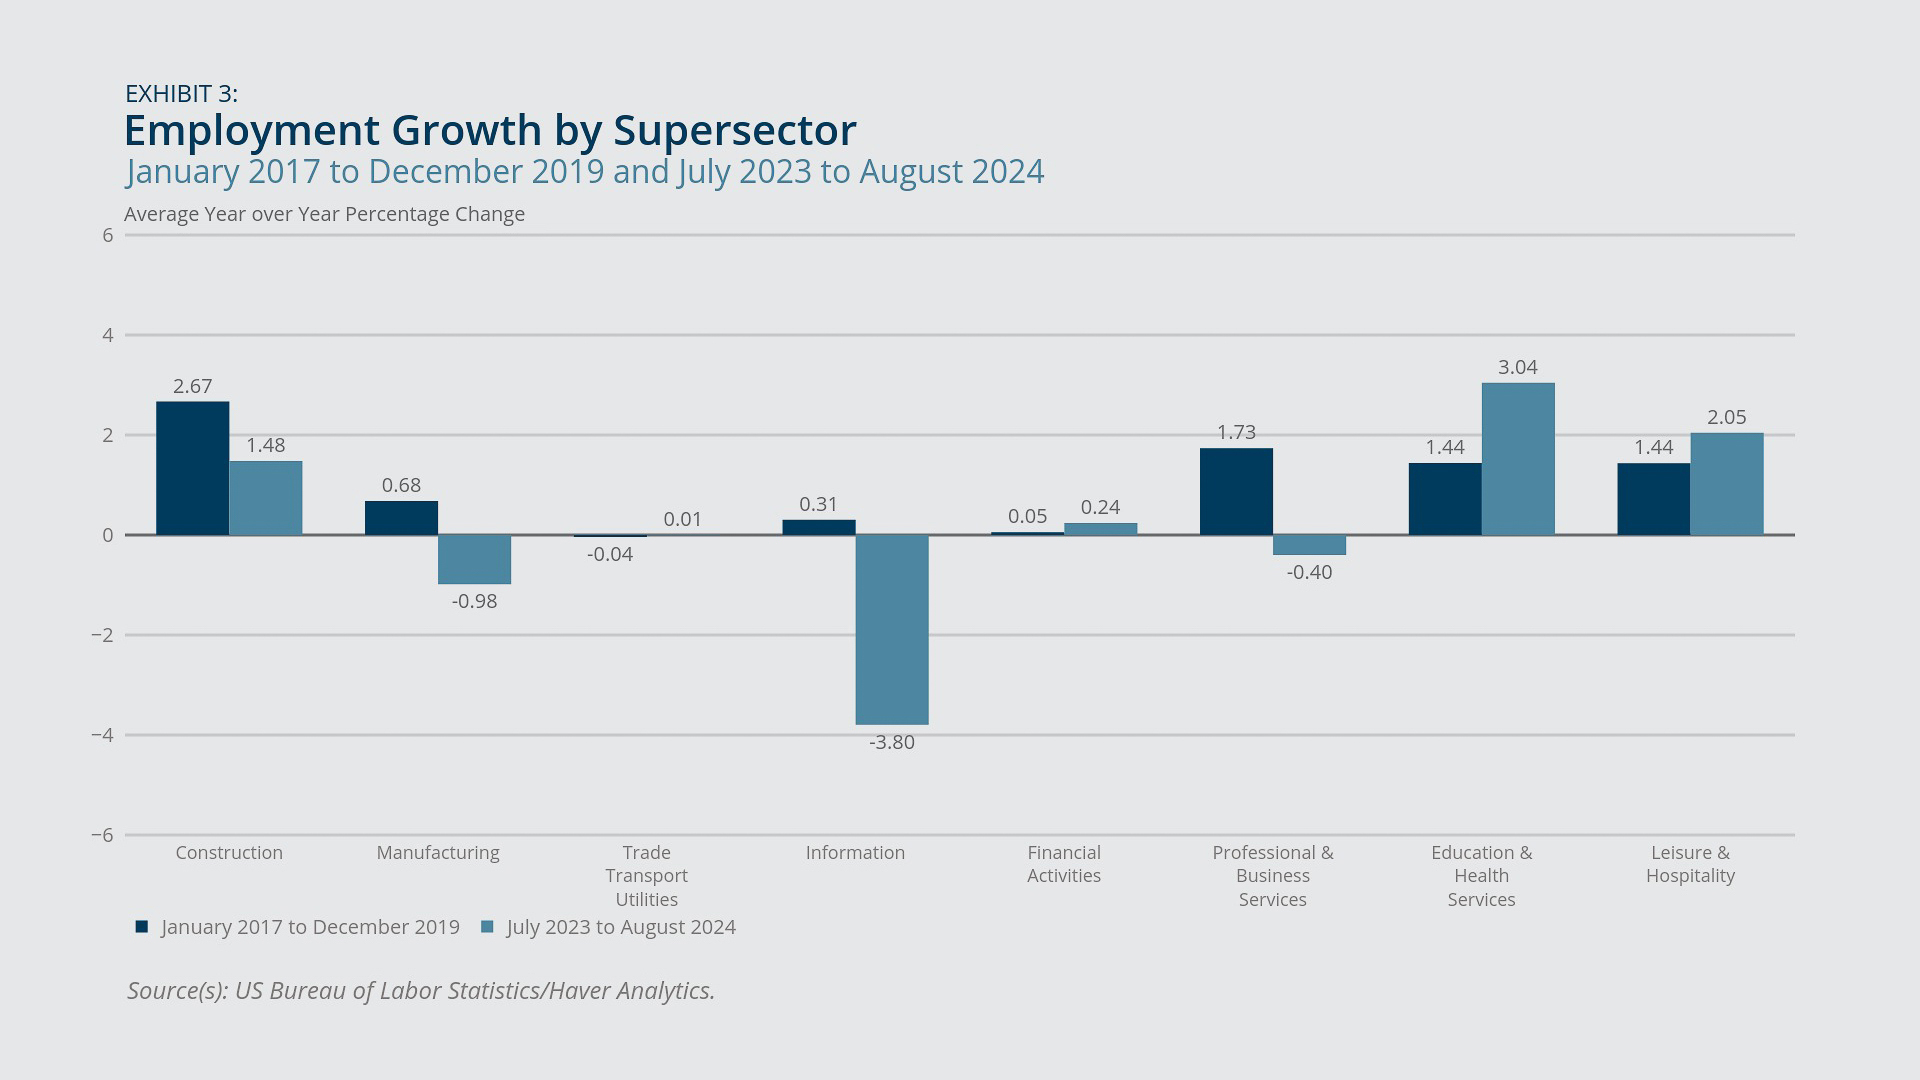
The sectoral forces behind the region’s employment growth have also shifted since the pre-pandemic period (Exhibit 3). Growth in the educational and health services, other services, and government sectors has accelerated, while, after a period of strong recovery, the construction, manufacturing, information, and professional and business services sectors experienced a deceleration in growth, which in some cases led to year-over-year employment losses. These changes highlight that factors different from those that drove employment growth in New England during the recovery phase as well as the pre-pandemic period are now fueling labor market growth.

Federal Reserve Bank of Boston
Federal Reserve Bank of Boston
Federal Reserve Bank of Boston
Unemployment and Labor Force Participation
- The unemployment rate in New England increased 0.3 percentage point year-over-year in August 2024. The increase primarily reflects changes in the labor force participation margin, not a reduction in employment shares.
- The region’s labor force participation rate increased from 64.2 percent to 65.0 percent from January 2024 to August 2024. While that increase is substantial, inferences about its causes would be premature due to the small survey sample underlying the region’s short-term labor market statistics.
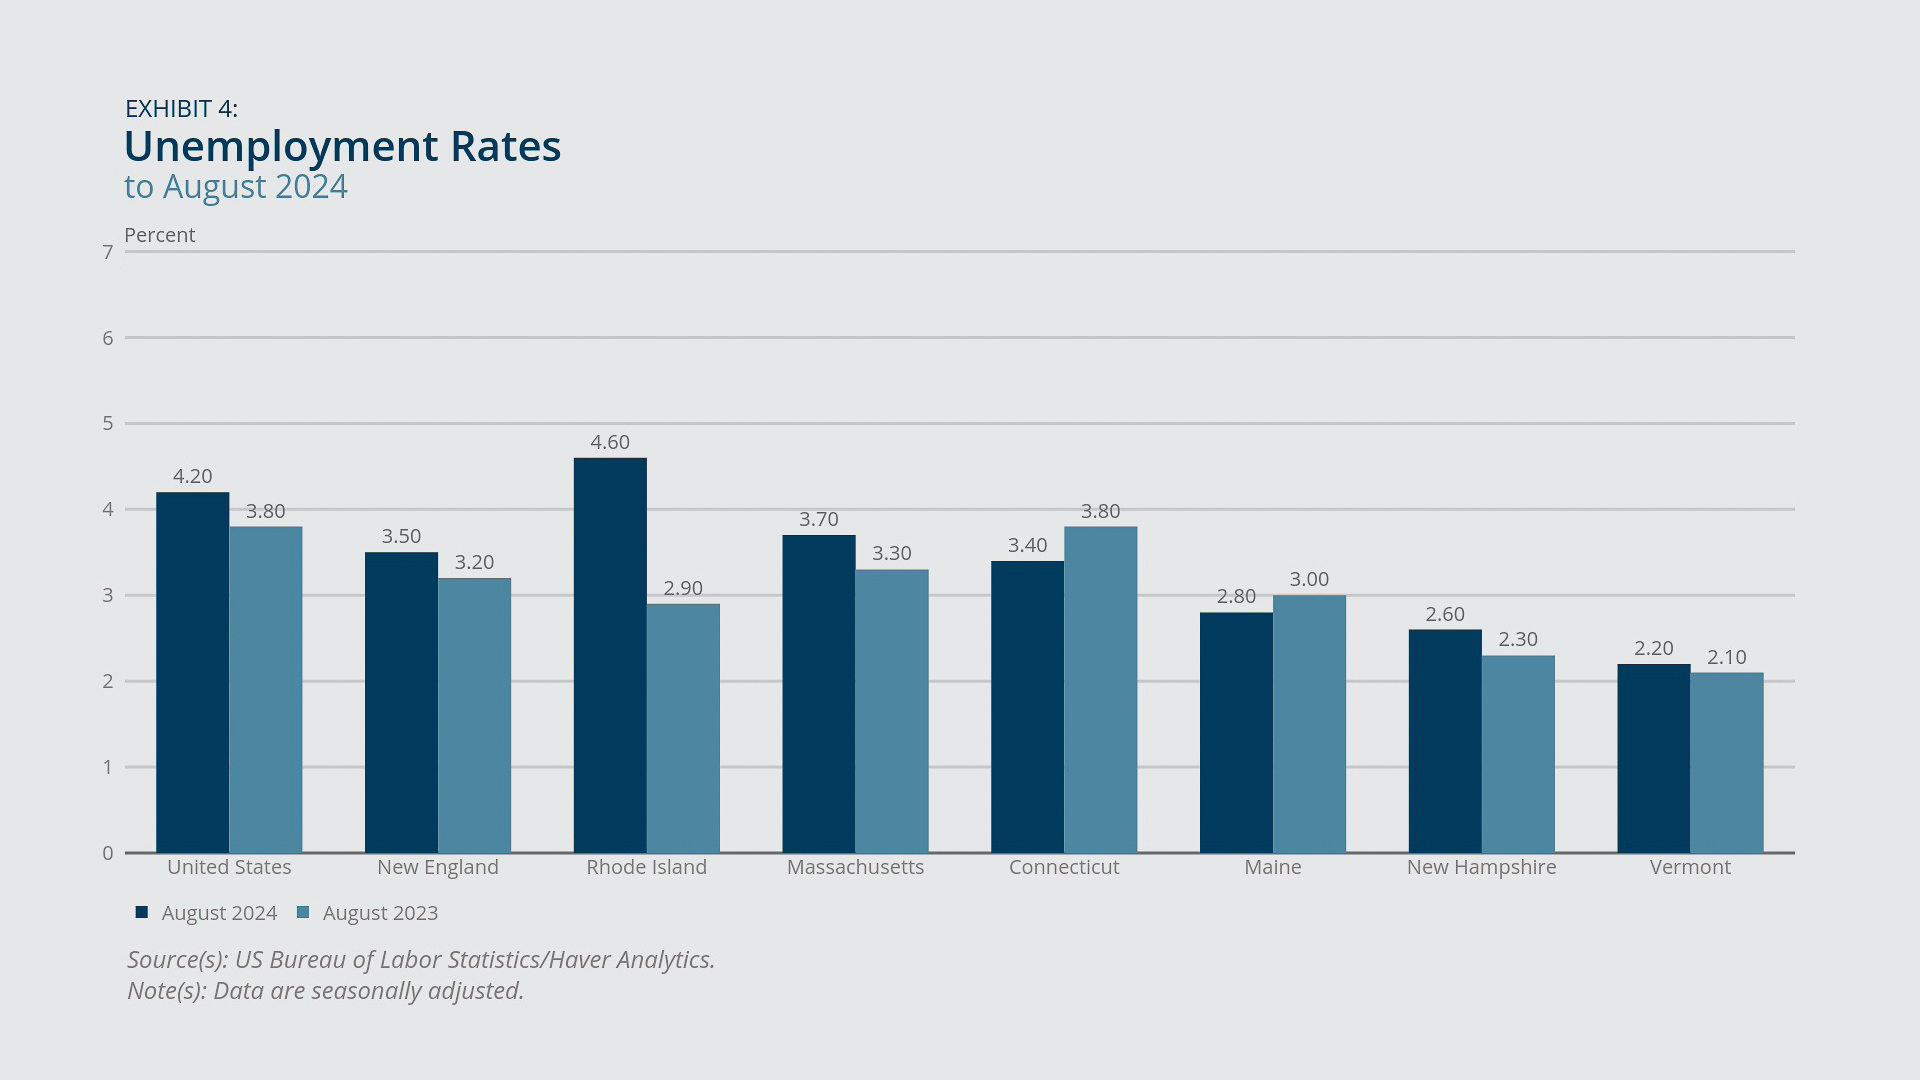
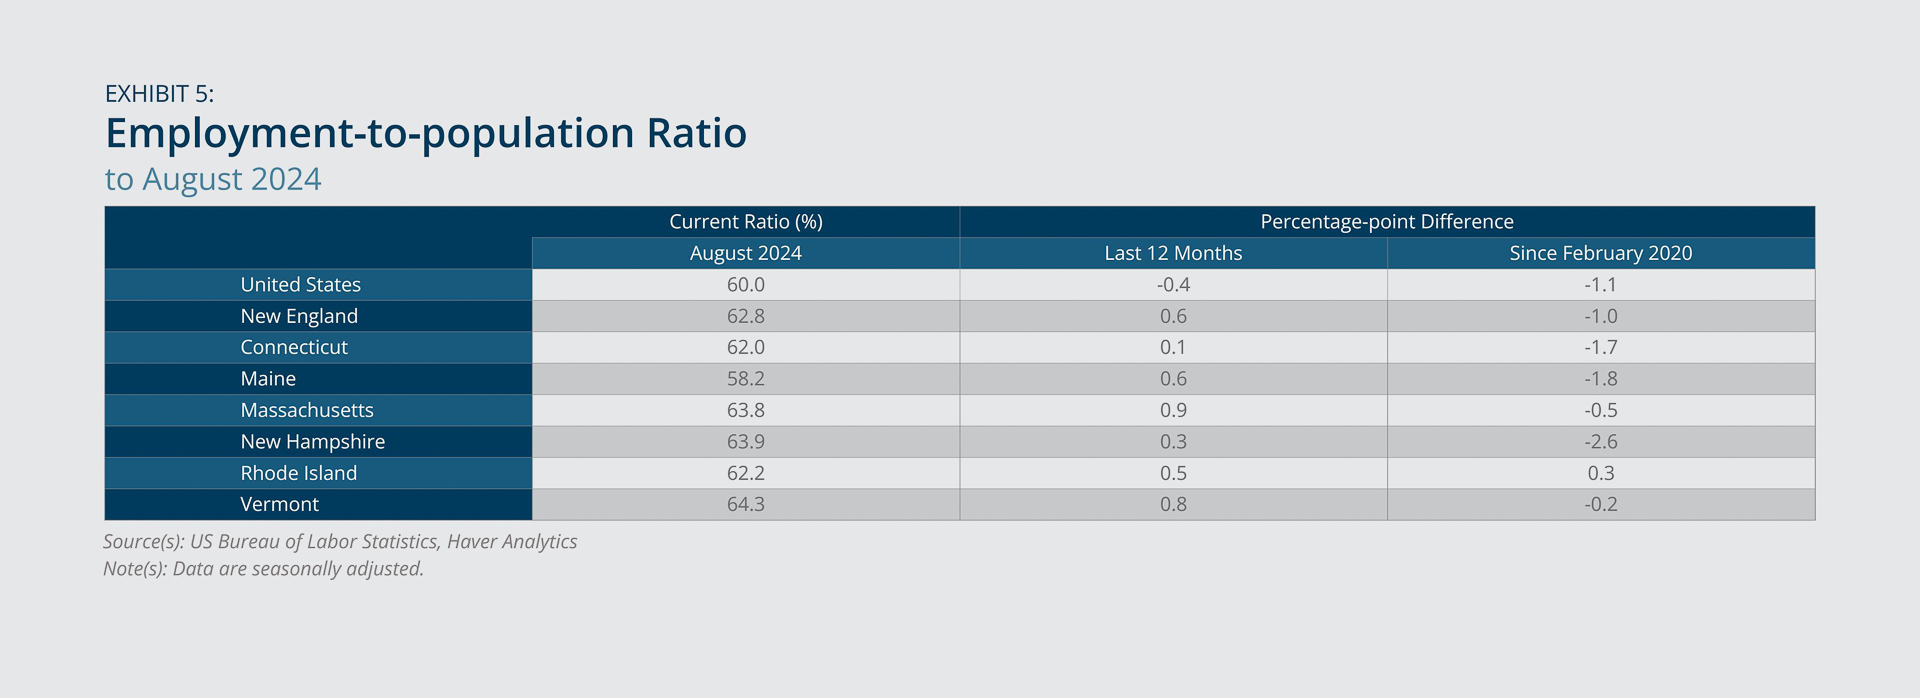
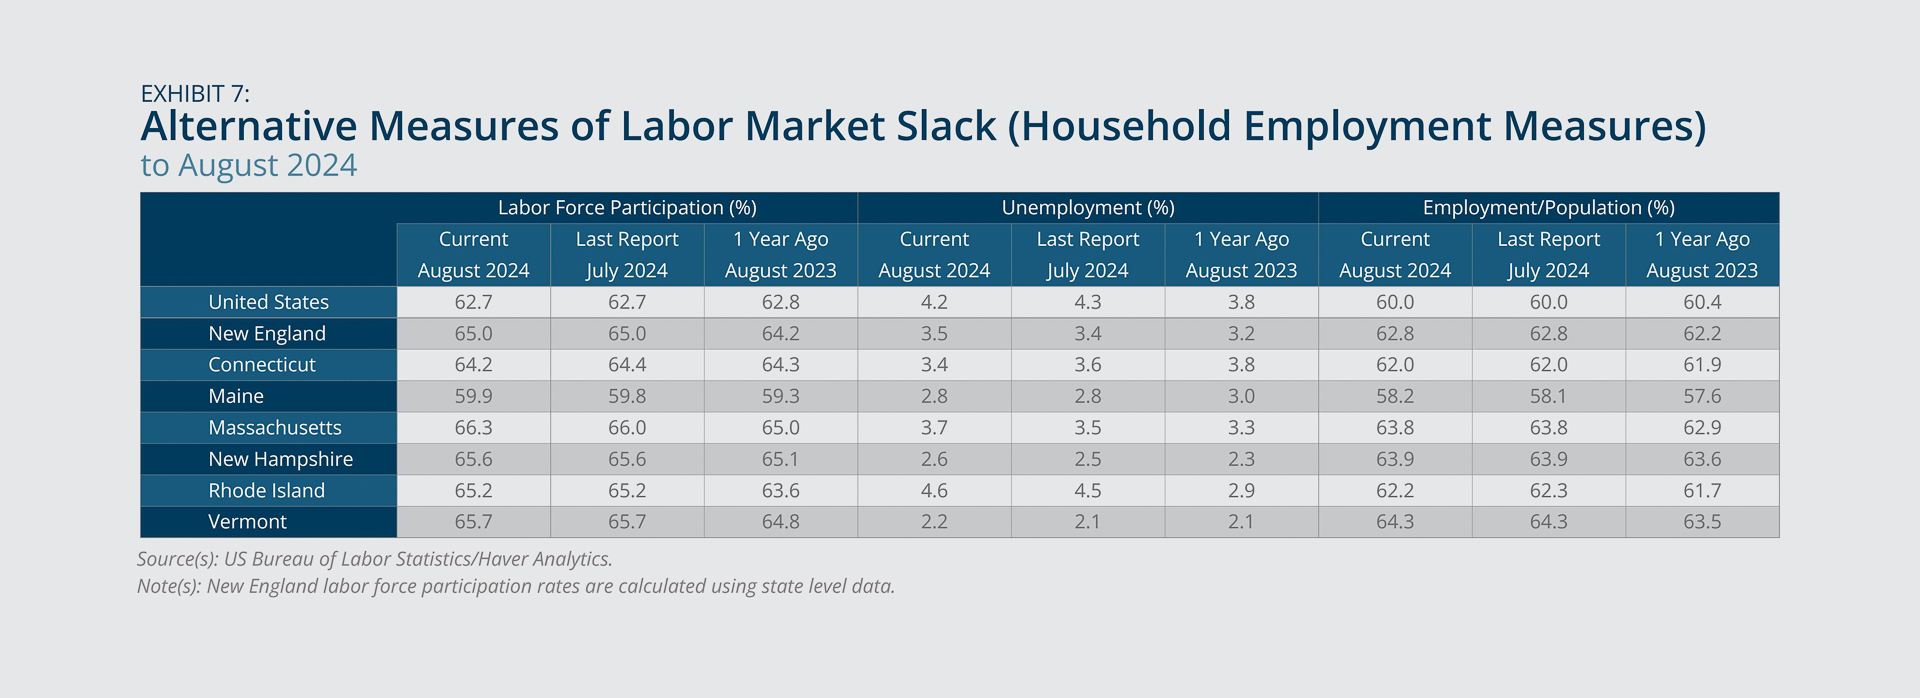
The unemployment rate was 3.5 percent in New England and 4.2 percent in the United States in August 2024 (Exhibit 4). The rates reflect year-over-year increases of 0.3 and 0.4 percentage point, respectively. While the increase in the regional rate is comparable to the increase in the national rate, the underlying causes of the upticks appear to be different. Across the United States, the rise in the unemployment rate is likely due to a contraction in employment opportunities, as evidenced by a simultaneous decline in the employment-to-population ratio (Exhibit 5). However, in New England, where the share of employed workers in the population grew, the unemployment rate increase likely reflects an influx of job seekers who were previously out of the labor force, not a reduction in jobs.
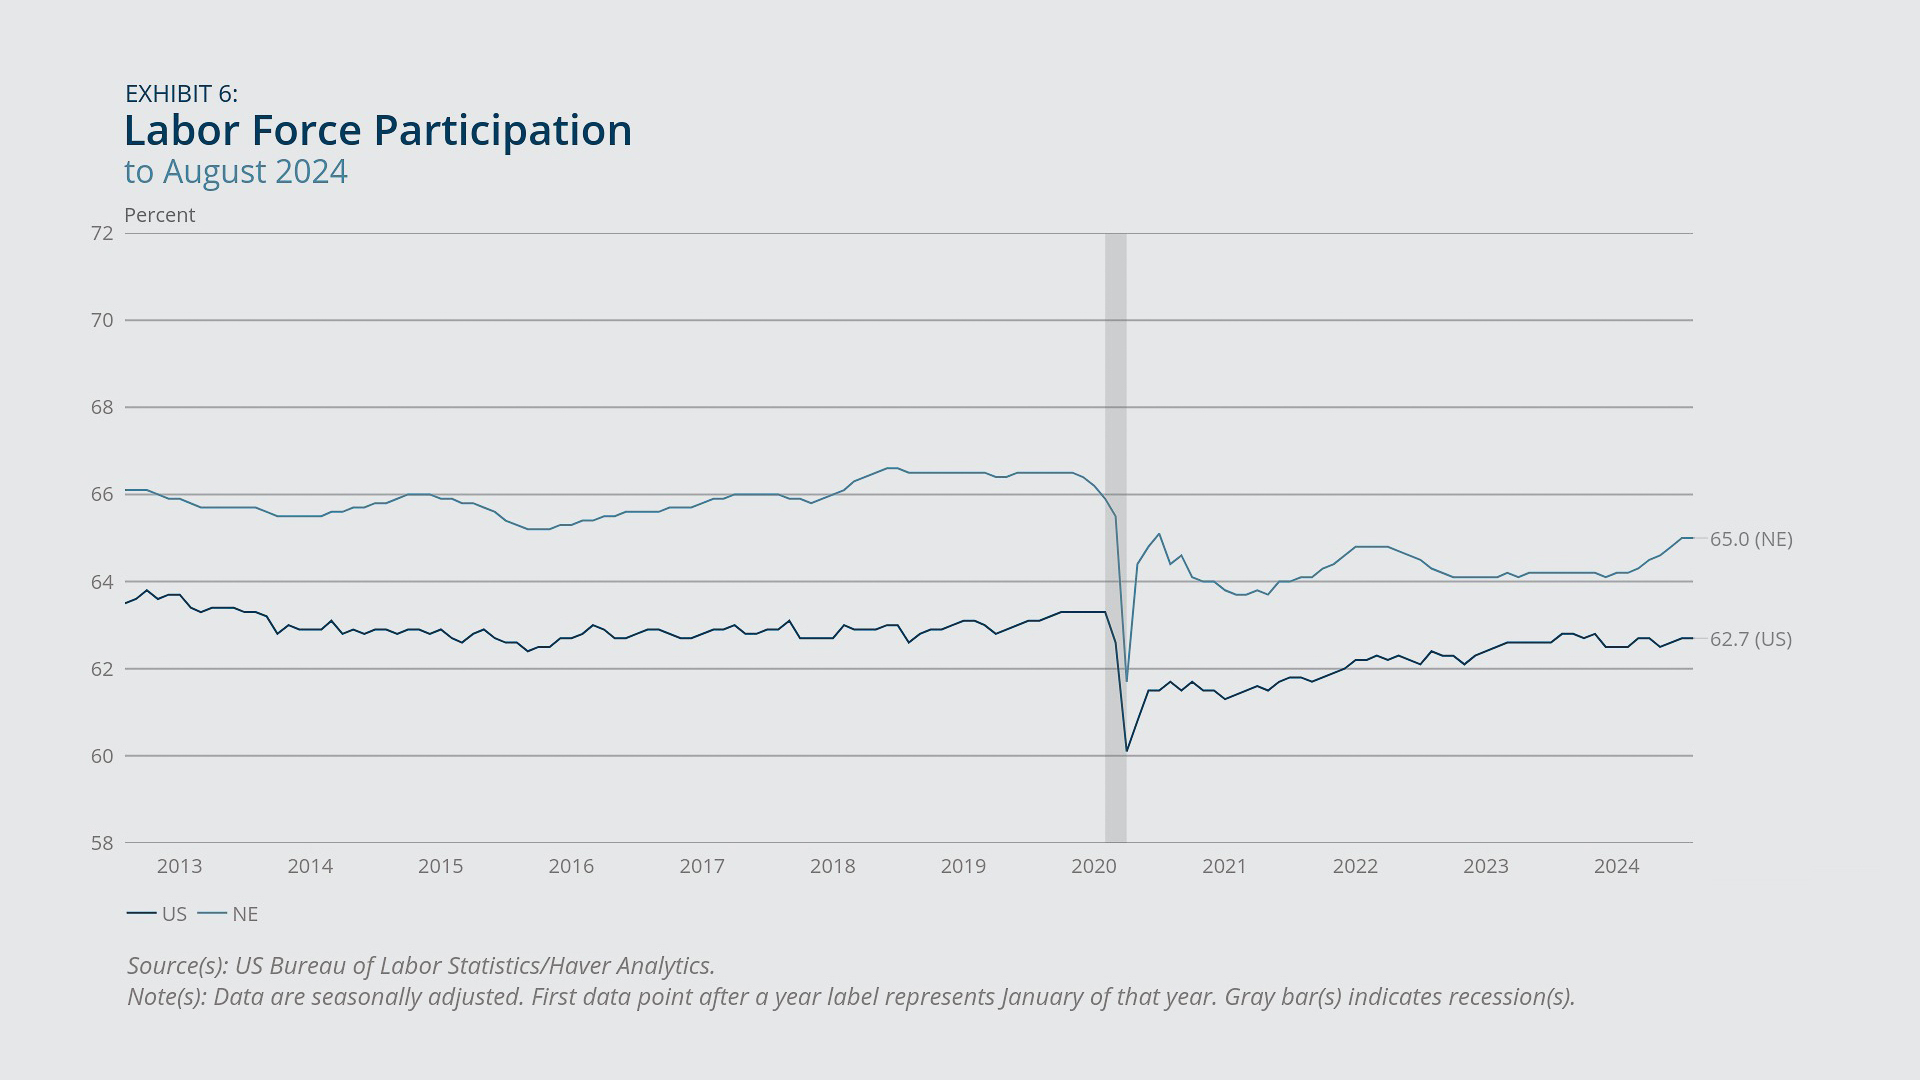
Consistent with that observation, New England’s labor force participation rate has risen notably over the course of 2024, whereas the corresponding national rate has remained largely flat (Exhibit 6). The increase has been concentrated in Massachusetts and Rhode Island (Exhibit 7) and, in terms of age groups, in the population aged 16 to 24.1 Nevertheless, due to the small survey sample size underlying these statistics, it is too early to determine whether the observed rate changes resulted from survey-related volatility or a material increase in the region’s labor force participation. It would be prudent to wait for the US Bureau of Labor Statistics’ next annual revision to the household employment statistics (in early 2025), which will incorporate updated population controls and state model inputs, before drawing any conclusions about the region’s current labor force participation trend.
Federal Reserve Bank of Boston
Federal Reserve Bank of Boston
Federal Reserve Bank of Boston
Federal Reserve Bank of Boston
Inflation
- In September 2024, year-over-year inflation in New England remained elevated compared with the national average due to accelerated price growth in the first half of the year.
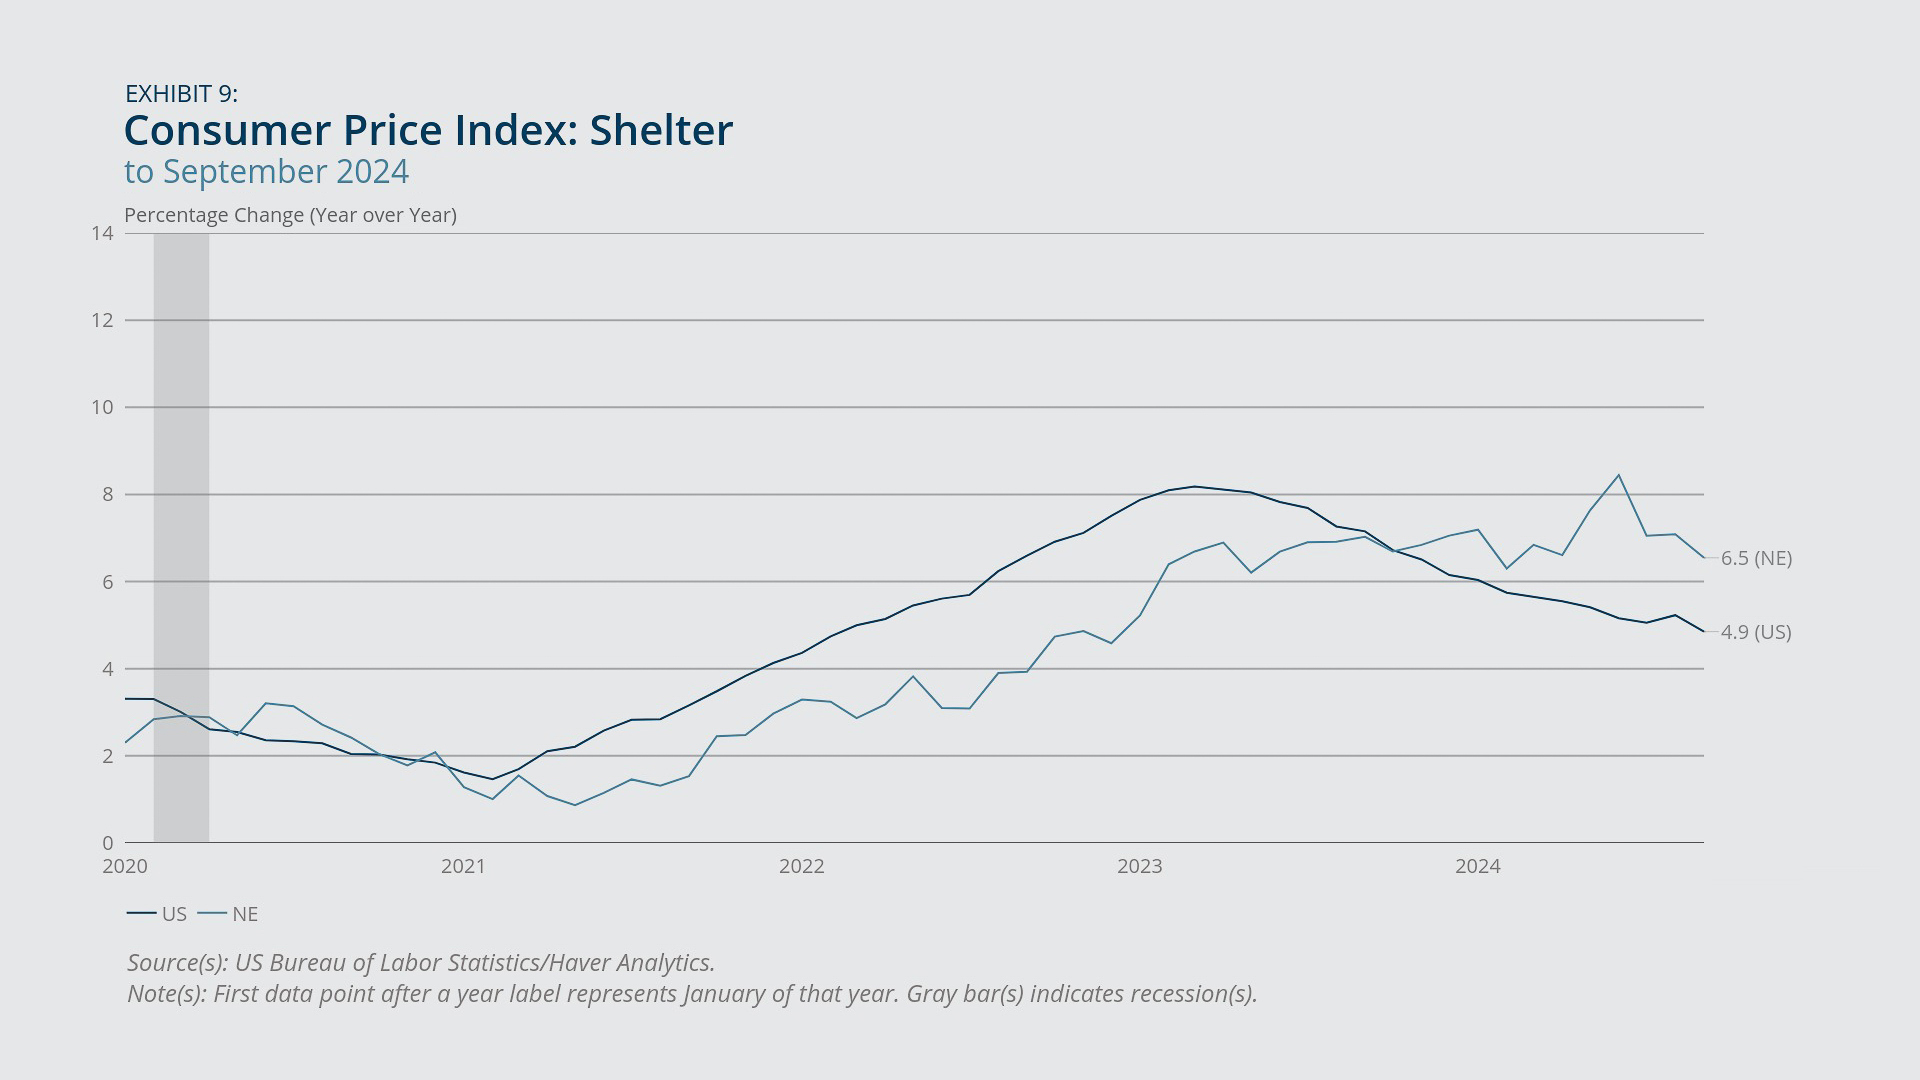
- Persistently elevated inflation in shelter costs and rising inflation in medical care costs were the predominant factors driving the region’s upward trend in inflation.
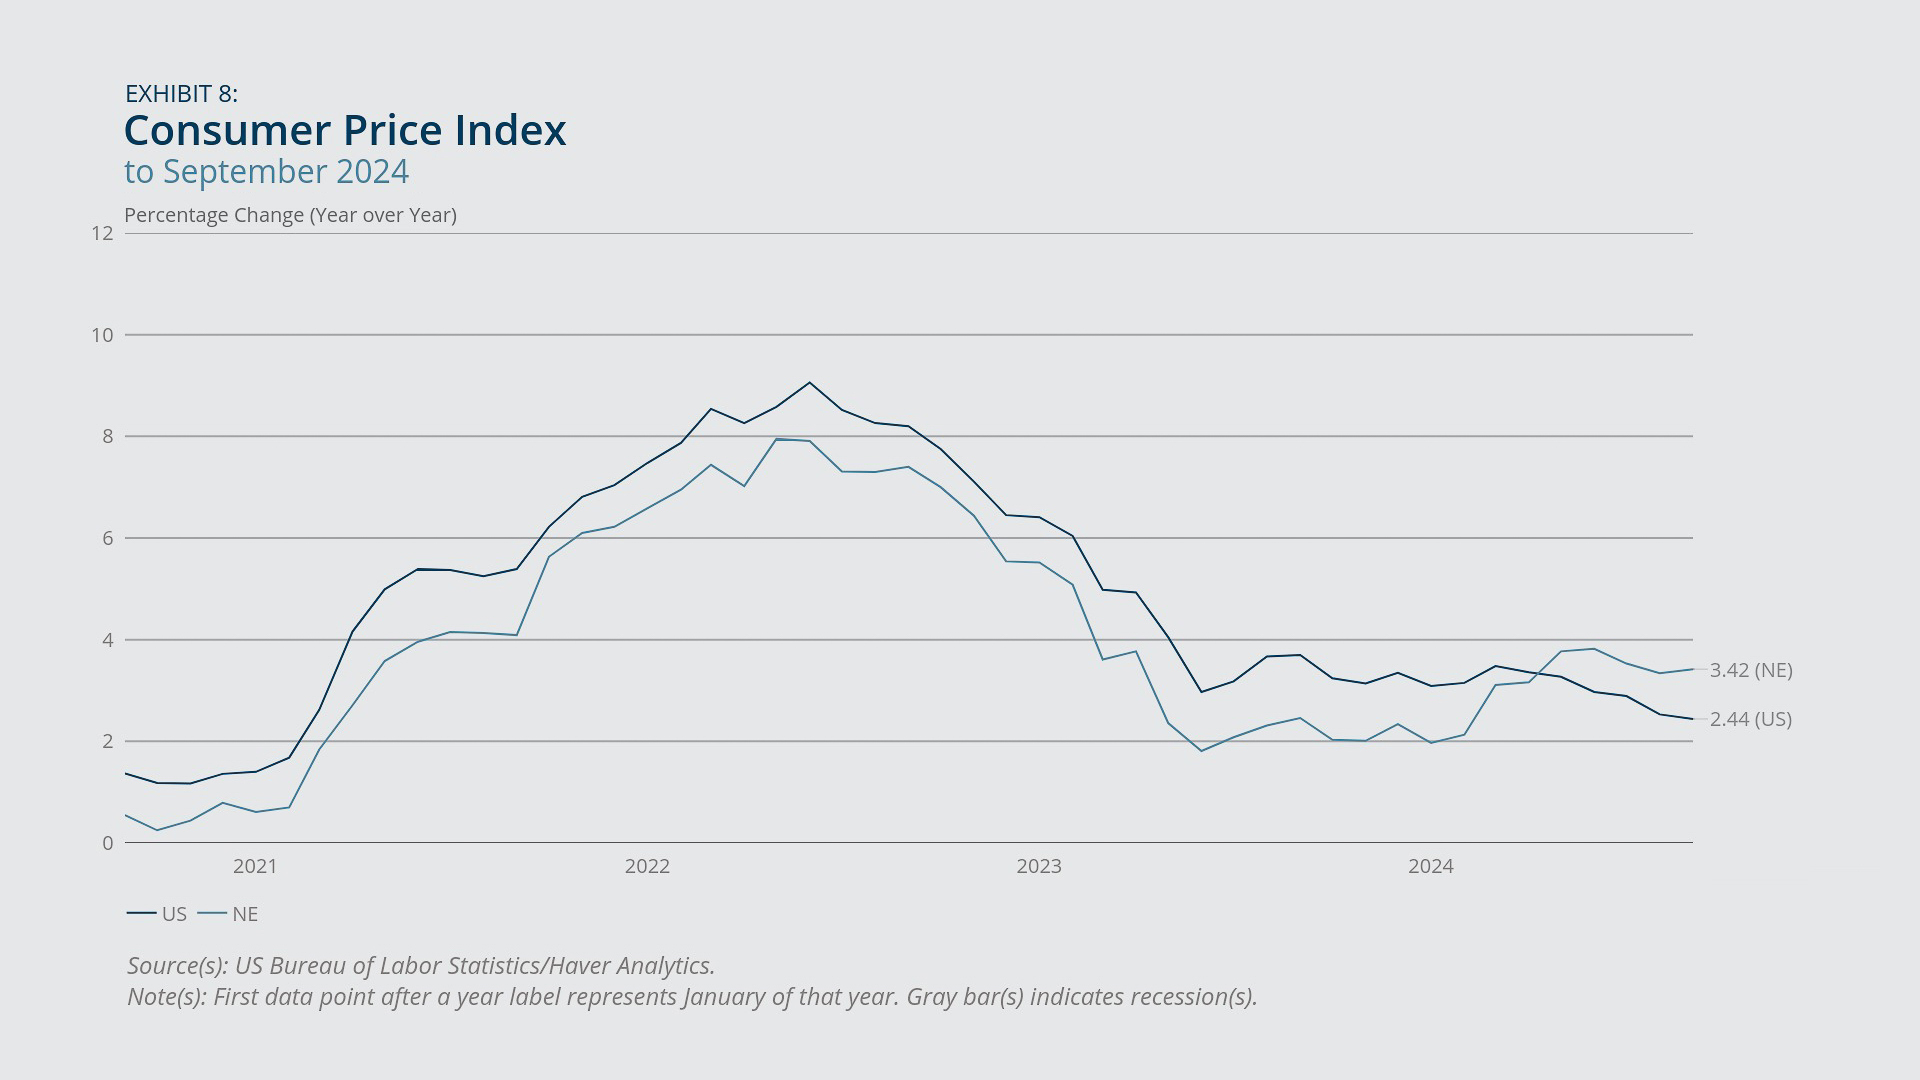
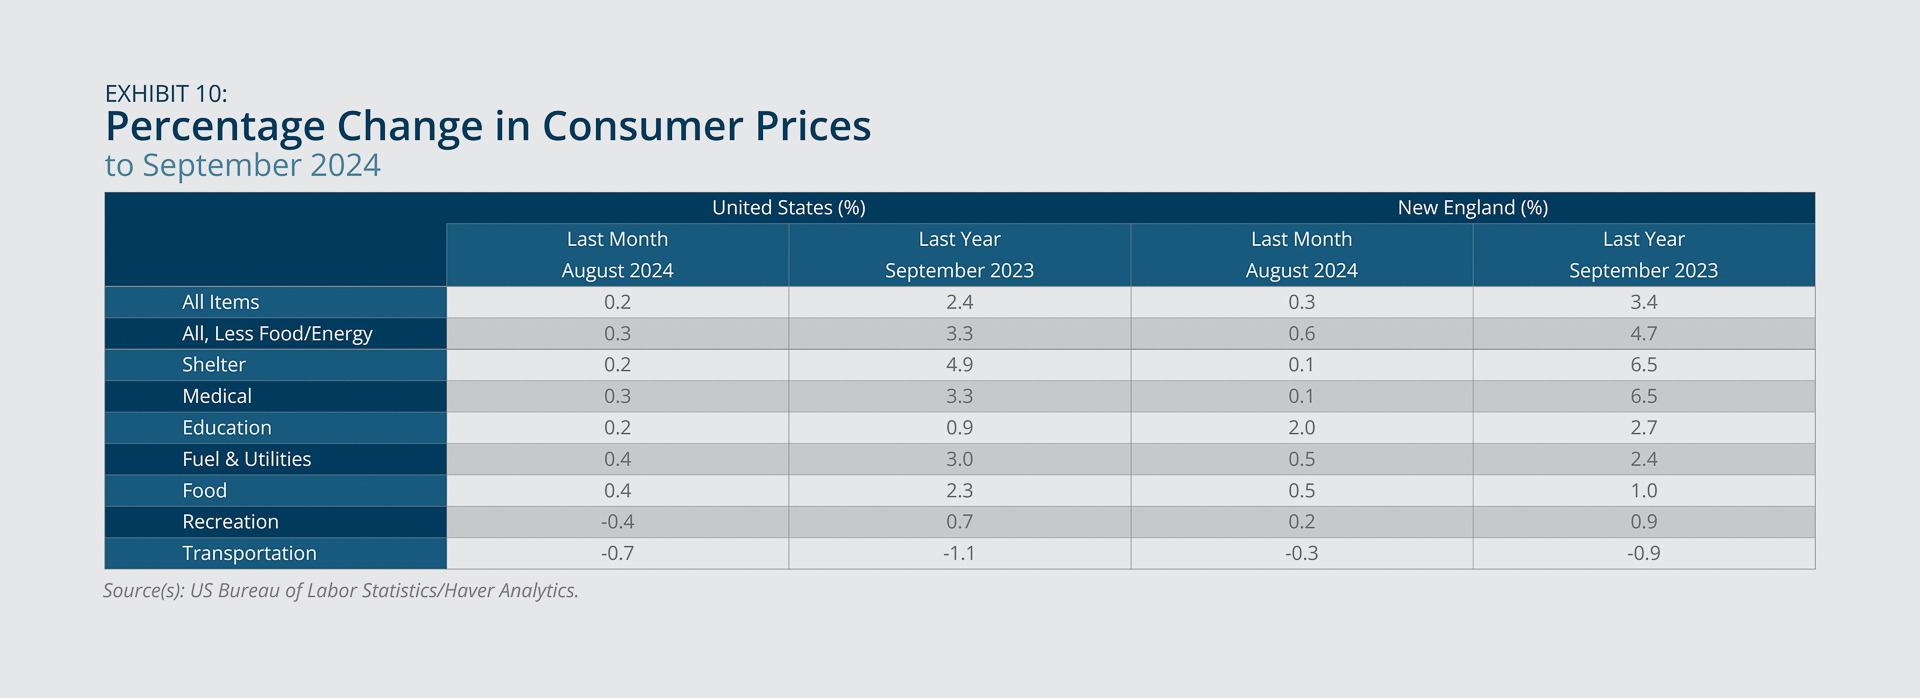
In September 2024, year-over-year price growth, as measured by the Consumer Price Index for All Urban Consumers (CPI-U), remained faster in New England compared with the United States, 3.4 percent versus 2.4 percent (Exhibit 8). Since the beginning of 2024, inflation in the region has followed trajectories that are different from the US trends. While US inflation has steadily cooled and dropped toward the Federal Reserve’s 2 percent target, inflation in New England accelerated in the first two quarters of 2024 and did not begin to fall until July.
Such trends in aggregate price growth primarily reflect the evolution of the shelter component of the CPI. While shelter inflation showed a steady deceleration nationwide, it continued to rise in New England during the first half of 2024, peaking at 8.4 percent in June (Exhibit 9). Since then, shelter inflation in New England has modestly softened, measuring 6.6 percent as of September 2024 and contributing to the overall moderation of inflation in the region. Inflation in medical care costs also has factored into the region's overall higher inflation. It rose to 6.5 percent in New England in September 2024 compared with 3.3 percent nationally on a year-over-year basis (Exhibit 10). Conversely, the transportation component helped curb overall inflation during this period, with year-over-year declines of 0.9 percent in New England and 1.1 percent across the United States.
Federal Reserve Bank of Boston
Federal Reserve Bank of Boston
Federal Reserve Bank of Boston
Real Estate Markets
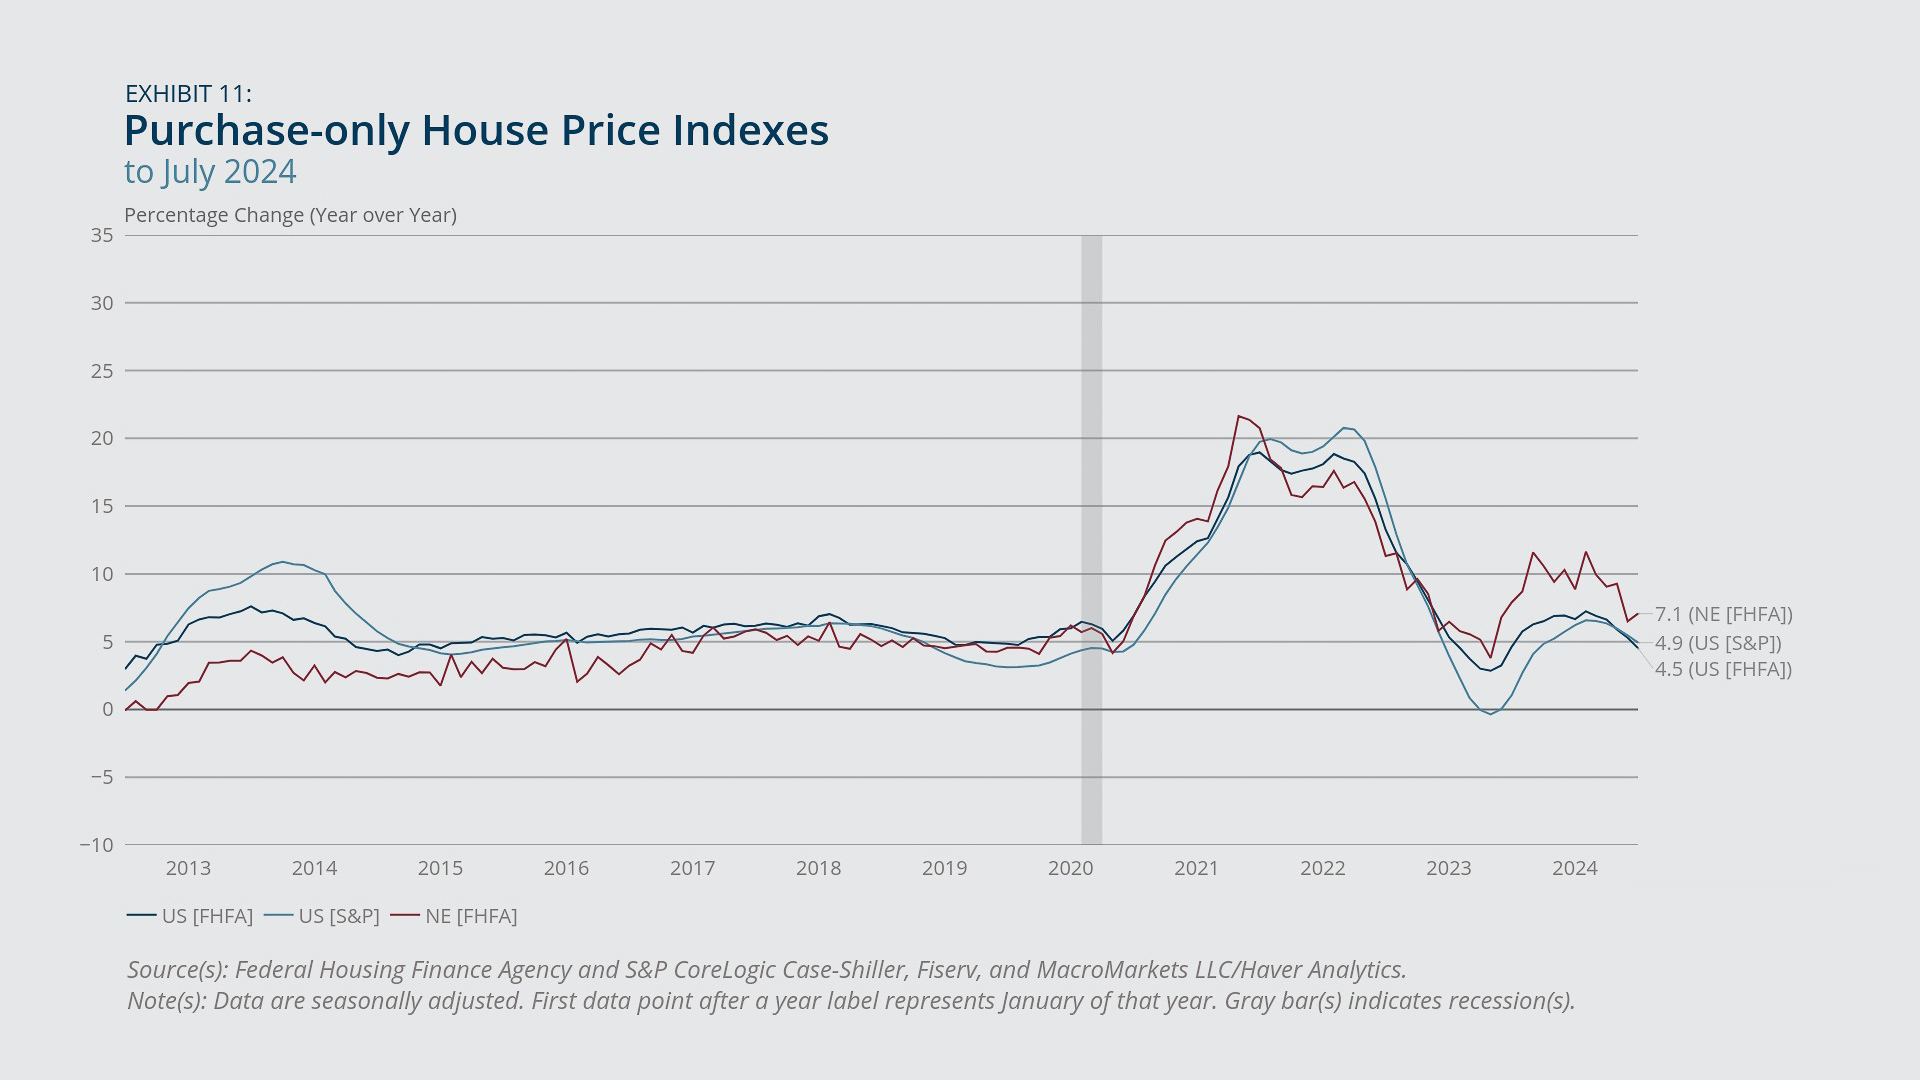
- House price growth slowed for both New England and the United States after February 2024 and gradually has approached pre-pandemic growth rates.
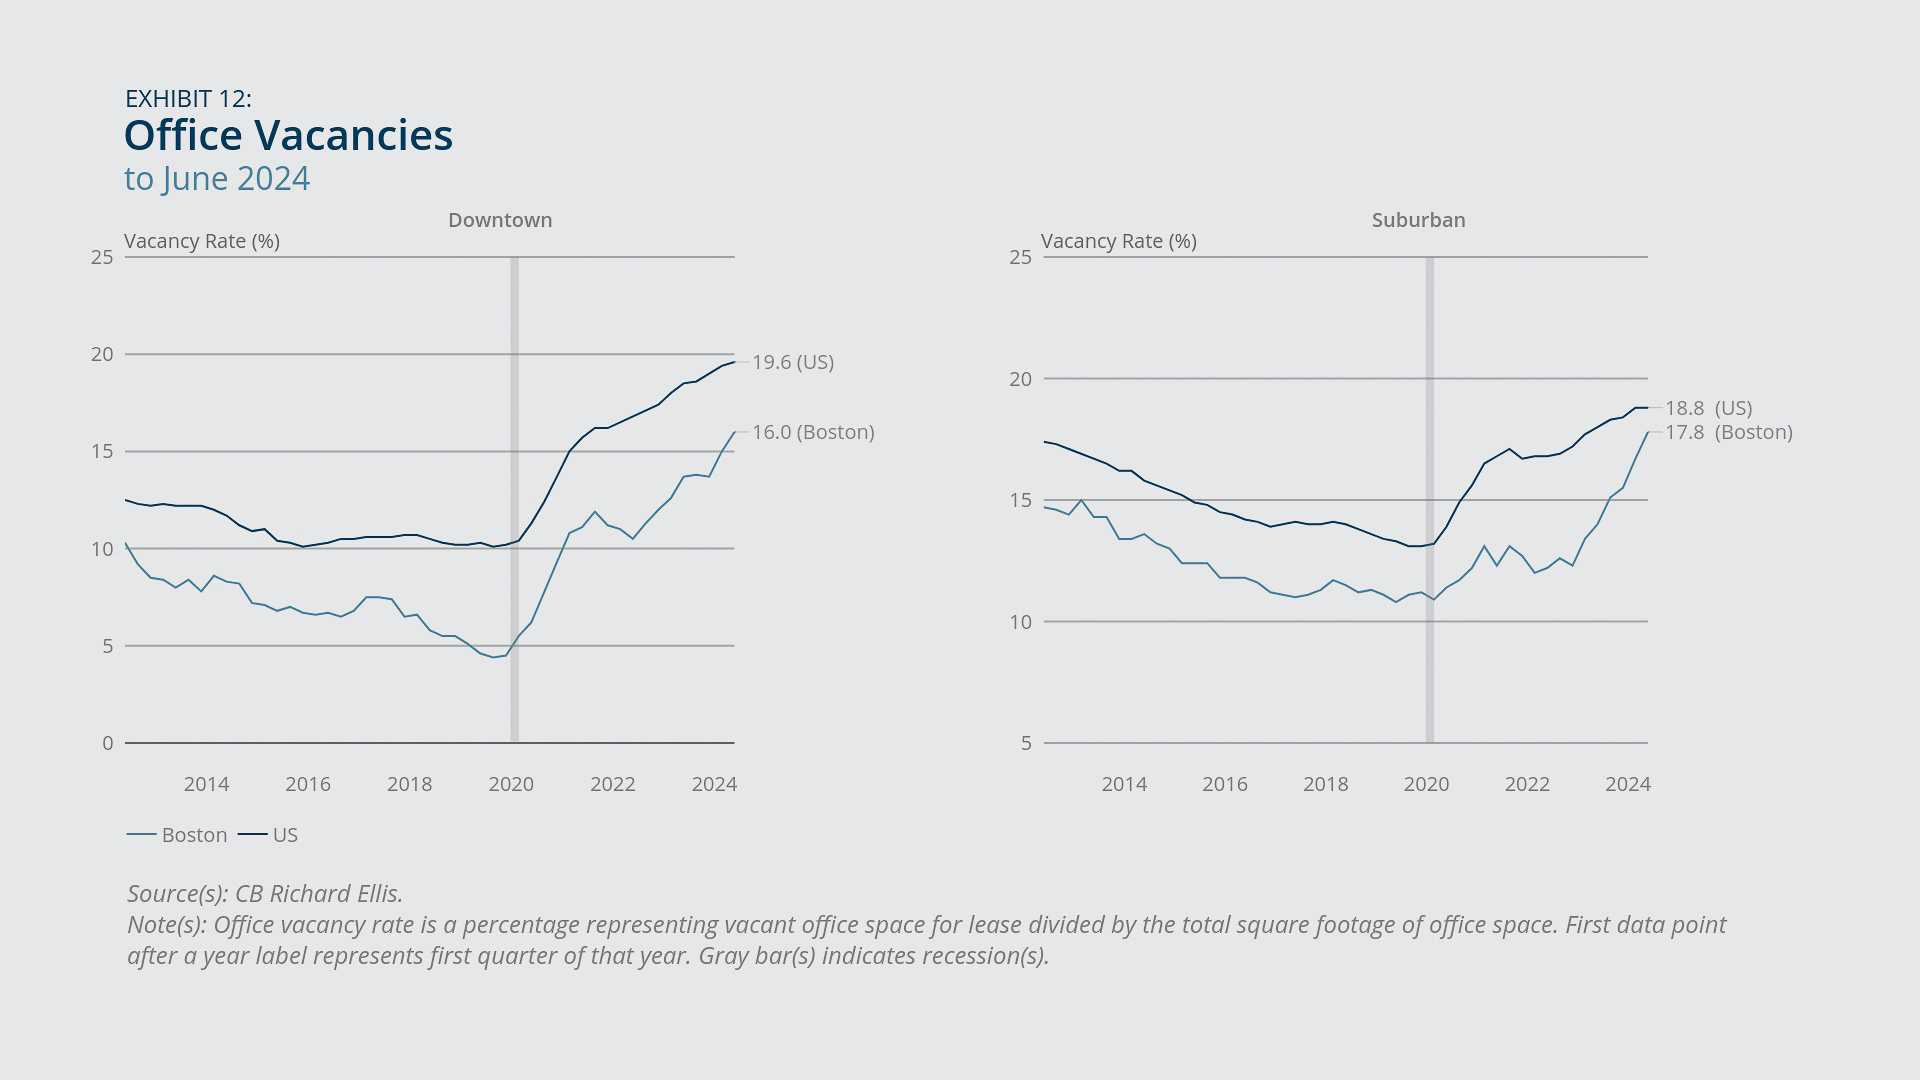
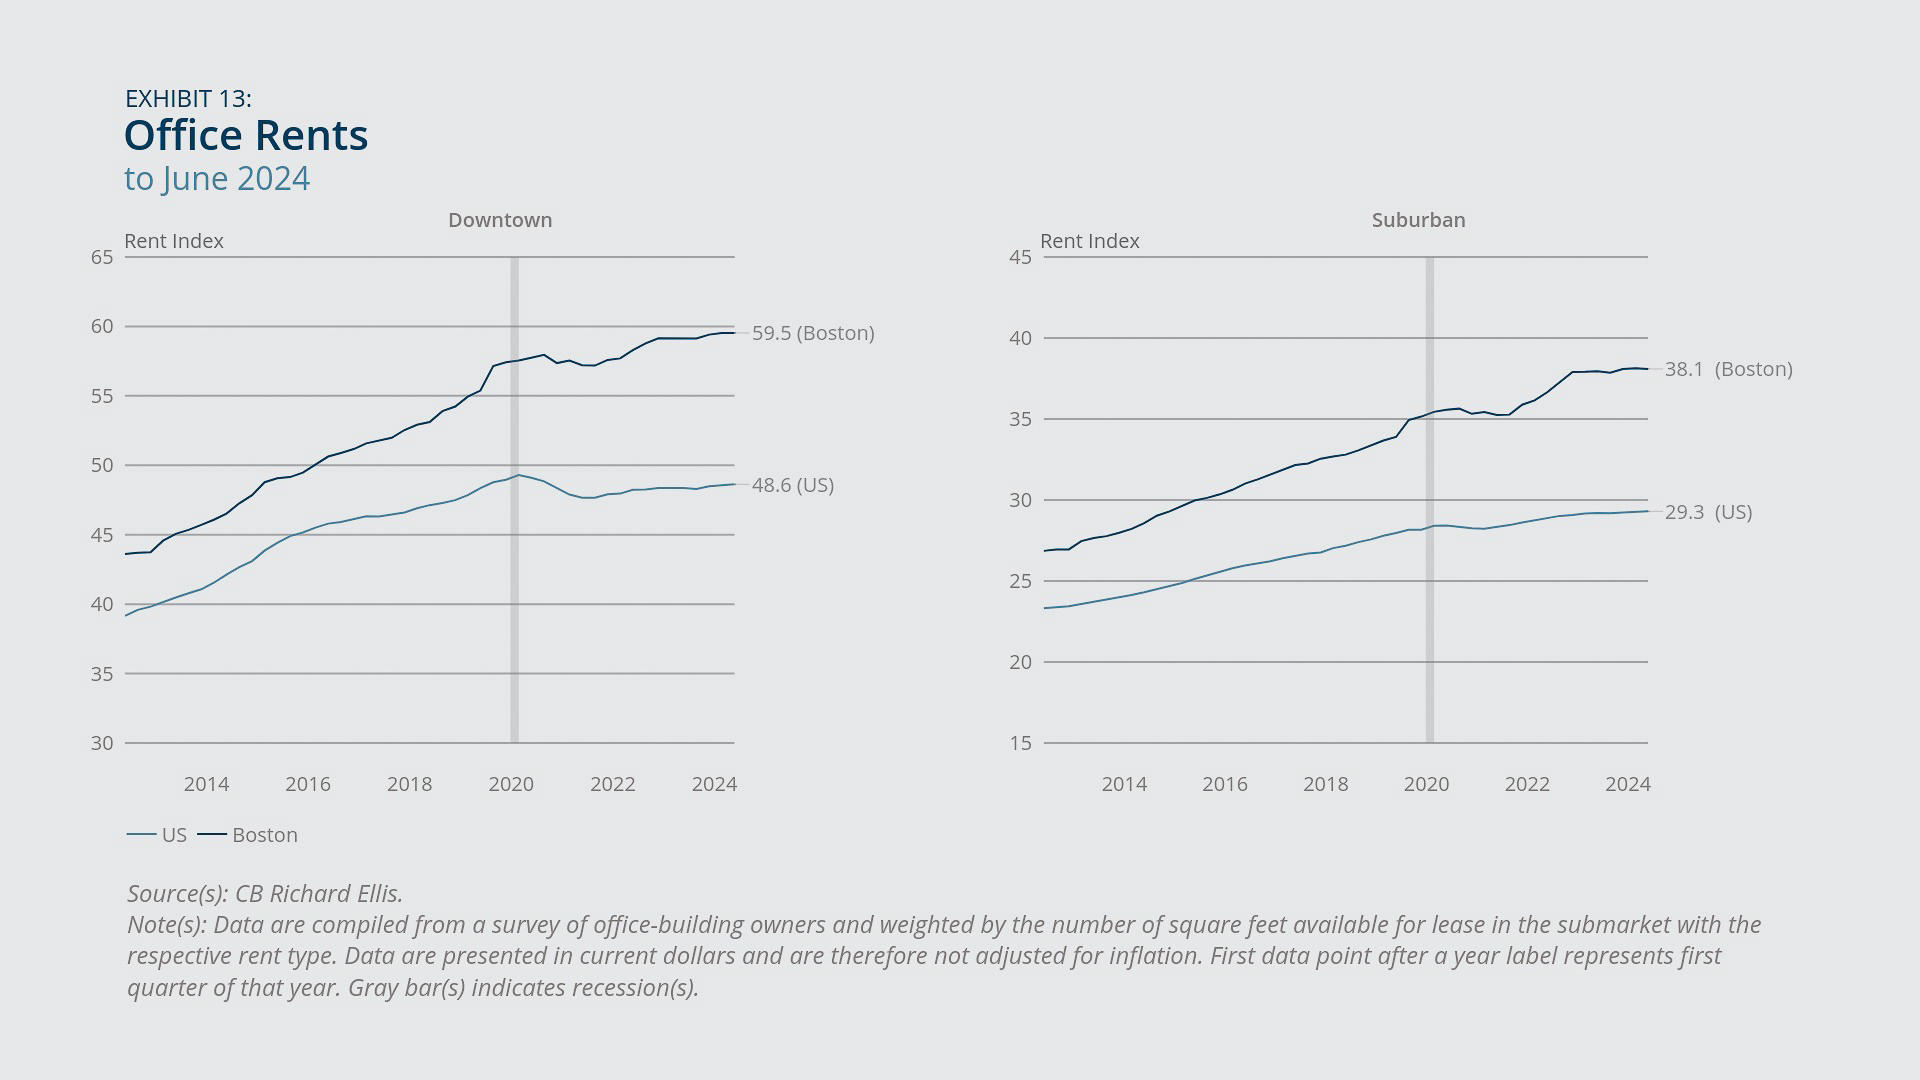
- Commercial real estate vacancy rates, in both downtown and suburban Boston, continued to rise faster than the national average, while office rents remained largely stagnant.
According to the Federal Housing Finance Agency (FHFA) House Price Index, New England saw greater year-over-year growth in house prices in July 2024 compared with the national average, at 7.1 percent versus 4.5 percent (Exhibit 11). After rebounding in the second half of 2023, house price growth decelerated in both New England and the United States after February 2024. However, the latest year-over-year house price growth in New England was more than 2 percentage points higher than the 2019 baseline, whereas US house price growth had returned to the pre-pandemic level.
By contrast, the commercial real estate market in Boston continued to face challenges, as evidenced by the sharp increases in vacancy rates measured by CB Richard Ellis. From 2022:Q4 to 2024:Q2, the downtown and suburban vacancy rates in Boston rose 4.0 and 5.5 percentage points, respectively (Exhibit 12). Over the same period at the national level, office vacancy rates rose only 2.2 (downtown) and 1.6 (suburban) percentage points. Those trends align with the recent stagnation in office rents, which saw only minimal growth from 2022:Q4 to 2024:Q2 both in Boston and nationally (Exhibit 13). Such developments have prompted local policymakers to consider how to address the gap in commercial property tax revenue without burdening residential property owners.2
Federal Reserve Bank of Boston
Federal Reserve Bank of Boston
Federal Reserve Bank of Boston
Consumer Confidence
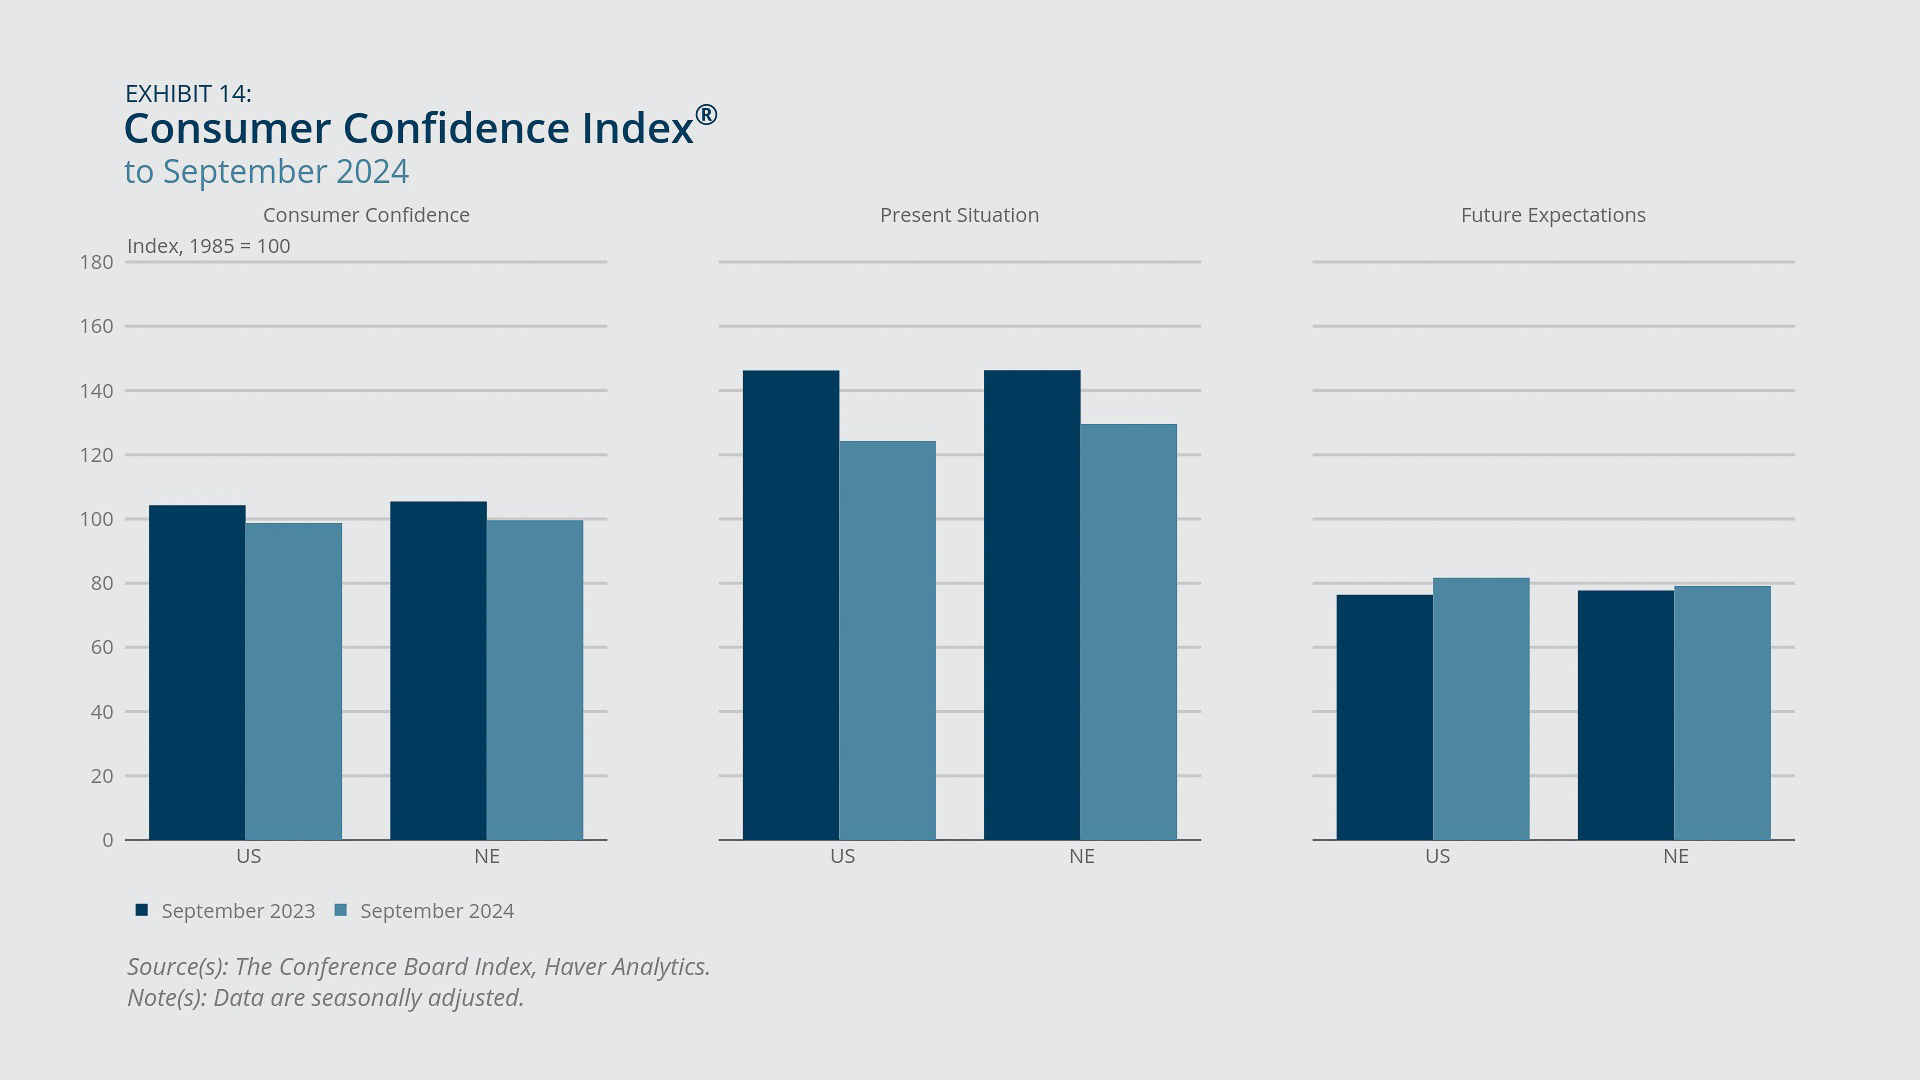
- Consumers in both the region and nationwide were less confident about current business and labor market conditions in September 2024 than they were in September 2023.
- Consumers’ short-term outlook for the economy had improved compared with the level from a year ago, though it remained lower than the levels seen from 2017 to 2021.
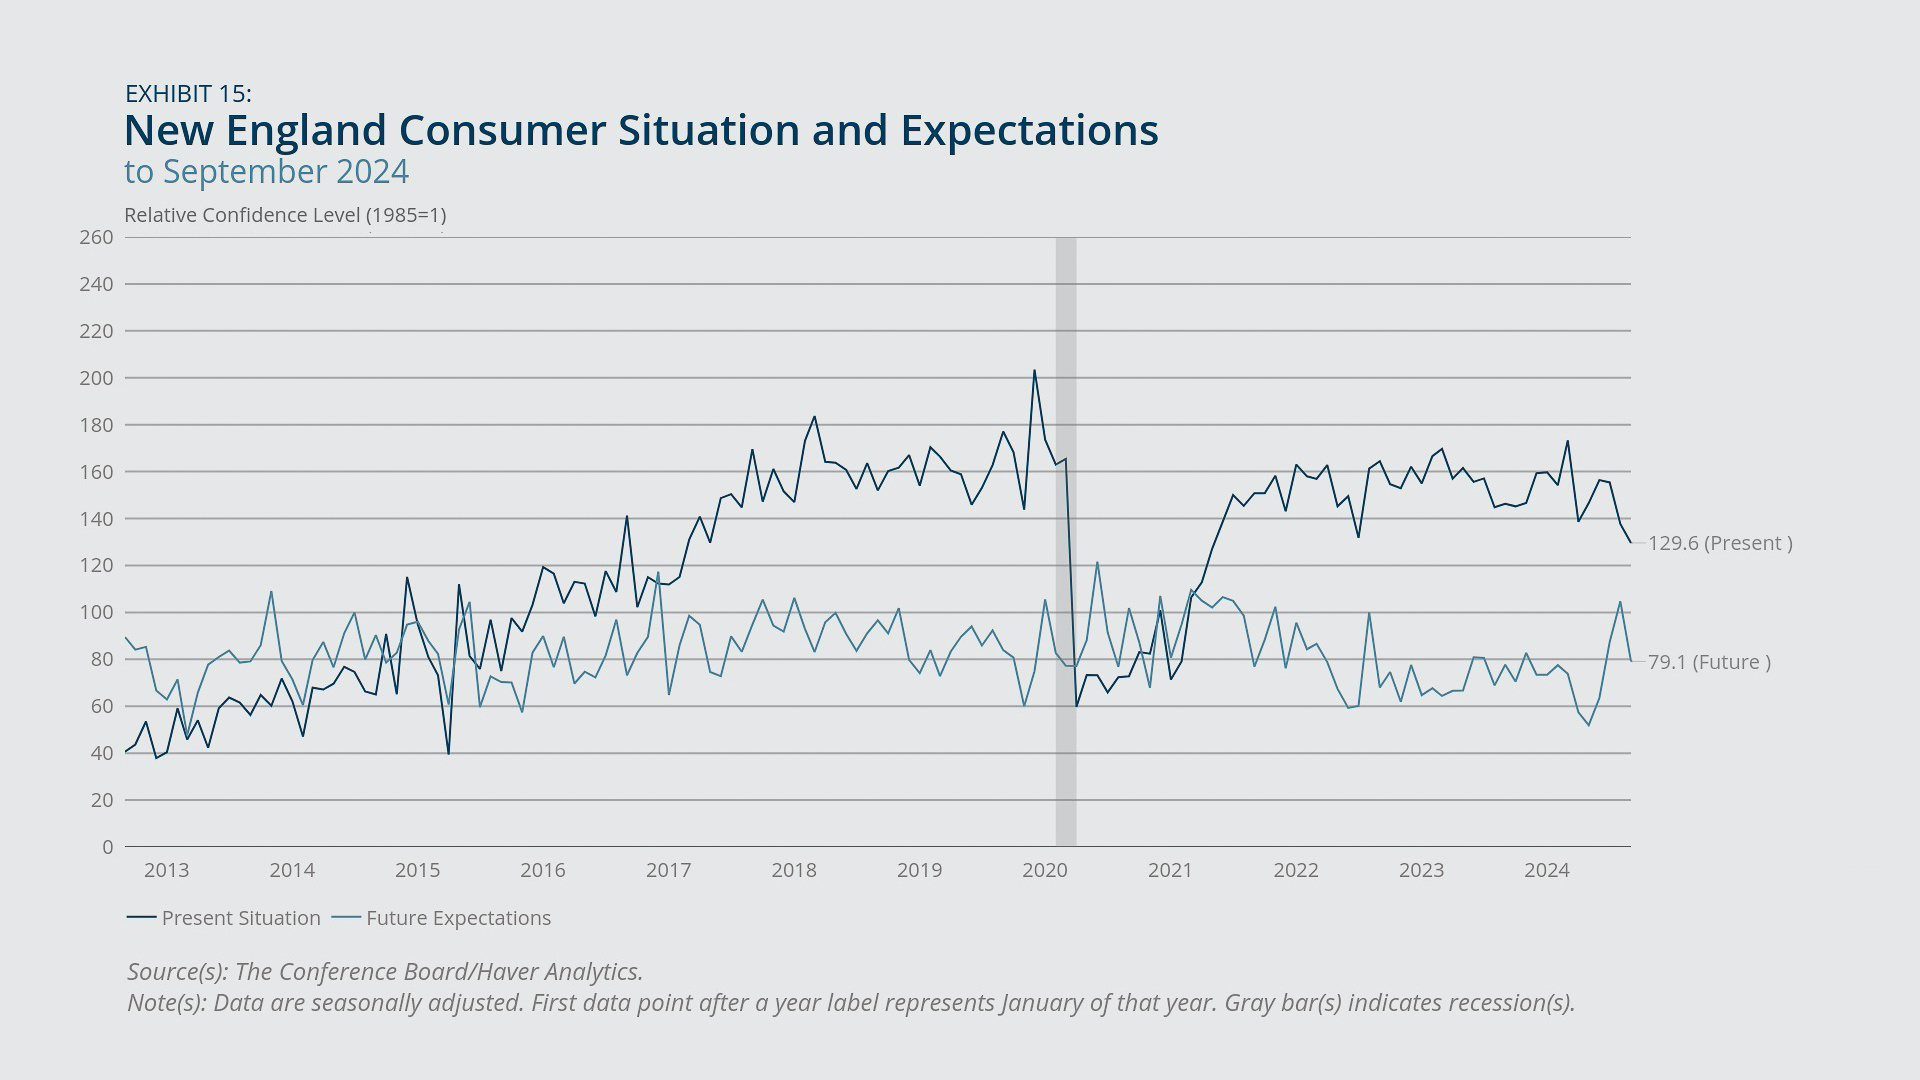
Consumer confidence, as indicated by the Conference Board's Consumer Confidence Index, was weaker in September 2024 compared with a year earlier both in New England and across the United States (Exhibit 14). The lower overall confidence index resulted from sharp year-over-year declines in the Present Situation Index, which was down 16.7 points in New England and 21.9 points nationally. The decline indicates that consumers' confidence in current business and employment conditions has deteriorated despite otherwise robust labor market statistics. However, the volatility of the Present Situation Index precludes definitive conclusions about the evolution of consumer sentiment; the overall trend in the index has remained steady since June 2021 (Exhibit 15).
By contrast, consumers in both New England and the United States expressed modestly more optimism about the economy’s short-term outlook in September 2024 compared with a year earlier, with the Future Expectations Index rising 1.4 points in the region and 5.3 points nationally (Exhibit 14). However, since 2022, the Future Expectations Index has hovered slightly below 80 points, remaining depressed compared with the more elevated levels seen from 2017 to 2021 (Exhibit 15). A persistent reading below 80 points has historically preceded a recession. Therefore, although consumers may be slightly more optimistic about the short-term prospects, it is too soon to infer that they are no longer concerned about recessionary risks.
Federal Reserve Bank of Boston
Federal Reserve Bank of Boston
Endnotes
- The finding involving age groups is based on the authors’ calculations using the Current Population Survey. The results are not included in this memo.
- See Larry Edelman, “After Victory in the House, Can Wu Sell the Senate on Her Contentious Property Tax Plan? Opponents Fear She Will,” Boston Globe, September 12, 2024, for more information about recent discussions on potential changes to Boston’s commercial property tax rates.

 About the Authors
Pinghui Wu,
Federal Reserve Bank of Boston
Pinghui Wu is a senior economist with the New England Public Policy Center at the Federal Reserve Bank of Boston.
Email: Pinghui.Wu@bos.frb.org
Annie Liu,
Federal Reserve Bank of Boston
Annie Liu is a senior research assistant with the New England Public Policy Center in the Federal Reserve Bank of Boston Research Department.
Acknowledgments
Kelly Jackson, Federal Reserve Bank of Boston
Resources
Keywords
- Regional economy ,
- Economic Conditions ,
- New England