New England Economic Conditions Through January 13, 2026 


Key Takeaways
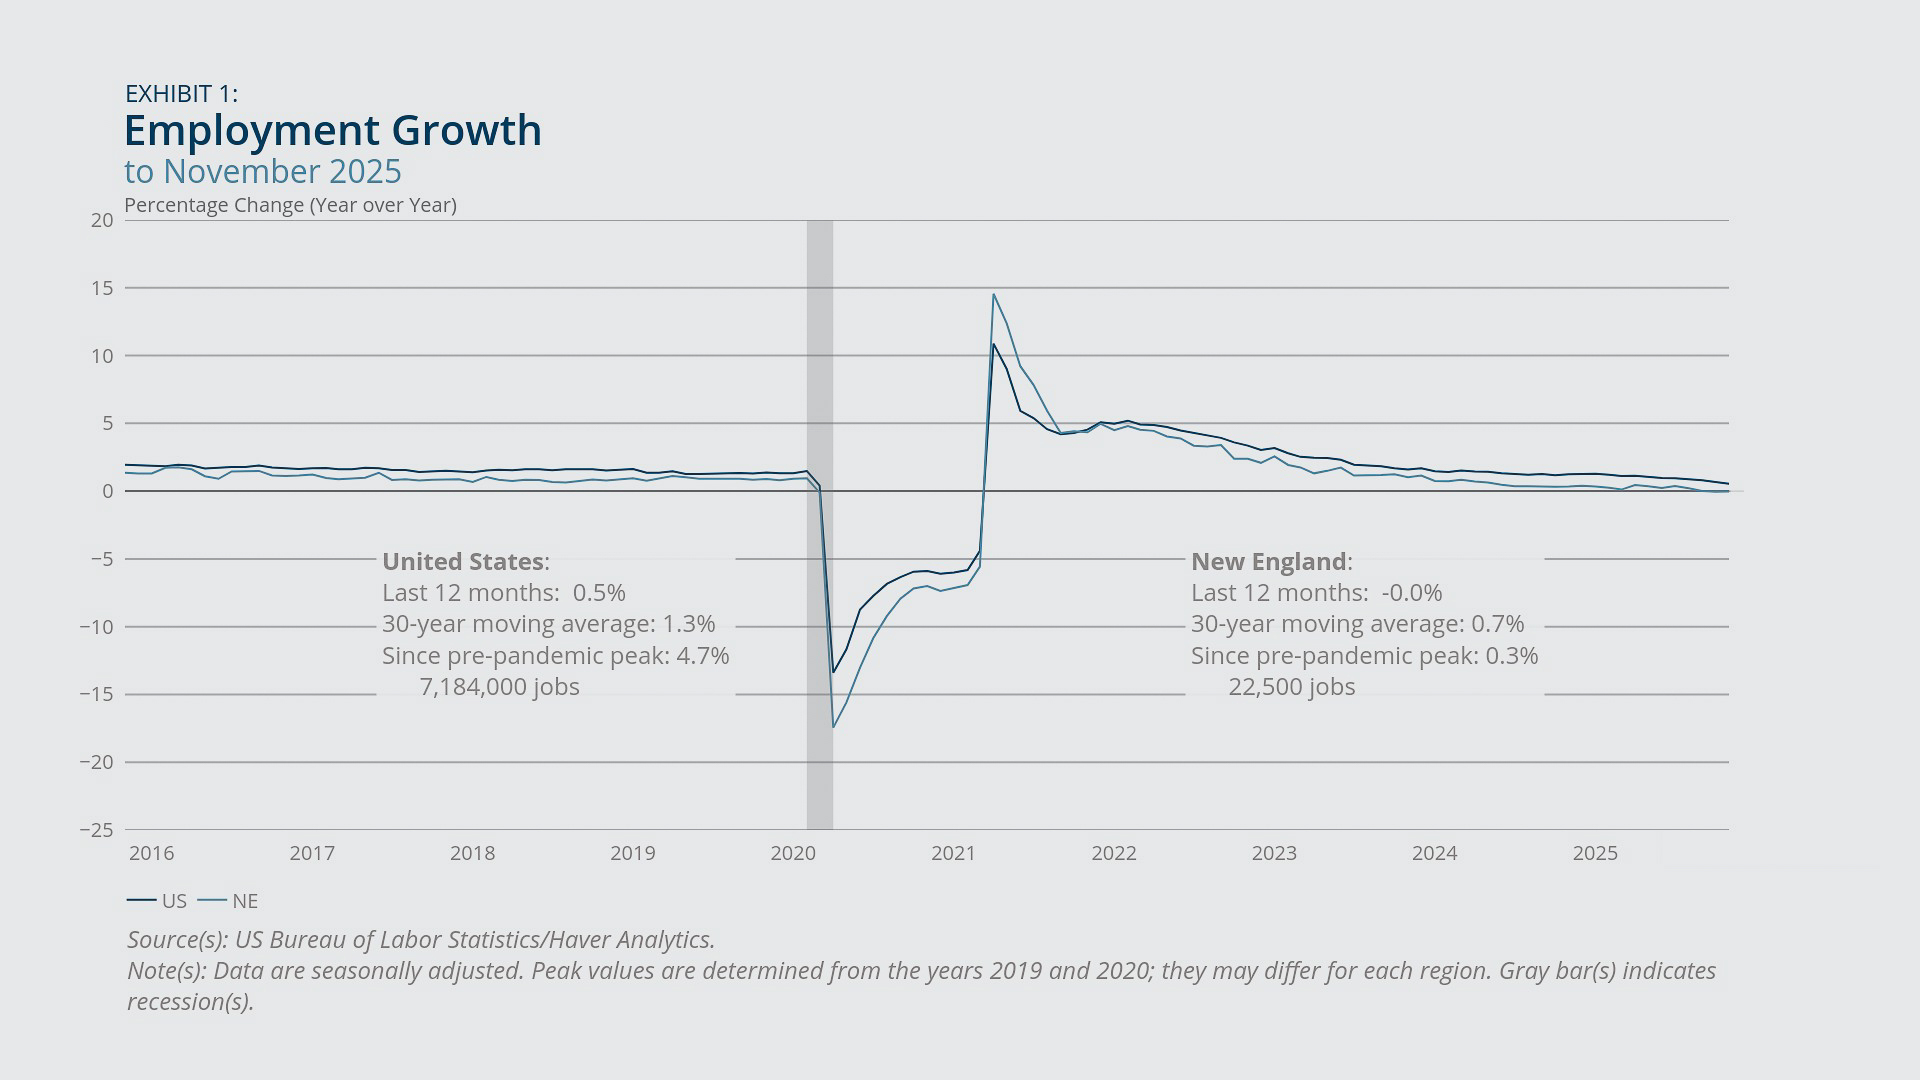
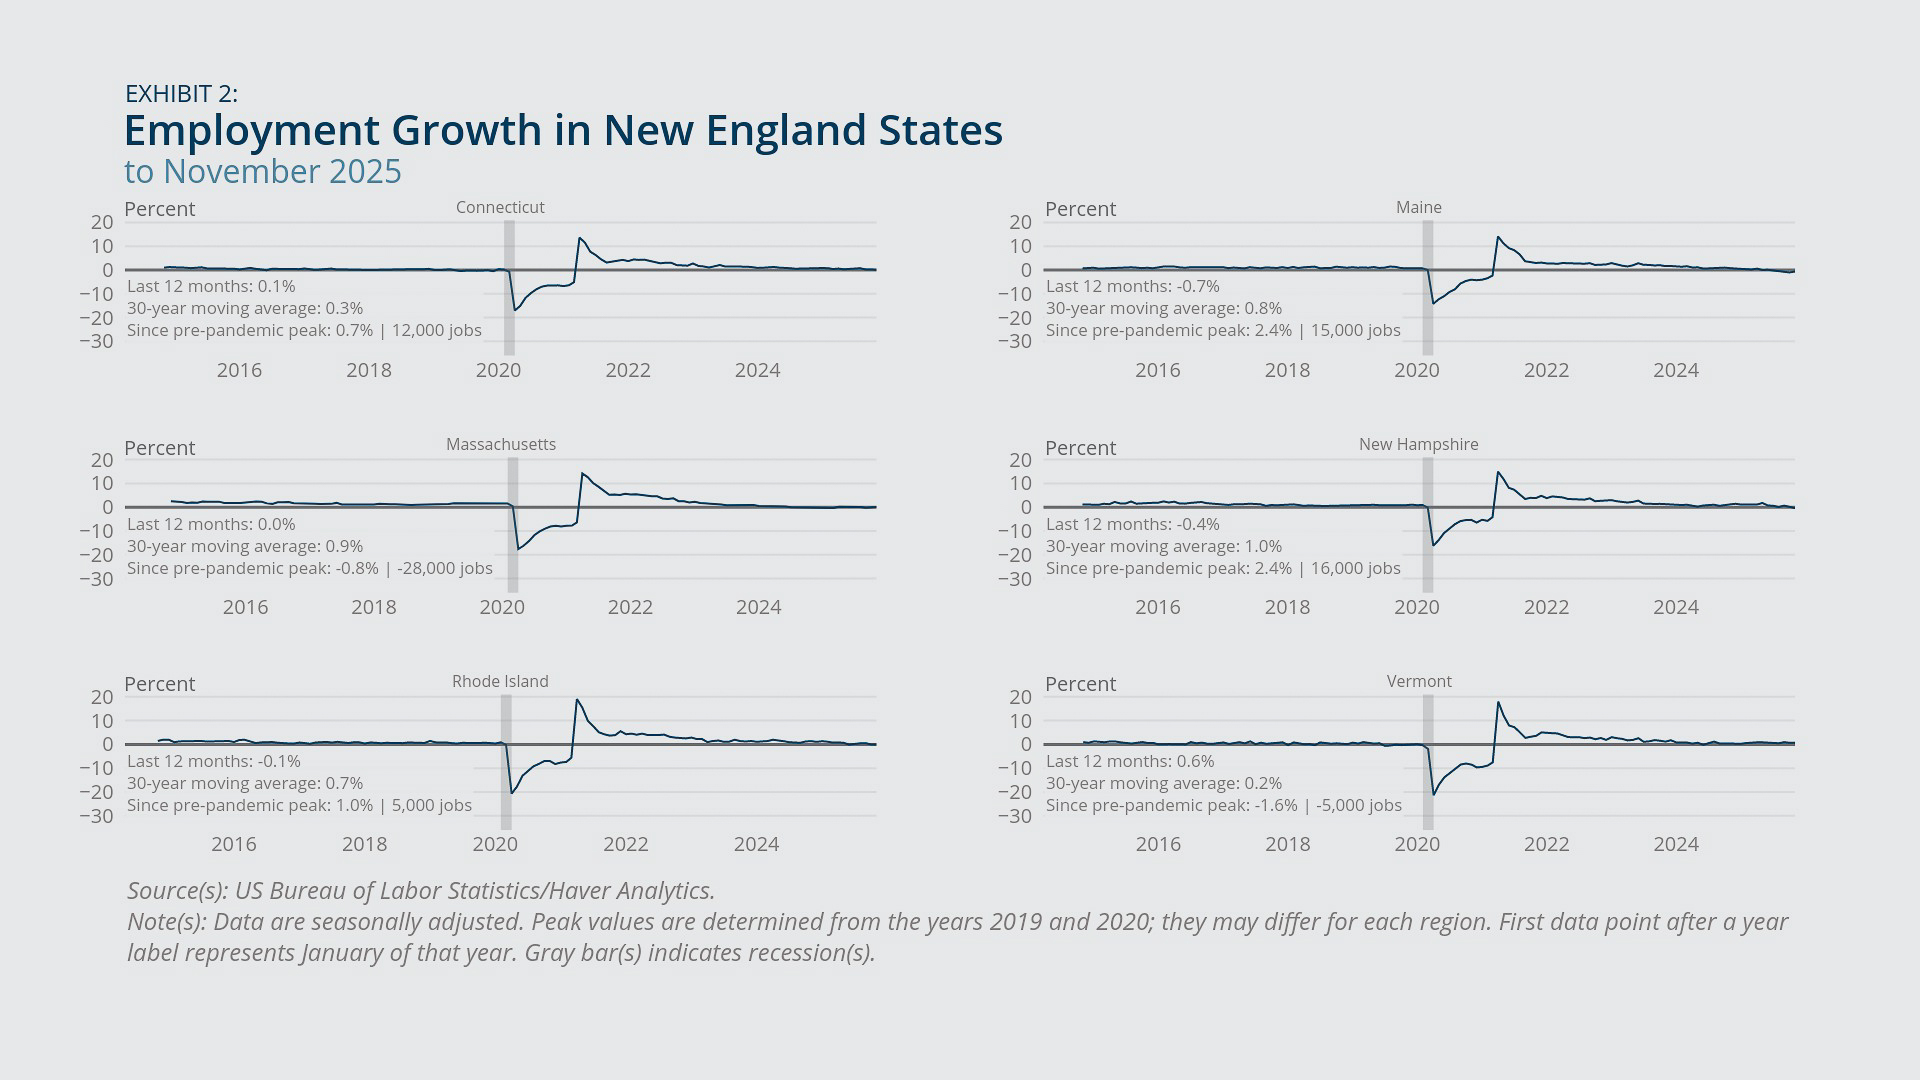
- New England’s nonfarm payroll employment did not grow from November 2024 to November 2025. In fact, Maine, New Hampshire, and Rhode Island experienced declines ranging from 0.1 to 0.7 percent in the one-year period.
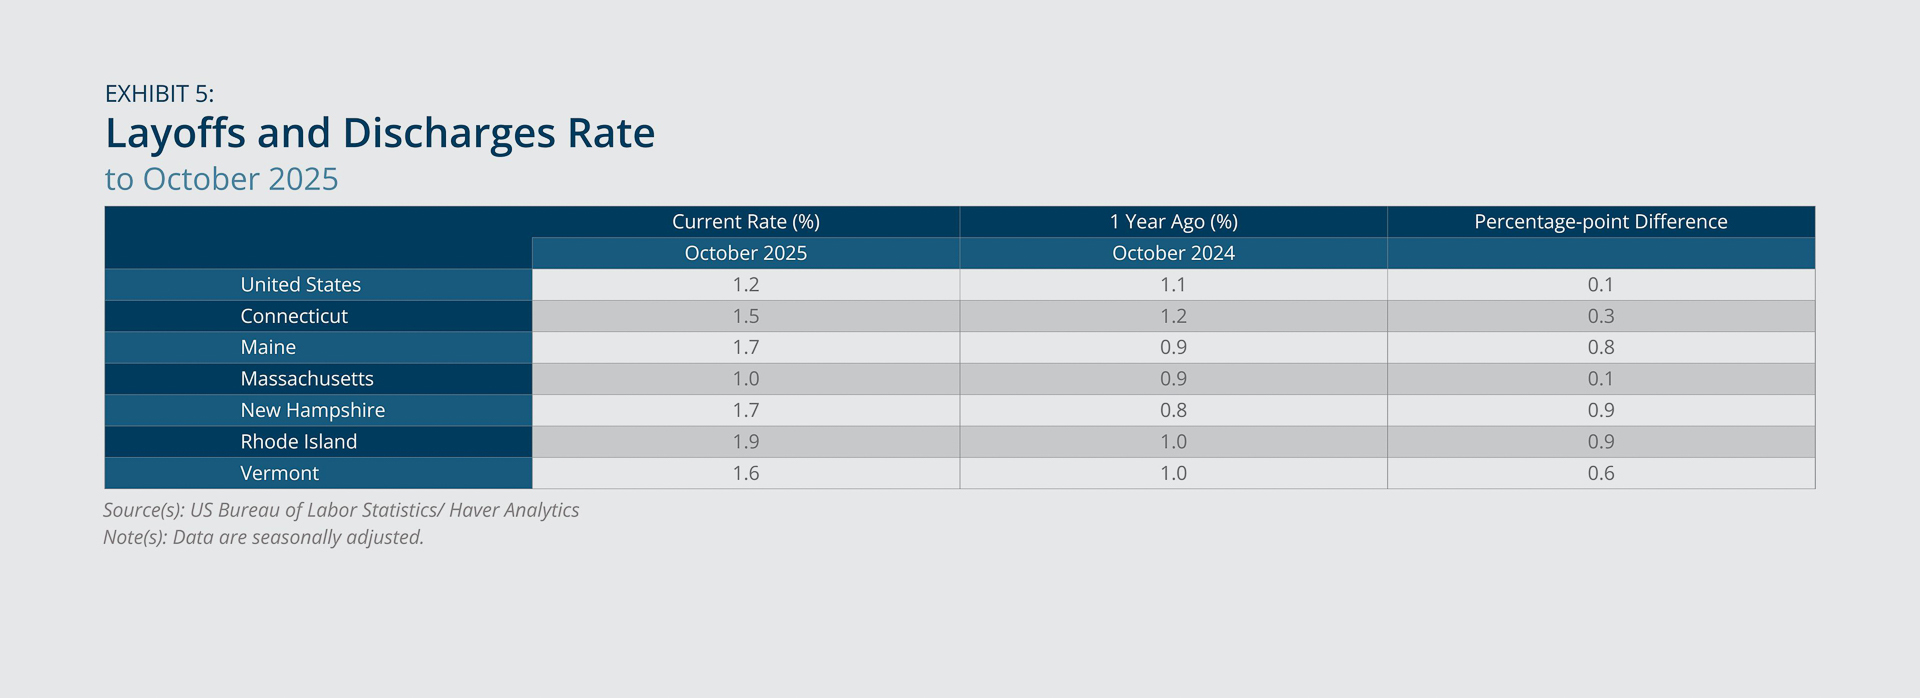
- The layoffs and discharges rate grew from October 2024 to October 2025 both in New England and across the county, with the regional increase larger than the national increase.
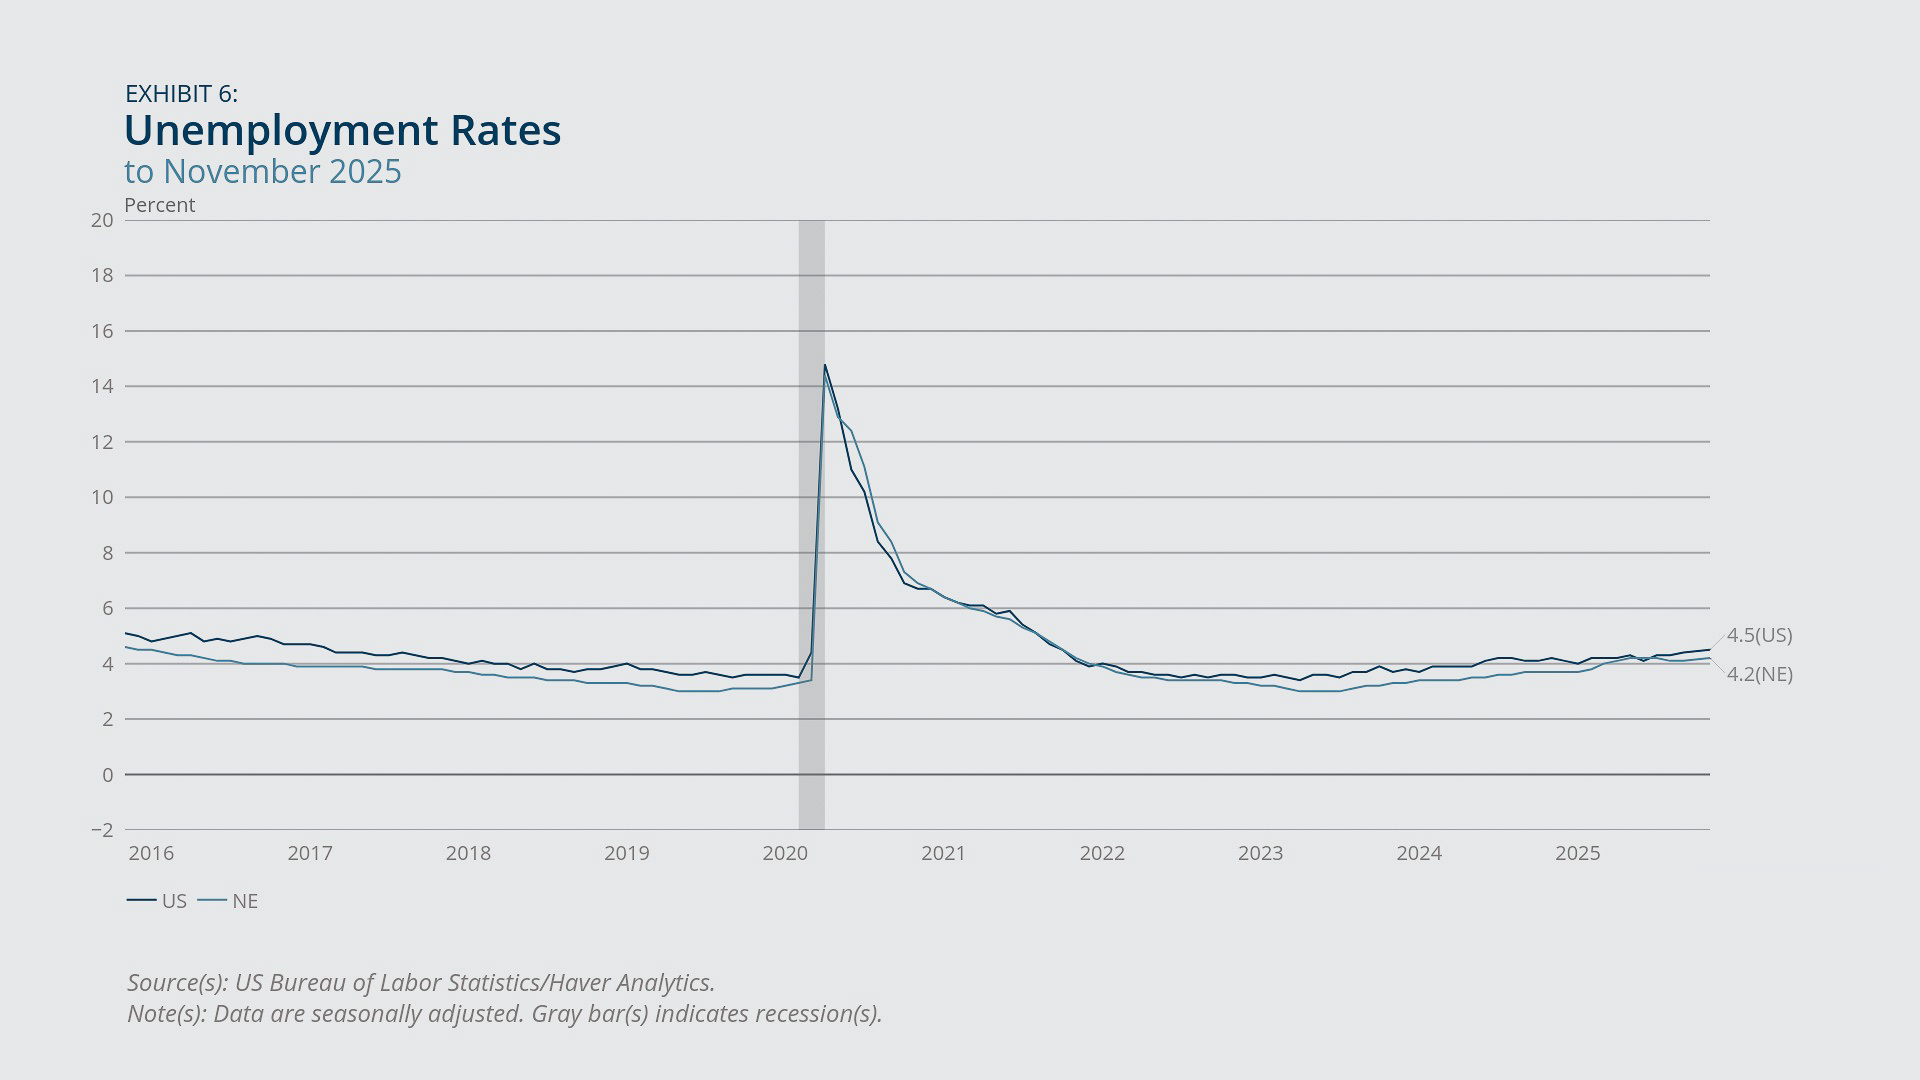
- New England’s unemployment rate for November 2025 rose to 4.2 percent after increasing 0.5 percentage point over the one-year period. It was still lower than the national unemployment rate of 4.5 percent for the same month.
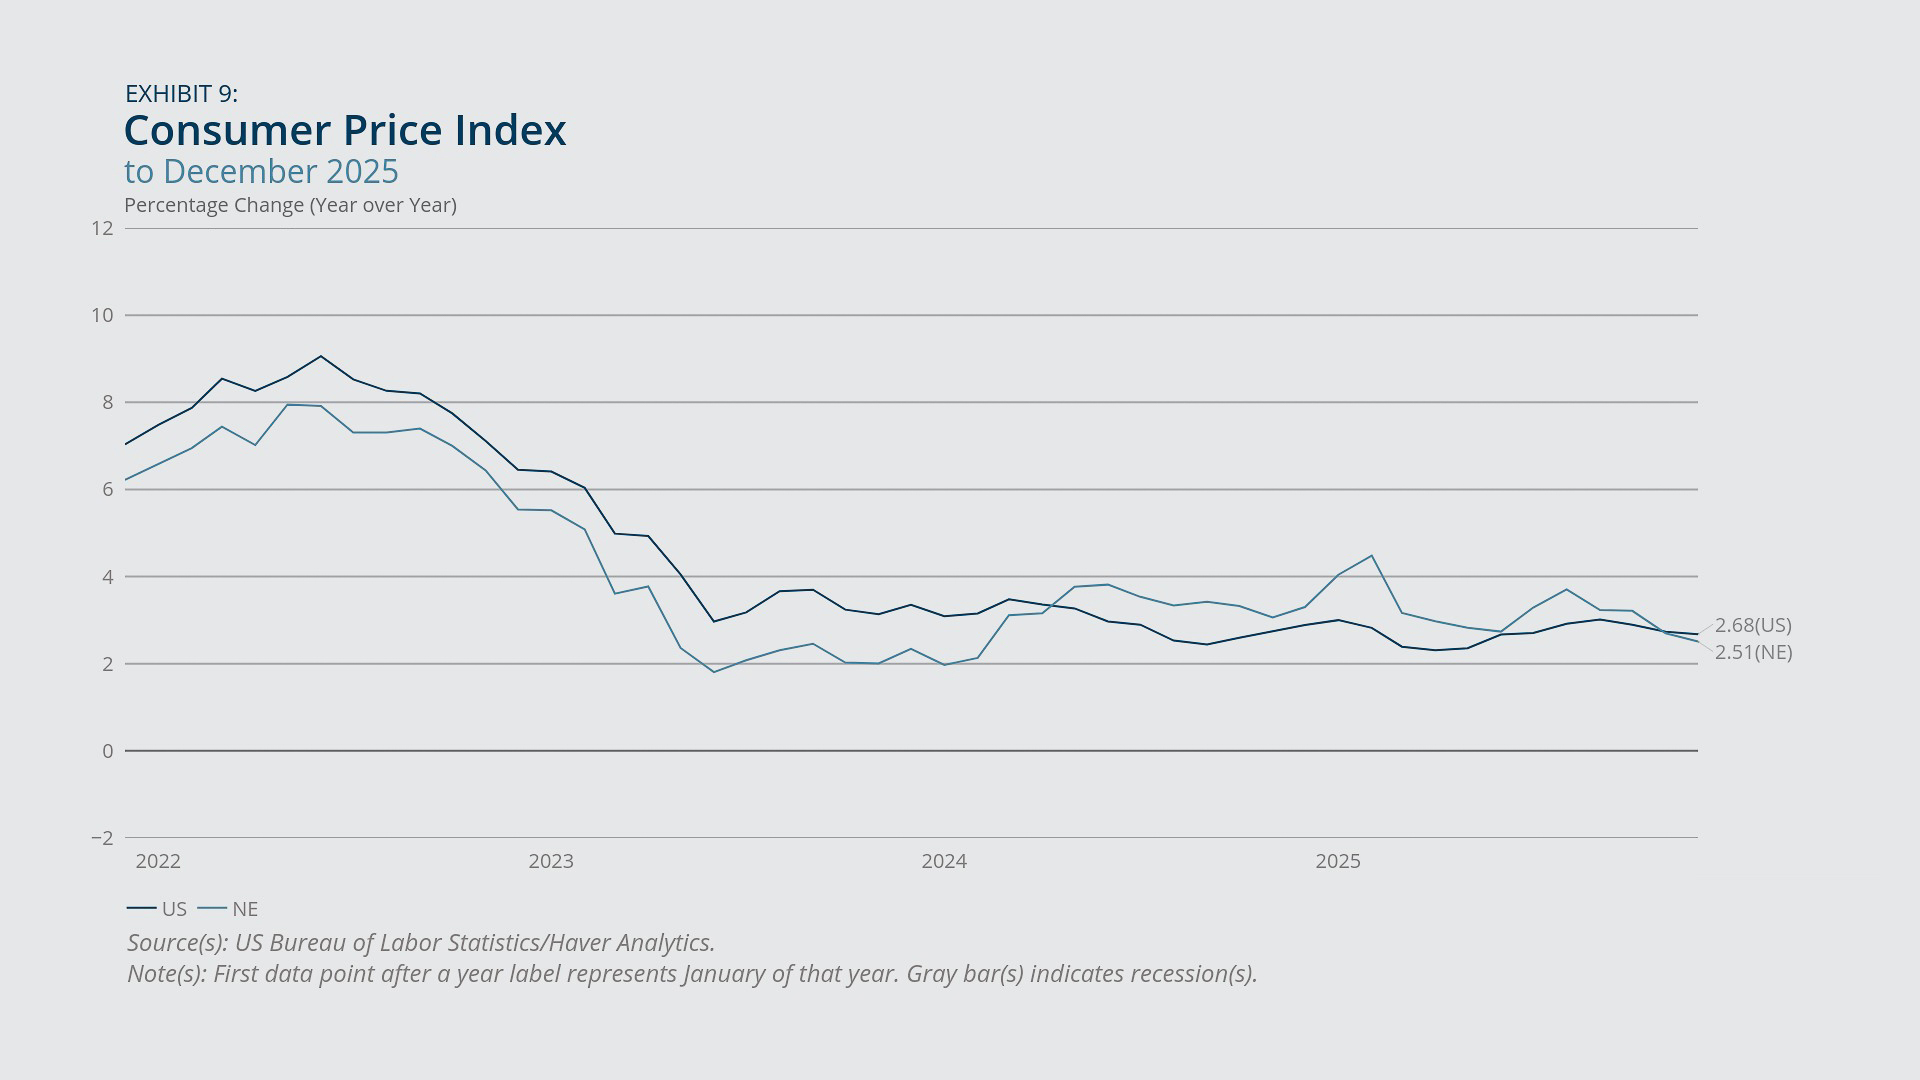
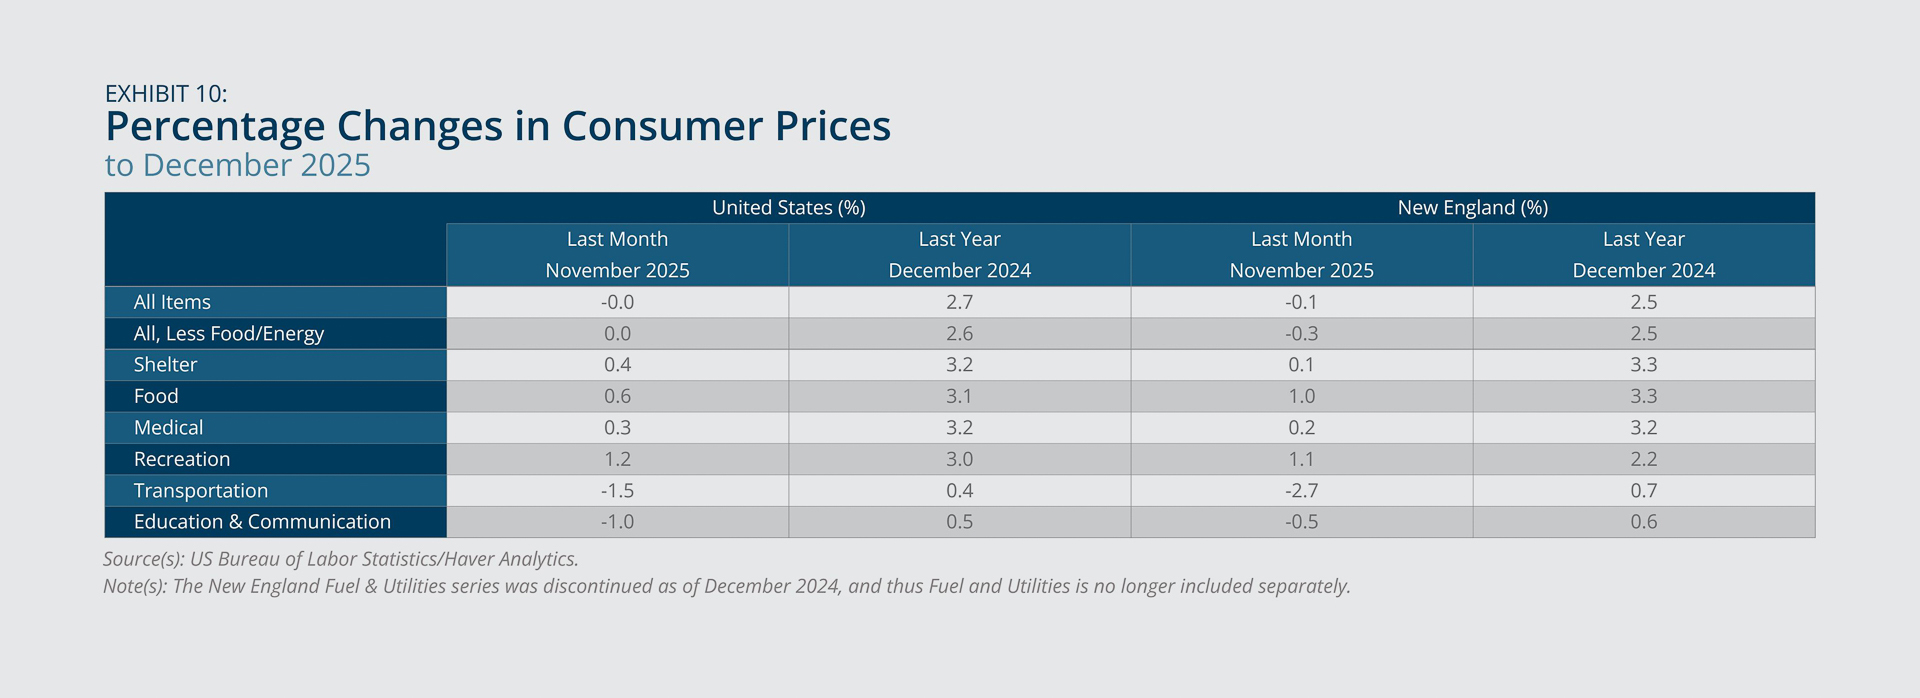
- New England’s inflation rate was lower than the US rate in December 2025 but remained higher than 2 percent. In particular, shelter and food prices in the region both increased more than 3 percent from December 2024 to December 2025.
Sign up for new research and data on the New England economy.
Payroll Employment
- New England’s payroll employment in November 2025 was essentially the same as a year prior. Maine, New Hampshire, and Rhode Island saw declines ranging from 0.1 to 0.7 percent in the 12-month period.
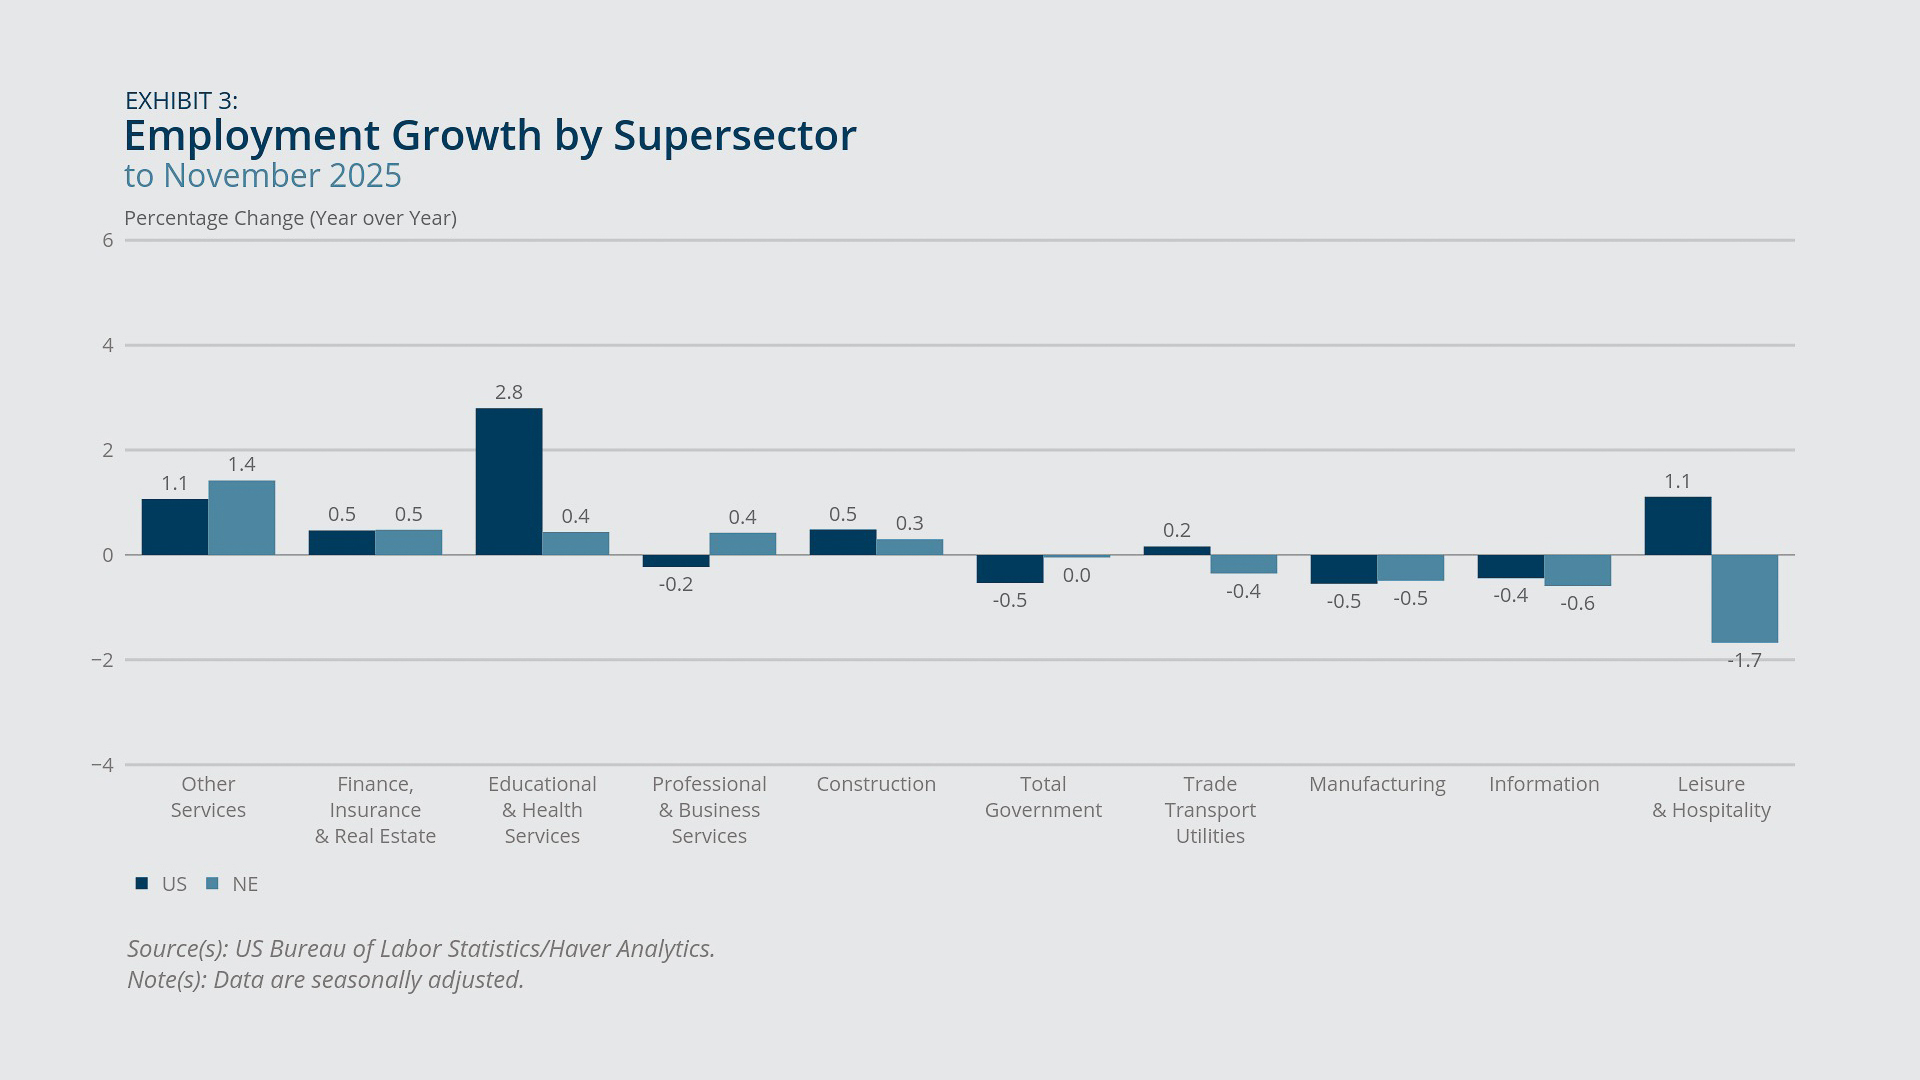
- The region’s leisure and hospitality sector experienced the greatest job loss among all supersectors over that period. In addition, educational services lost 2.3 percent of employment.
- Both the region and the nation experienced an increase in the layoffs and discharges rate from October 2024 to October 2025. The increase for each New England state was larger than that for the United States, except for Massachusetts.
New England experienced no employment growth from November 2024 to November 2025 (Exhibit 1). By contrast, employment growth for the United States was just 0.5 percent in that 12-month period, which is less than half of the growth rate for the November 2023–November 2024 period.
New England states diverged in the rate of job growth. Maine, New Hampshire, and Rhode Island saw a decline in nonfarm payroll employment for November 2025 compared with November 2024 (Exhibit 2). The decline ranged from 0.1 percent for Rhode Island to 0.7 percent for Maine. By contrast, Vermont’s employment grew about 0.6 percent year-over-year, which was higher than the US rate. Connecticut and Massachusetts employment barely grew, with increases of only 0.1 percent and 0.05 percent, respectively.
Other services led all New England supersectors in employment growth from November 2024 to November 2025 (Exhibit 3).1 It saw an increase of 1.4 percent, which was greater than the 1.1 percent increase nationally. By contrast, New England’s leisure and hospitality sector experienced greater job loss than other supersectors over that period. It lost 1.7 percent of employment. Nationally, leisure and hospitality employment grew 1.1 percent.
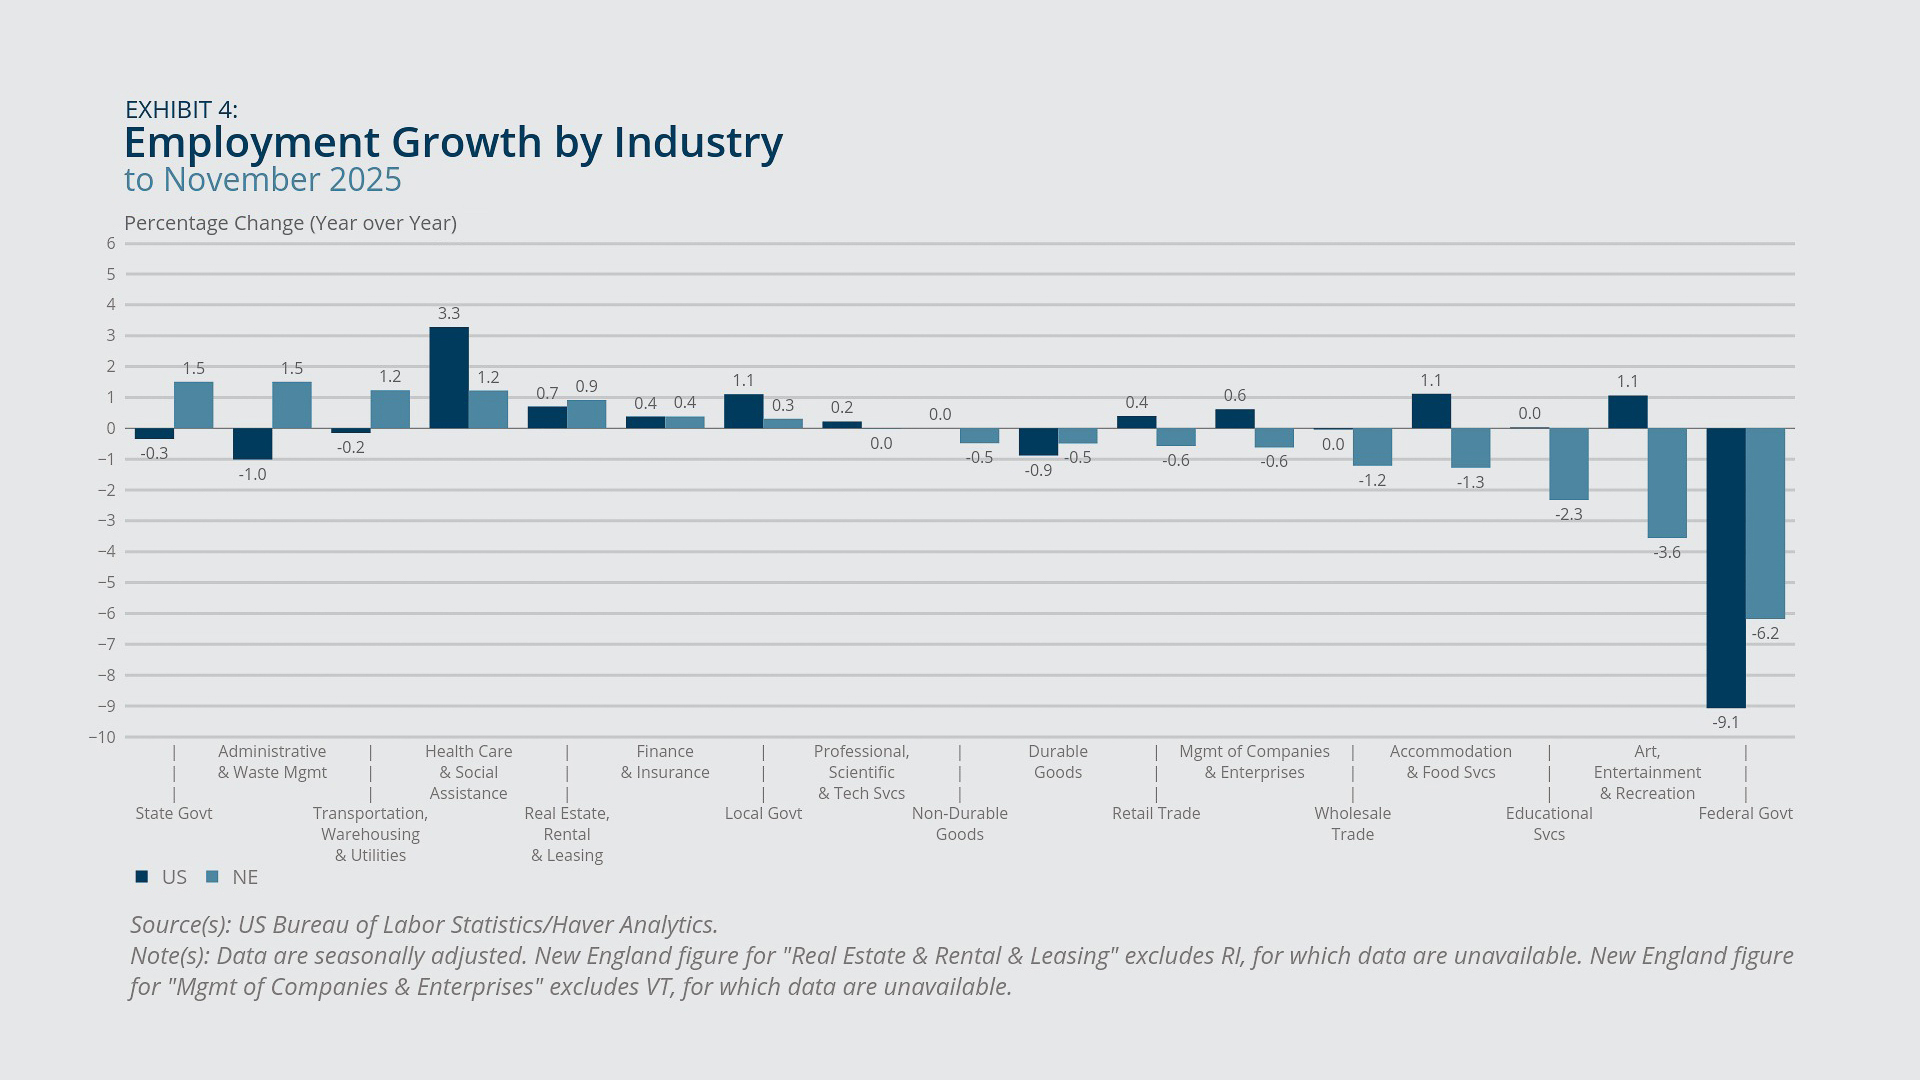
Across all supersectors nationally, educational and health services had the highest growth rate from November 2024 to November 2025, 2.8 percent. That supersector saw much slower growth in the region, with an increase of only 0.4 percent during the same period. The slow growth is attributable partly to a 2.3 percent drop in jobs in educational services (Exhibit 4). The drop was offset by a gain of 1.2 percent in the number of health care and social assistance jobs.
In addition, there was a large decrease in federal government jobs year over year: 9.1 percent for the United States and 6.2 percent for New England (Exhibit 4). The US Bureau of Labor Statistics did not attribute the decrease to the federal government shutdown from October 1 through November 12, 2025. According to its January 7, 2026 news release, the survey that collects payroll employment data treated federal government employees who were on furlough during the government shutdown as employed because these employees “worked or received pay, even if later than usual, for the pay period that included the 12th of the month,” which was the reference period for November in that survey.2
Each New England state and the United States experienced an increase in its layoffs and discharges rate from October 2024 to October 2025 (Exhibit 5). With the exception of Massachusetts, all New England states had a larger increase than the United States during that period. The increase ranged from 0.3 percentage point for Connecticut to 0.9 percentage point for New Hampshire and Rhode Island.

Federal Reserve Bank of Boston
Federal Reserve Bank of Boston
Federal Reserve Bank of Boston
Federal Reserve Bank of Boston
Federal Reserve Bank of Boston
Household Employment
- New England experienced a year-over-year increase in the unemployment rate for November 2025 that was larger than the increase in the US rate.
- Despite the larger increase, the region still had a lower unemployment rate than the nation. Vermont had one of the lowest rates in the country, less than 3 percent.
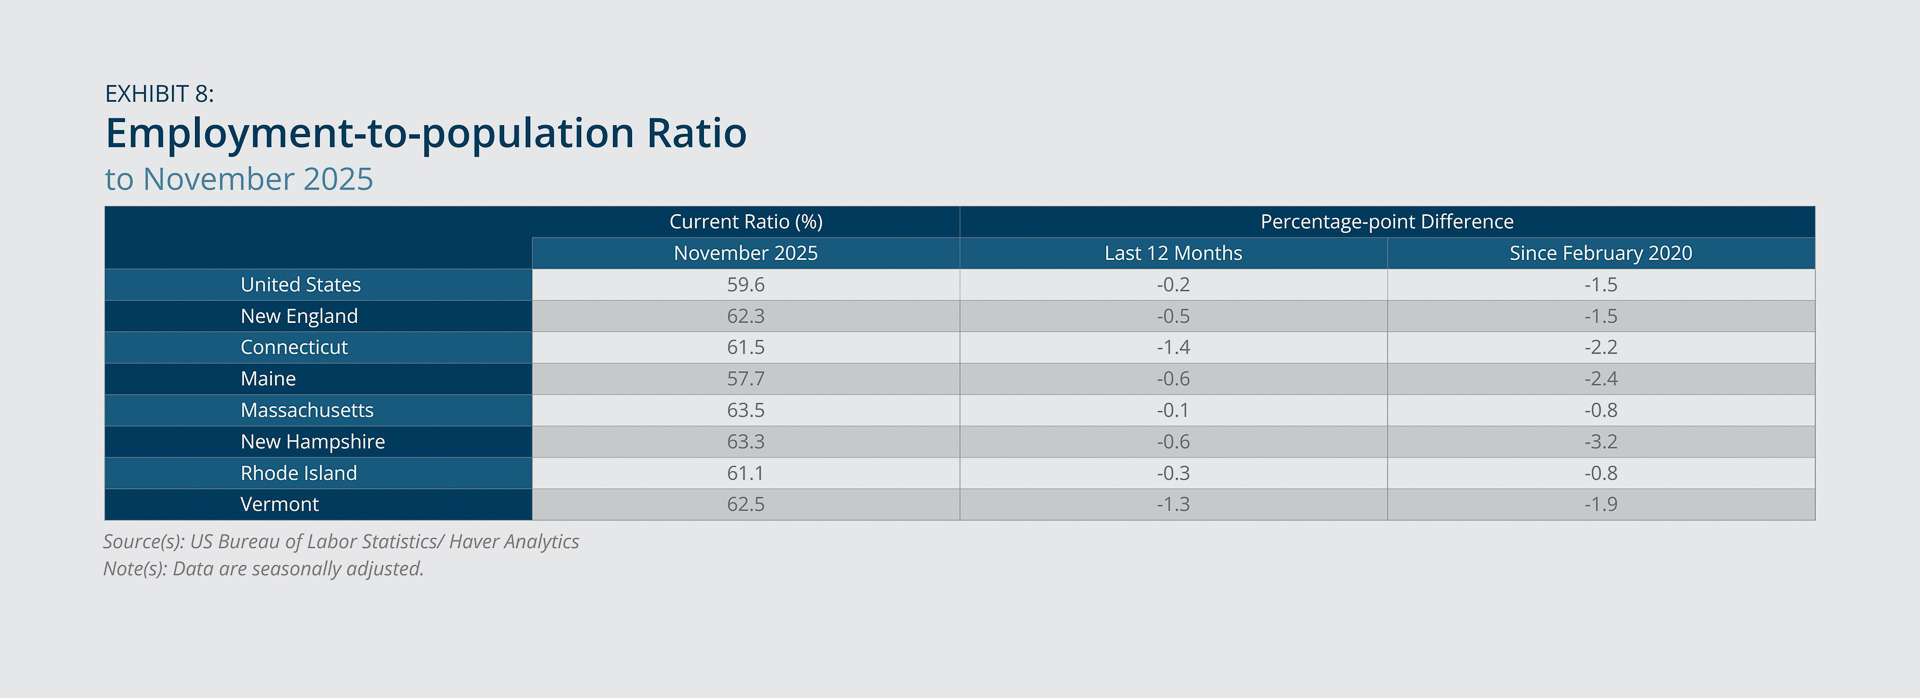
- Compared with the United States, New England saw a larger decrease in its employment-to-population ratio over the 12-month period ending in November 2025.
New England’s unemployment rate reached 4.2 percent for November 2025, which was lower than the US rate of 4.5 percent for that month (Exhibit 6).3 Vermont had the lowest unemployment rate in the region and the third lowest in the country at 2.6 percent (Exhibit 7).4 Conversely, Massachusetts had the highest unemployment rate in the region at 4.7 percent.
The year-over-year increase for New England was larger than the increase for the United States: 0.5 percentage point versus 0.3 percentage point. In contrast to other New England states, Maine and Rhode Island each experienced a decrease of 0.2 percentage point from a year prior.
In November 2025, the employment-to-population ratio decreased 0.5 percentage point for New England and 0.2 percentage point for the United States from a year prior (Exhibit 8). The region saw a larger decrease in the ratio even though its population grew more slowly than the US population. Each New England state experienced a drop in the ratio over the 12-month period. The declines for Connecticut and Vermont were the largest in the region at 1.4 and 1.3 percentage points, respectively.
Federal Reserve Bank of Boston
Federal Reserve Bank of Boston
Federal Reserve Bank of Boston
Inflation
- New England’s inflation rate in December 2025 was 2.5 percent, which was lower than the US rate.
- Shelter and food prices in New England increased more than 3 percent from December 2024 to December 2025.
According to the year-over-year change in the Consumer Price Index, overall inflation in New England decreased slightly from November to December 2025 (Exhibit 9). At 2.5 percent in December 2025, it was lower than the national rate of 2.7 percent for that month. Among the major categories of consumer prices, shelter and food prices saw the region’s largest annual increases. Both grew 3.3 percent, which was somewhat greater than the corresponding increases for the nation (Exhibit 10).
Federal Reserve Bank of Boston
Federal Reserve Bank of Boston
Endnotes
- The other services supersector includes a wide variety of jobs, such as equipment and machinery repairing, promoting or administering religious activities, grantmaking, advocacy, providing drycleaning and laundry services, personal-care services, death-care services, pet-care services, photofinishing services, temporary-parking services, and dating services.
- See US Bureau of Labor Statistics, Local Area of Unemployment Statistics, State Employment and Unemployment - November 2025 (accessed January 12, 2026).
- In the survey that collects the employment and unemployment information from households, the US Bureau of Labor Statistics considered federal workers who were furloughed during the recent lapse in federal appropriations as employed. These workers worked or received pay in the survey reference week of November 9 through 15, 2025, since the federal government shutdown ended on November 12, 2025, and therefore they were counted as employed. See US Bureau of Labor Statistics, Local Area of Unemployment Statistics, State Employment and Unemployment - November 2025 (accessed January 12, 2026).
- New Hampshire had the sixth-lowest unemployment rate in the country for November 2025. For the ranking of unemployment rates for all 50 states and the District of Columbia, see US Bureau of Labor Statistics, Local Area of Unemployment Statistics, Unemployment Rates for States (accessed January 12, 2026).

 About the Authors
Bo Zhao,
Federal Reserve Bank of Boston
Bo Zhao is a principal economist with the New England Public Policy Center in the Federal Reserve Bank of Boston Research Department.
Email: Bo.Zhao@bos.frb.org
Acknowledgments
Kelly Jackson, a senior data analyst in the Federal Reserve Bank of Boston Research Department, prepared the exhibits for this memo.
Resources
Keywords
- Regional economy ,
- Economic Conditions ,
- New England