Q1 2017: Snapshot of the New England Economy through March 29, 2017 


Economic activity continued to improve into 2017
In the first months of 2017, New England and the United States continued to see improvements in economic indicators. Employment increased, home prices rose, and unemployment rates fell relative to one year prior. Through the fourth quarter of 2016, wage and salary income continued to climb both regionally and nationally compared to the same period in 2015.
Employment
Employment gains persist in 2017
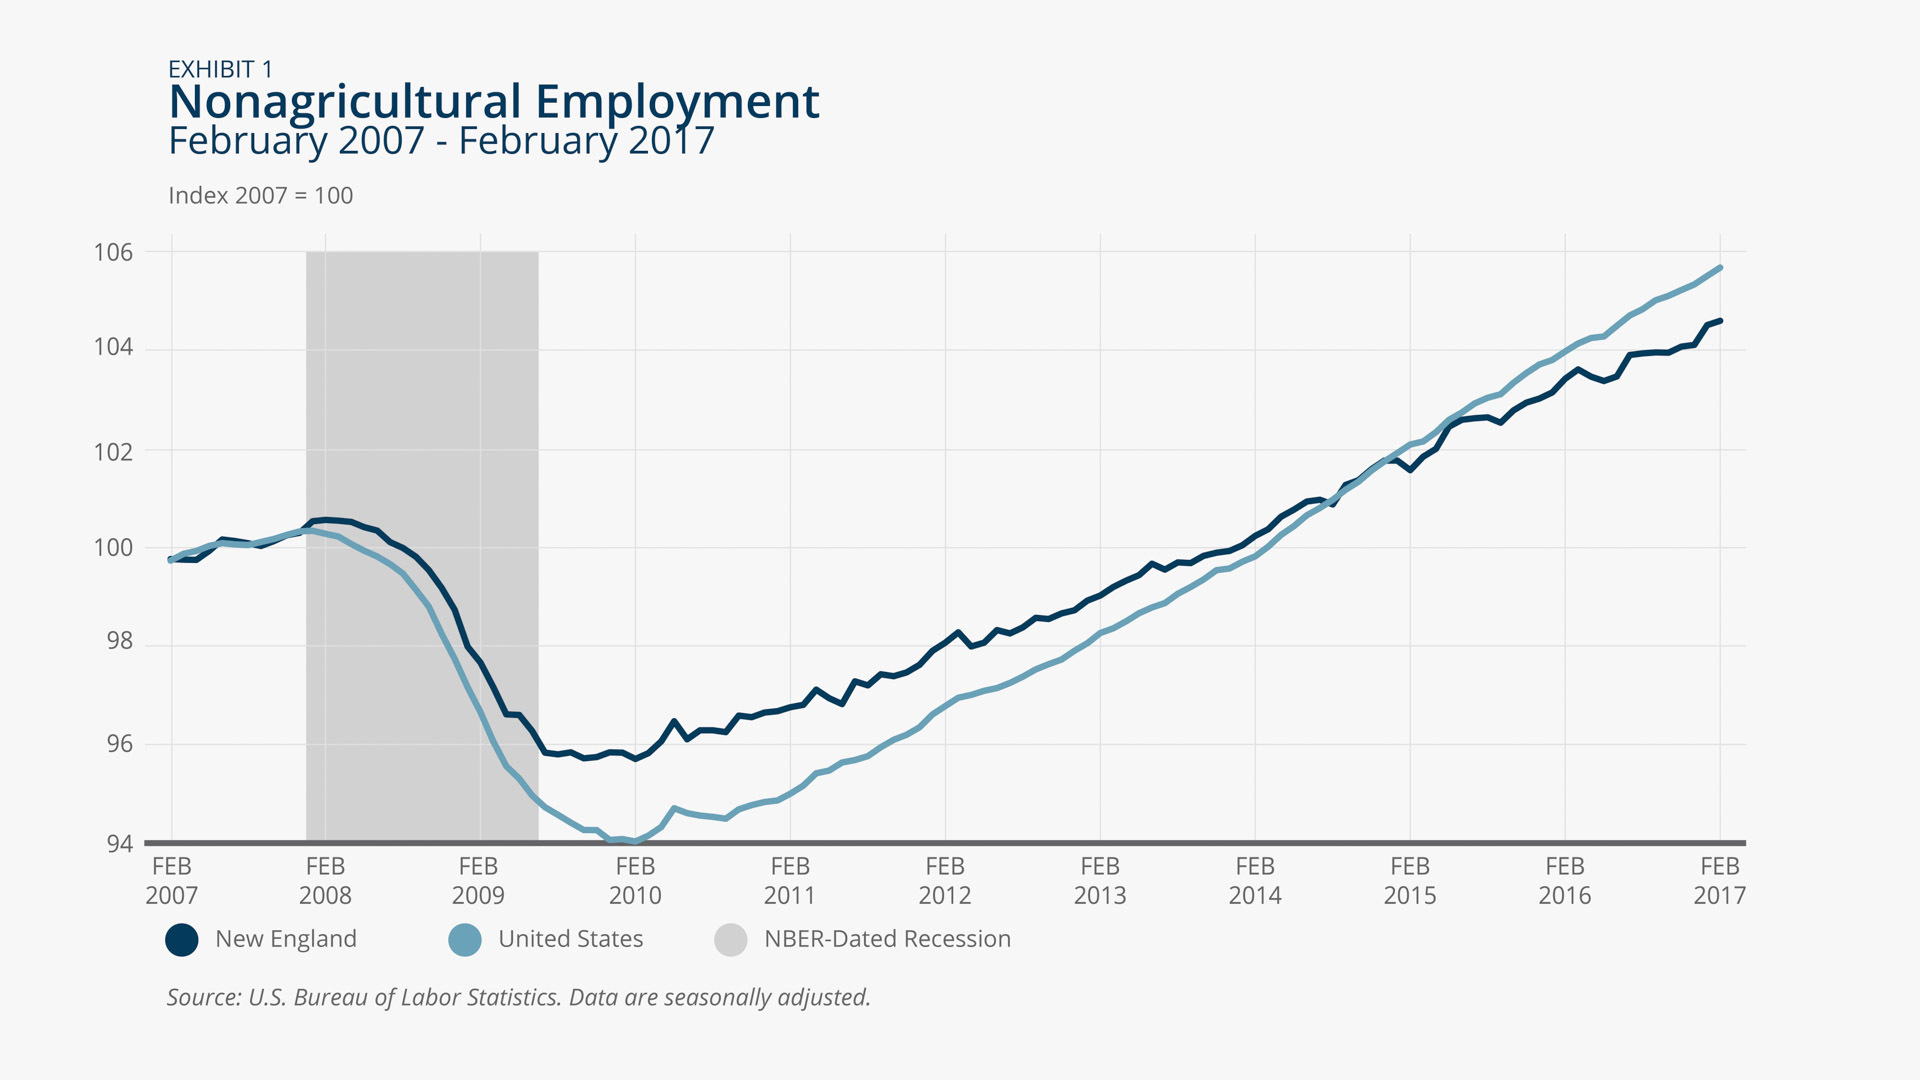
The United States and New England continued to post consistent job gains into 2017. Between February 2016 and February 2017, payroll employment grew by 1.6 percent nationally and 1.1 percent regionally (Exhibit 1). Although employment in each New England state increased since February 2016, job growth rates varied across the region. Within New England, New Hampshire posted the strongest year-over-year job gains, increasing employment by 1.7 percent from February 2016 to February 2017. Over this period, New Hampshire and Massachusetts were the only New England states to meet or exceed the national pace of job growth. Connecticut posted the slowest employment growth in the region, increasing payroll jobs just 0.1 percent over this time period.
Employment growth in Construction in New England outpaces the nation
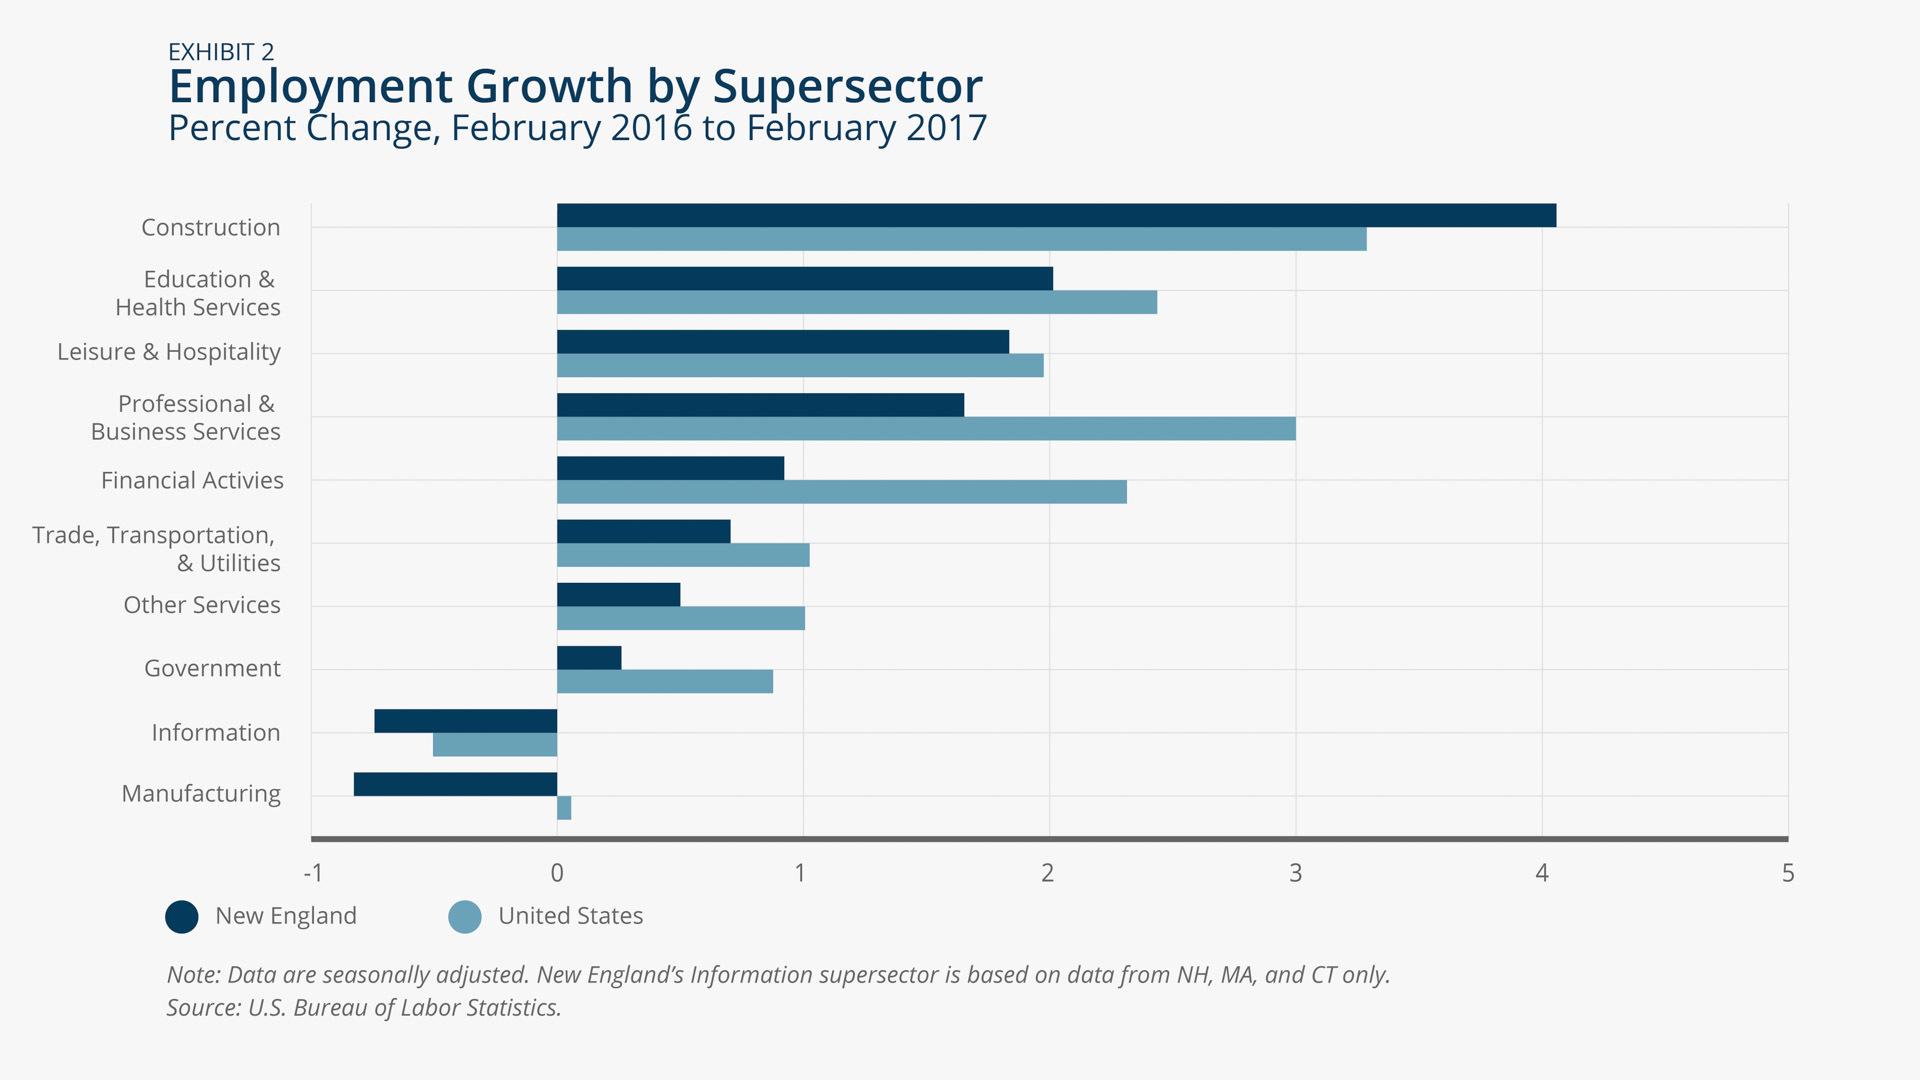
Construction was the lone supersector in New England to outpace national employment growth, experiencing 4.0 percent growth regionally compared to 3.3 percent growth nationally from February 2016 to February 2017 (Exhibit 2). The Information supersector declined more sharply in New England (0.7 percent) than nationally (0.5 percent) during this period, and year-over-year manufacturing employment also shrank in the region by 0.7 percent despite very small growth nationally of 0.06 percent. Manufacturing employment decreased in five of six New England states from February 2016 to February 2017; New Hampshire had a very modest increase of 0.4 percent in manufacturing employment over the same period.

Alex Cronin/Federal Reserve Bank of Boston
Alex Cronin/Federal Reserve Bank of Boston
Unemployment
Unemployment rates declined in all New England states
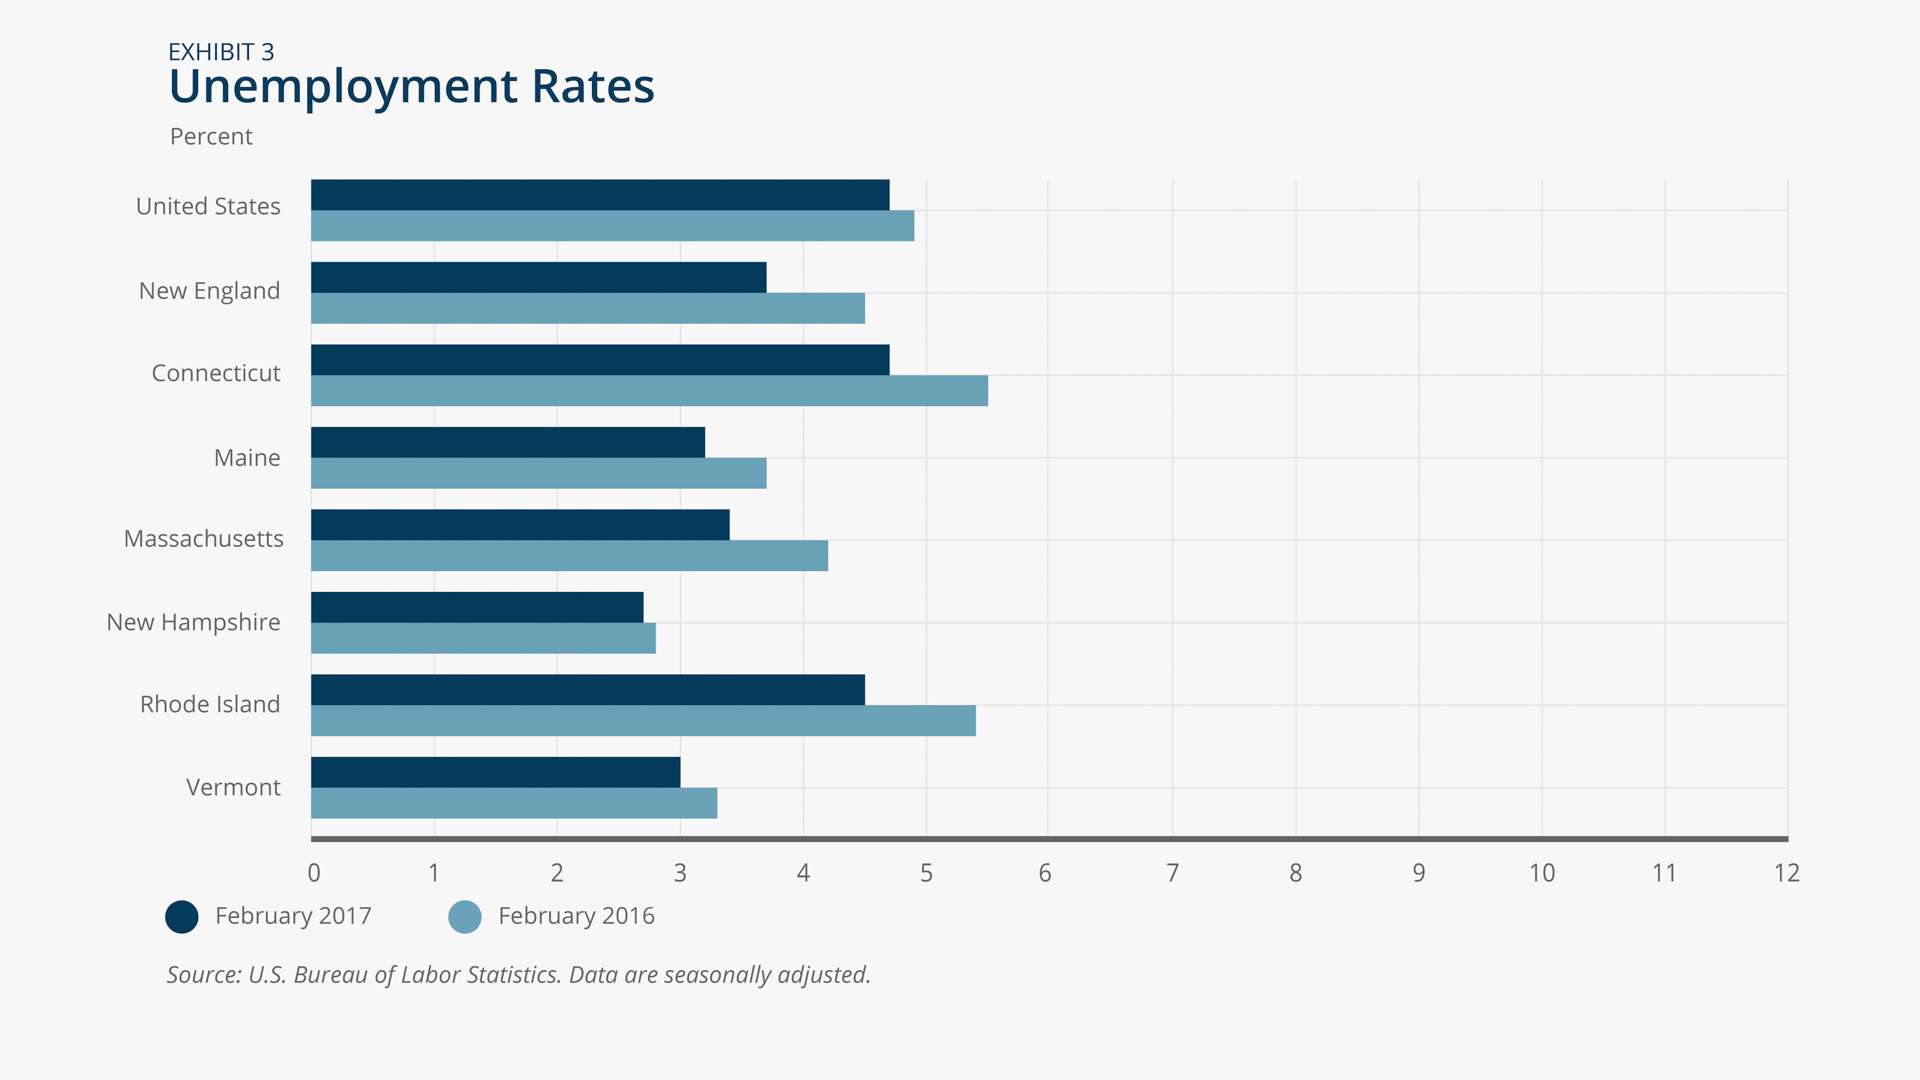
All six of the New England states continued to see unemployment rates decline between February 2016 and February 2017 (Exhibit 3). Over this period, the region's unemployment rate dropped 0.8 percentage points to 3.7 percent. Rhode Island experienced the steepest unemployment rate decline in New England (0.9 percentage points), resulting in a rate of 4.5 percent. The majority of Rhode Island's decline occurred in recent months with a 0.8 percentage point drop in the unemployment rate since September 2016. New Hampshire retained the lowest unemployment rate in the region (2.7 percent). Connecticut's unemployment rate matches the national rate (4.7 percent) and is the highest in New England despite a year-over-year decline of 0.8 percentage points. All other states in the region have lower unemployment rates than the national average.
Alex Cronin/Federal Reserve Bank of Boston
Income
Wage and salary income growth continues
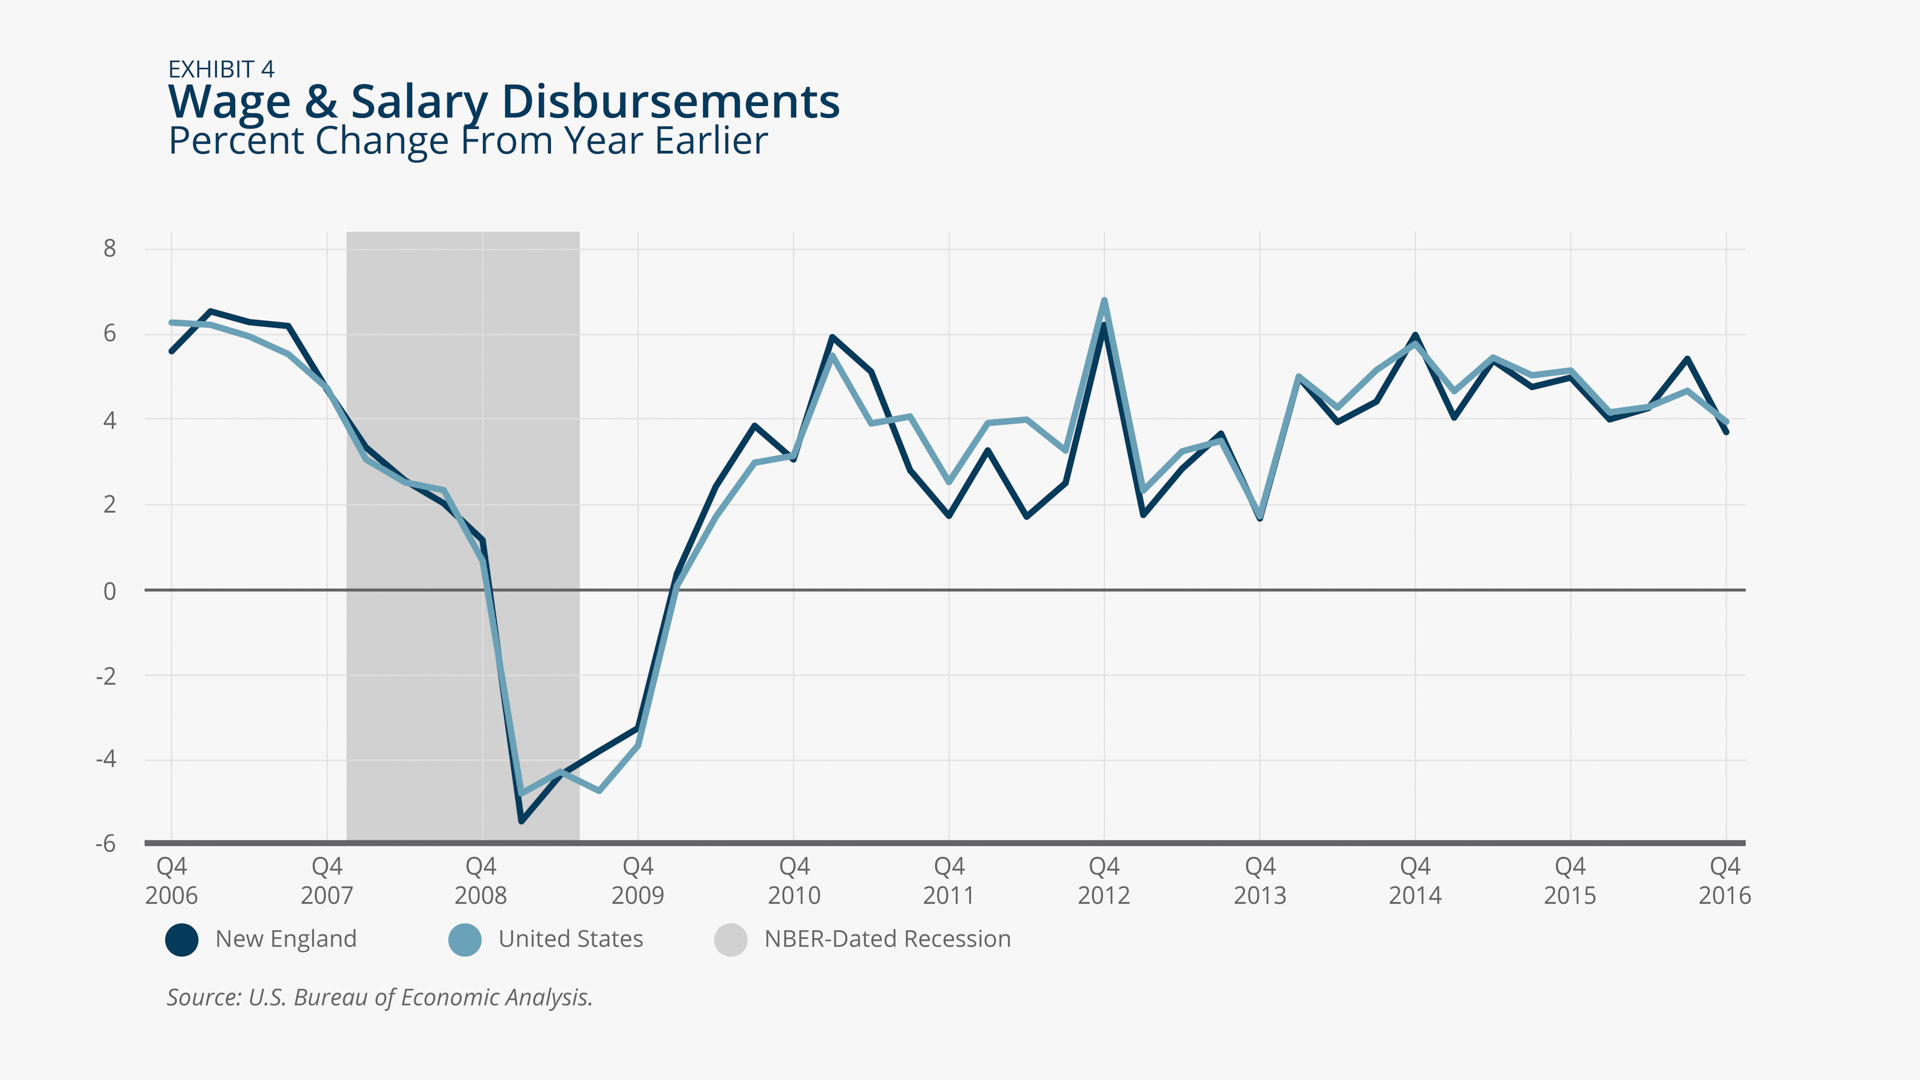
Incomes in New England and the United States continued to grow at a moderate pace through the end of 2016. Wage and salary disbursements, the largest component of income, increased year-overyear by 4.0 percent nationally and 3.7 percent regionally in Q4 2016 (Exhibit 4). All six New England states experienced year-over-year gains in wages and salaries; the rate of growth ranged between 2.2 percent in Connecticut and 4.8 percent in New Hampshire.
Alex Cronin/Federal Reserve Bank of Boston
Home Prices
Rhode Island records fastest house price growth in the region
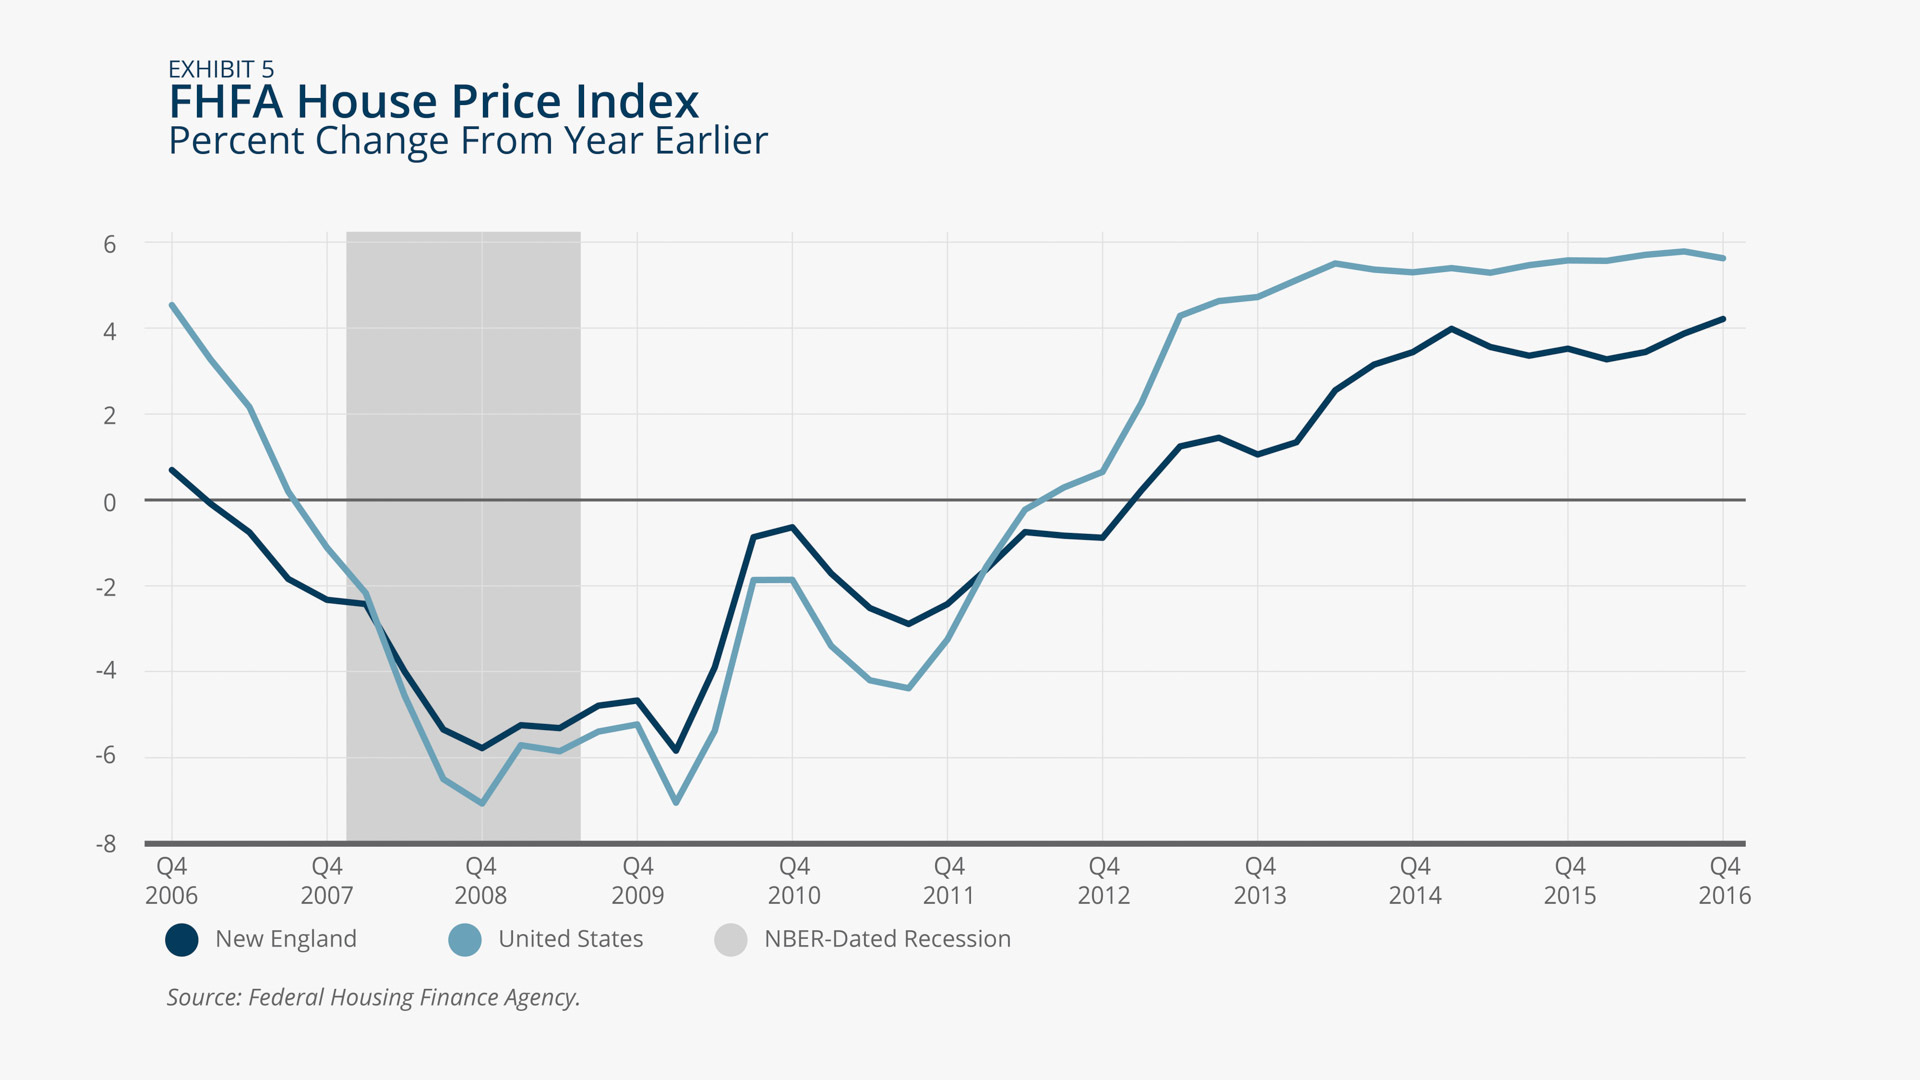
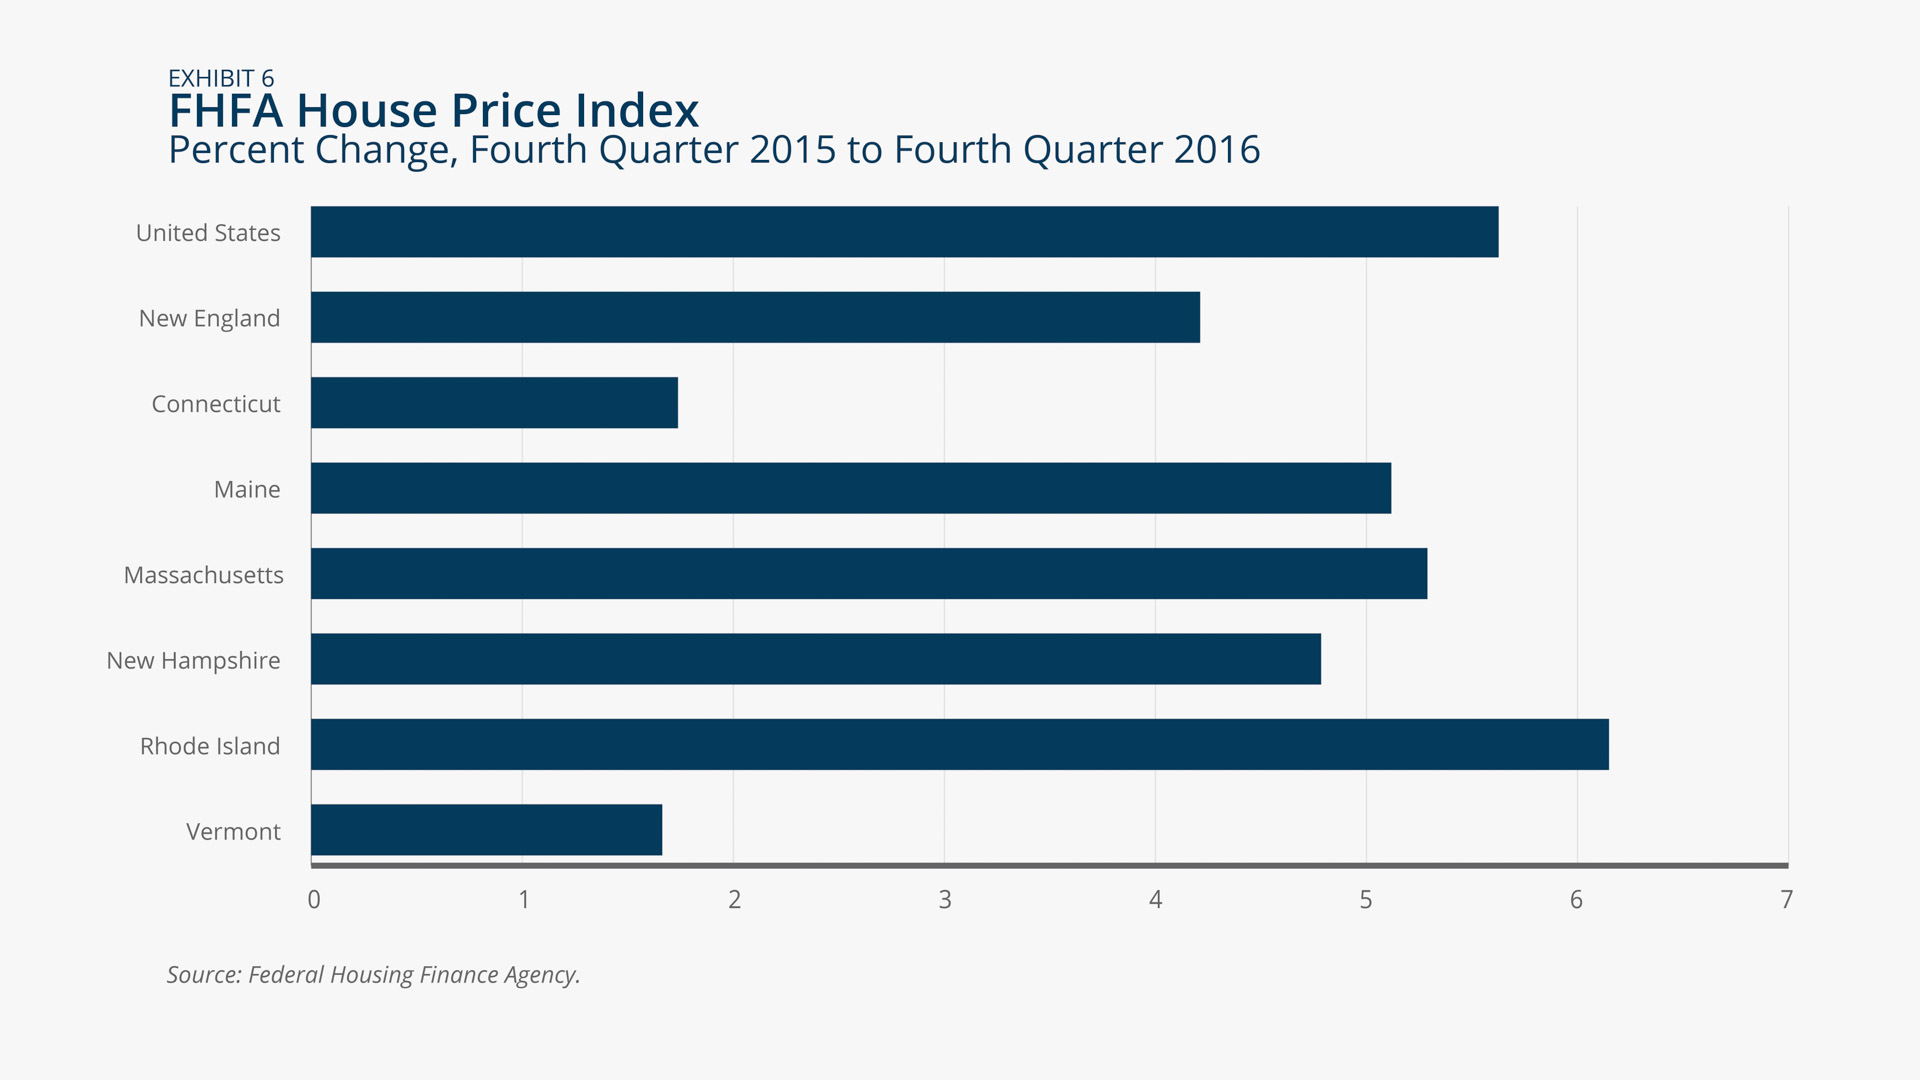
Home prices continued to grow both nationally and regionally, with national growth rates still exceeding regional rates (Exhibit 5). Between Q4 2015 and Q4 2016, home prices increased 5.6 percent nationally and 4.2 percent regionally. All six New England states reported positive house price growth year-over-year (Exhibit 6), but with the exception of Rhode Island (6.1 percent), these gains trailed the national growth rate. House price growth in Connecticut and Vermont was more modest over the period considered, with the two states being tied for the lowest year-over-year growth in the region at 1.7 percent.
Alex Cronin/Federal Reserve Bank of Boston
Alex Cronin/Federal Reserve Bank of Boston

 About the Authors
Riley Sullivan,
Federal Reserve Bank of Boston
Riley Sullivan is a senior policy analyst with the New England Public Policy Center in the Federal Reserve Bank of Boston Research Department.
Email: riley.sullivan@bos.frb.org