How the COVID-19 Pandemic Changed Household Migration in New England 


| Key Facts | |
| Change-of-address requests in New England increased 21% from March 2019 to March 2020. | |
| 36 New England counties gained households through permanent net migration in 2020 compared with only 10 in 2019. | |
| New England urban areas lost 0.2% to 2.8% of their households through permanent net migration in 2020. | |
 |
|
The COVID-19 pandemic and the policies implemented to limit the spread of the virus brought about changes to domestic migration patterns in New England. Overall, the region lost about 50,000 fewer households to permanent out-migration in 2020 compared with 2019, as measured by United States Postal Service change-of-address requests. Every New England state except Massachusetts either lost fewer households or gained households for the first time since at least 2017. However, counties that added households generally saw an increase of less than 1 percent. The characteristics of a community mattered as to whether it gained or lost households. Communities with more than 1,000 people per square mile lost an average of 3 percent of households in 2020, while those with fewer than 1,000 people gained an average of 2 percent. The size of the college-student population in an area did not have a large effect on net migration, despite the move to online schooling for much of 2020. However, the share of seasonal housing in a community did. The number of households in areas with 25 percent to 50 percent seasonal housing stock grew by almost 2 percent through permanent net migration. Temporary net migration also led to positive net migration overall in much of New England in 2020, indicating that many of the new residents may not remain in their communities for the long term.
Sign up for new research and data on the New England economy.
Changes to New England Migration Patterns in 2020
Beginning in March 2020, state and local governments in New England and throughout the country, along with the federal government, enacted restrictions on economic activity to slow the spread of the COVID-19 virus. These restrictions halted in-person schooling for children and prompted many businesses to institute work-from-home policies for their employees. No longer having to commute into an office or send their children to school allowed many Americans to relocate, accelerating a migration from metropolitan areas that had begun before the pandemic.1 This report looks at how the pandemic changed household-migration patterns in New England, identifying the types and locations of communities that experienced net in-migration and those that saw net out-migration. (In this report, “net in-migration” refers to positive net migration, and “net out-migration” refers to negative net migration.)
This report uses change-of-address (COA) requests submitted to the United States Postal Service (USPS) as a measure of domestic migration in New England. One benefit of using COA requests is that they are timely, providing a month-to-month snapshot of moves into and out of U.S. Zip codes. Net migration is the difference between a Zip code’s COA in-requests and COA out-requests.2 In recent years, domestic migration estimates using COA requests have followed the same general trend as the estimates from the U.S. Census Bureau.3 However, COA requests tend to undercount the total number of people who relocate, mainly because not everyone who moves files a COA request. Also, COA requests can be made by individuals or families, and so they relate more closely to the number of households that move than to the number of people.4
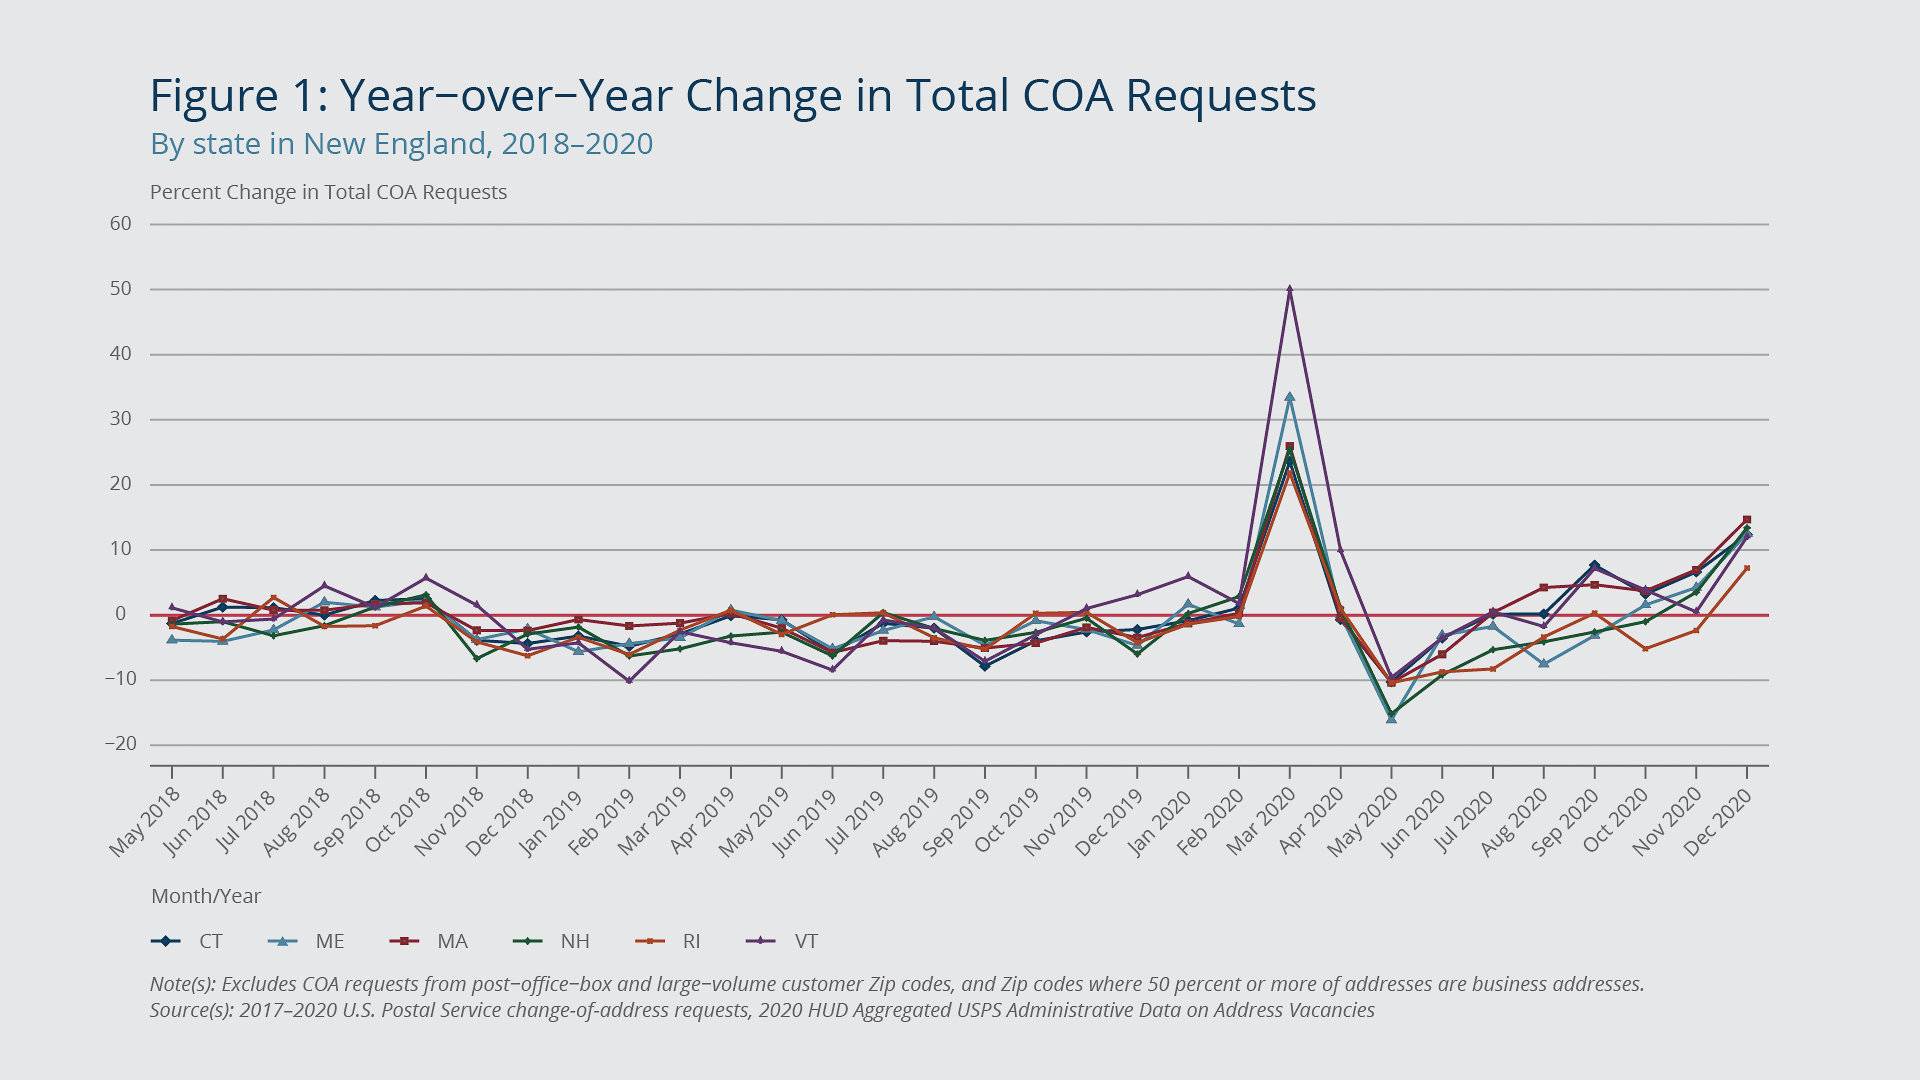
Figure 1 shows the year-over-year change in total COA requests for each New England state. In the two years before the pandemic, the number of monthly requests varied by less than 10 percent year over year in New England and was on the decline in 2019, as fewer people moved into, out of, or within the region. However, in March 2020, at the start of the pandemic, COA requests spiked. The increase in the total number of requests made that month compared with March 2019 ranged from 22 percent in Rhode Island to 50 percent in Vermont. Across the United States, there were 21 percent more COA requests in March 2020 compared with March 2019. The total number of requests made to the USPS remained elevated in many states into April 2020, and then it began to decline during the late spring and early summer as travel restrictions were enforced. When these restrictions were relaxed at the end of 2020, people who had put off moving evidently used the opportunity to relocate, resulting in the number of requests climbing again.

Federal Reserve Bank of Boston
While COA requests can serve as a measure of domestic net migration in the United States, they do not capture migration to and from abroad. Domestic and international net migration together influence population trends in an area. Also important is the natural increase, or the difference between the numbers of births and deaths that occur in a population. In New England, domestic and international migration play particularly important roles in population growth. From 2010 to 2019, 49 percent of the region’s population growth was attributable to total net migration, that is, domestic and international combined.5 In Maine, total net migration was responsible for all of the population growth during this period. Total net migration accounted for more than half of the population growth in New Hampshire and Massachusetts. Connecticut, Massachusetts, and Rhode Island all lost residents through domestic net migration from 2010 to 2019, but international net migration offset much of the losses and resulted in these states either adding residents (Massachusetts and Rhode Island) or seeing only minimal population loss (Connecticut).
Table 1: Net Requests by COA Request Type
By state in New England, 2017–2020
| State | Request Type | 2017* | 2018 | 2019 | 2020 |
| CT | All | -10,209 | -22,308 | -18,664 | 5,426 |
| Permanent | -13,520 | -21,946 | -18,459 | -1,087 | |
| Temporary | 3,398 | -306 | -152 | 6,051 | |
| ME | All | -5,348 | -9,907 | -7,122 | 4,545 |
| Permanent | -6,969 | -8,889 | -6,365 | 888 | |
| Temporary | 1,559 | -784 | -344 | 3,218 | |
| MA | All | -28,457 | -56,009 | -52,132 | -59,043 |
| Permanent | -30,428 | -47,767 | -44,664 | -46,266 | |
| Temporary | 1,829 | -8,036 | -7,359 | -13,608 | |
| NH | All | -5,949 | -11,751 | -8,823 | 379 |
| Permanent | -5,204 | -8,172 | -5,251 | 1,576 | |
| Temporary | -947 | -3,566 | -3,329 | -1,661 | |
| RI | All | -903 | -5,461 | -2,798 | 1,589 |
| Permanent | -2,289 | -5,271 | -2,763 | -5 | |
| Temporary | 1,420 | -100 | -183 | 1,563 | |
| VT | All | -4,891 | -10,210 | -7,458 | -408 |
| Permanent | -4,908 | -8,847 | -6,198 | -3,027 | |
| Temporary | -210 | -1,267 | -1,150 | 2,034 | |
| New England | All | -55,757 | -115,646 | -96,997 | -47,512 |
| Permanent | -63,318 | -100,892 | -83,700 | -47,921 | |
| Temporary | 7,049 | -14,059 | -12,517 | -2,403 | |
|
*2017 net migration estimates include data for only April through December of that year. Note(s): Net COA requests exclude those from post-office-box and large-volume customer Zip codes, and Zip codes where 50 percent or more of addresses are business addresses. Net permanent-COA and net temporary-COA estimates exclude Zip codes where in- or out-requests were suppressed (10 or fewer requests made). For this reason, net permanent- and temporary-COA requests will not sum to all net requests. Source(s): 2017–2020 U.S. Postal Service change-of-address requests, 2020 HUD Aggregated USPS Administrative Data on Address Vacancies |
|||||
Based on COA requests, every New England state except for Massachusetts lost fewer households through net out-migration in 2020 compared with previous years, or they gained residents through net in-migration for the first time since at least 2017. Table 1 shows net migration for each New England state, as measured by COA requests and depending on whether a request was for permanent or temporary relocation.6 Overall, net migration in New England was negative each year from 2017 through 2019, meaning the region experienced net out-migration; that is, more households left than entered the region. However, in 2020, net out-migration fell sharply, with 49,485 fewer households leaving the region compared with 2019. Connecticut, Maine, New Hampshire, and Rhode Island all went from experiencing net out-migration (losing households) each year from 2017 through 2019 to seeing net in-migration (gaining households) in 2020. Vermont saw a dramatic reduction in net out-migration in 2020.
To the extent that the pandemic changed net migration patterns in New England, it accentuated recent trends. New England saw 18,649 fewer households move from the region in 2019 than in 2018, with both permanent and temporary net out-migration declining.7 In 2020, New England experienced the largest single-year decline in permanent net out-migration, as about 36,000 fewer households, or 43 percent fewer, left the region compared with the number that left in 2019. However, it was the decline in temporary net out-migration that pushed many states into positive net migration territory in 2020. The number of households that left the region temporarily in 2020 was only one-fifth of the number from 2019. Connecticut, Maine, Rhode Island, and Vermont all saw positive temporary net migration in 2020, and except for Vermont, all had positive overall net migration as well. Only Maine and New Hampshire had positive permanent net migration in 2020; Rhode Island saw essentially no permanent net migration.
Although net out-migration declined in most of New England in 2020, this was not due to substantially more households moving into or within the region that year. Despite the surge in requests that occurred in March 2020 and the latter part of the year, the number of total COA requests increased only 2.1 percent over 2019 levels. A total of 3.1 million COA requests were made in New England in 2020, which is about 1 percent less than the number made in 2018 and 3.3 percent less than the number made in 2017.8 So while the number of households that moved in 2020 was greater than the number in 2019, migration overall remained below recent historic levels, following a pattern of a decline in domestic migration across the country.9
The decline in net out-migration in New England in 2020 had more to do with changes in the types of moves households made than with a change in the number of moves. Table 2 shows the increases or decreases in the numbers of permanent- and temporary-COA in- and out-requests made in New England from one year to the next. In 2020, there were 62,833 additional COA requests compared with 2019. Of these, 56,159 were in-requests, representing moves either within or into New England. Temporary in-requests accounted for 78 percent of these new in-requests.10 There was also an increase of 6,674 out-requests, all of which were temporary; the number of permanent out-requests declined. As a result, temporary requests increased from about 11 percent of total COA requests made in New England in 2019 to about 14 percent in 2020. Thus, New England experienced a decline in net out-migration in 2020 largely because more households moved into New England than out that year. More specifically, 43,582 more households moved in temporarily and 27,900 fewer households moved out permanently compared with 2019. While the overall net migration trend from 2019 to 2020 was similar to the 2018–2019 trend, the reasons behind it were different. From 2018 to 2019, the number of requests of all types decreased, but the number of out-requests fell by 56,319, which was greater than the decrease of 37,670 in in-requests and resulted in net out-migration declining overall.
Table 2: Year-Over-Year Change in COA Requests
By request type, New England 2017–2020
| Request Type | 2017 to 2018* | 2018 to 2019 | 2019 to 2020 | |
| Permanent | In-request | 6,714 | -32,134 | 7,879 |
| Out-request | 25,720 | -49,326 | -27,900 | |
| Temporary | In-request | -4,916 | -5,548 | 43,582 |
| Out-request | -6,016 | -7,090 | 33,468 | |
| Total | In-request | 1,059 | -37,670 | 56,159 |
| Out-request | 19,954 | -56,319 | 6,674 | |
|
* 2017 net migration estimates include data for only April through December of that year. Note(s): Net COA requests exclude those from post-office-box and large-volume customer Zip codes, and Zip codes where 50 percent or more of addresses are business addresses. Permanent-COA and Temporary-COA estimates exclude Zip codes where in- or out-requests were suppressed (10 or fewer requests made). For this reason, permanent- and temporary-COA requests will not sum to total requests. Source(s): 2017–2020 U.S. Postal Service change-of-address requests, 2020 HUD Aggregated USPS Administrative Data on Address Vacancies |
||||
The 2020 trends for the region described above can also be seen in all but one New England state. Massachusetts was the only New England state to experience an increase in net out-migration in 2020. The state differed in two key ways from the rest of the region. First, relative to the 2019 totals, the number of permanent-COA out-requests increased by 436 in Massachusetts while permanent in-requests decreased by 1,166, the opposite of the regional trend. Second, the number of temporary out-requests made in Massachusetts increased by 24,029, which was larger than the increase of 17,780 in the number of temporary in-requests. In fact, the increase in temporary out-requests in Massachusetts was responsible for 72 percent of the total increase in temporary out-requests made in New England in 2020. Thus, Massachusetts was the only state to see a rise in net out-migration because the increase in both permanent and temporary out-requests in 2020 was greater than the increase in in-requests.
The COA-request data used in this report do not include the origin of households moving into an area or the destination of households moving out, so it is not possible to know how many of these COA requests represent moves within New England versus moves to and from the region.11 Given the increase in the number of temporary in-requests for New England as a whole in 2020, and given that Massachusetts was responsible for 72 percent of new temporary-COA out-requests made in New England that year but only 40 percent of the new temporary in-requests, it is likely that many of the households that left the state relocated to other parts of New England. Regardless of the COA requests’ origins, New England as a whole and most of the region’s states lost fewer or gained more households in 2020 than in recent years. This is not because the pandemic caused a large increase in the number of moves overall; it is due to the type of moves that were made. An increase in temporary in-migration played an important role in many states, as did a decline in permanent out-migration. One explanation could be that households put off moving out of the region during the pandemic while those whose members could work remotely tried out living in new communities. If the latter remain in their new homes long term it could bring many benefits for parts of New England that have experienced stagnant or declining populations. However, if these households return to their original places of residence, or if permanent moves out of the region rebound as the pandemic recedes, New England’s gains in domestic net migration could reverse in the coming years.
Where Households Moved to in New England
The pandemic brought notable changes to migration patterns in New England. As discussed, an increase in the number of temporary moves was a predominate factor. Within New England, the level of net migration and its source (temporary or permanent) varied by county. Some New England counties that gained households in 2020 did so only through temporary net migration, while others did so only through permanent net migration.
Figure 2 shows 2020 permanent and temporary net migration by county as a percentage of total households living in that county in 2019. Thirty-six counties gained households through permanent net migration in 2020 compared with only 10 counties in 2019 and just five in 2018. For the most part, if a county had positive permanent net migration in 2020, it also tended to have positive temporary net migration. Of the 36 counties that added households through permanent net migration in 2020, 26 also added households through temporary net migration. So overall, these counties gained a mix of both permanent and temporary new residents. Six counties added households solely through temporary net migration: New Haven County in Connecticut, Cumberland County in Maine, Berkshire and Nantucket Counties in Massachusetts, and Rutland and Windsor Counties in Vermont.
Counties generally saw a gain or loss of less than 1 percent of their households in 2020 from either permanent or temporary net migration. There were some notable exceptions. Suffolk County, Massachusetts, which includes the city of Boston, saw a 9 percent decrease in its number of households in 2020 due to permanent net migration. However, this is not a new phenomenon, as the county lost about 6 percent of its households to permanent net migration in both 2019 and 2018. This does not mean that Suffolk County lost population during either period. As mentioned, COA requests do not track every move made within the United States, and they do not capture all sources of population change, including the natural increase and international net-migration. In Chittenden County, Vermont, where the city of Burlington is located, permanent household net migration accounted for a 5 percent decrease in the number of households, an improvement over the 6 percent drop in 2019 and 9 percent decrease in 2018. The three counties with the largest percentage increases in the number of households due to permanent net migration were Barnstable County in Massachusetts, Belknap County in New Hampshire, and York County in Maine, each of which saw its number of households rise 2 to 3 percent.
The regional and state-level trends discussed in the previous section that led to increases in net migration were largely mirrored at the county level in 2020. Twenty-seven of the 36 New England counties with positive permanent net migration in 2020 saw their number of permanent-COA out-requests decrease from 2019 to 2020 and their number of permanent in-requests increase. Three of the 36 counties saw both permanent in- and out-requests increase but experienced larger increases of permanent in-requests.12 The remaining six counties that had positive permanent net migration but a decrease in their number of permanent in-requests benefited from a larger decrease in their number of permanent out-requests.13
Federal Reserve Bank of Boston
Counties that did lose households in 2020 through permanent net migration generally lost fewer than they did in 2019. Among the 31 counties with negative permanent net migration in 2020, 26 had declining permanent net out-migration, losing an average of 0.76 percent of their households in 2020 compared with 1.6 percent in 2019. Only five counties in New England lost more households to permanent net migration in 2020 than in 2019. These were Suffolk, Middlesex, and Norfolk Counties in Massachusetts; Androscoggin County in Maine; and Essex County in Vermont.14 Although in the latter four counties, the share of households that were lost increased by less than half a percentage point.15
Table 3: Contribution of Permanent Net Migration to Total Net Migration
By state in New England, 2020
| State | Percentage Contribution |
| Connecticut | 37.2 |
| Maine | 43.7 |
| Massachusetts | 52.6 |
| New Hampshire | 111.5 |
| Rhode Island | 52.2 |
| Vermont | 17.7 |
| New England | 49.2 |
| Note(s): Includes only Zip codes that had both positive permanent net migration and total net migration (permanent plus temporary). COA requests exclude those from post-office-box and large-volume customer Zip codes, and Zip codes where 50 percent or more of addresses are business addresses. Permanent-COA estimates exclude Zip codes where in- or out-requests were suppressed (10 or fewer requests made). If the percentage share contribution was greater than 100 percent it indicates that all of the net migration in 2020 was due to permanent net migration. Source(s): 2020 U.S. Postal Service change-of-address requests, 2020 HUD Aggregated USPS Administrative Data on Address Vacancies |
|
As discussed above, most counties in New England saw some combination of positive permanent and positive temporary net migration. Whether the temporary residents who arrived in 2020 remain long term depends in part on how long the pandemic persists and continues to affect work and social lives and whether these residents can continue to work remotely. Table 3, which includes only Zip codes that saw positive net migration in 2020, shows that among communities that added households overall in 2020, the share of net migration attributable to permanent net migration varies considerably across states. In Connecticut and Maine Zip codes where net migration was positive, less than half was attributable to permanent moves, and in Vermont it was only 17.7 percent. In New Hampshire, permanent net migration was responsible for more than 100 percent of net migration in communities where it was positive; the state saw negative temporary net migration in 2020, but permanent net-migration was large enough to offset this decline.
Local population growth often creates a need for new investment in schools and infrastructure to accommodate new residents. But identifying which communities can expect population changes to persist or become permanent is difficult, especially when the changes are brought about by a shock such as the COVID-19 pandemic. Many of the New England counties that experienced positive temporary net migration in 2020 include vacation communities, thus the net migration gains could be the result of households relocating to their second homes until the pandemic subsides. These communities are likely more prepared for these new residents because they are accustomed to seasonal fluctuations in population. Policymakers concerned about local planning for new residents should focus on areas of their state that had permanent household net migration in 2020 (Figure 2, top panel). However, they should be mindful that just because these new residents applied for permanent COAs in 2020 does not guarantee that they will remain in the communities for the long term. In Connecticut, Maine, and Vermont, most of the net migration in 2020 came from temporary moves, and so these states should expect many of these new residents to return to their original locations, if they have not already done so.
The Types of Communities Households Moved To and From
The characteristics of individual communities likely influenced whether they gained or lost residents during 2020 due to domestic migration. Urban areas were early hot spots for virus transmission, so they may have been more likely to see out-migration during the initial phases of the pandemic. University and college closures could have pushed many students to return home, inflating out-migration in areas with large student populations. Also, the types of housing available in a community could have attracted new residents in search of more space. In particular, areas with large seasonal housing stocks may have been pre-disposed to attract residents who already owned property in the area or were seeking readily available rental properties. For this section of the report, Zip codes have been converted to U.S. Census ZCTAs to link household information and other data for an area at a local level.16
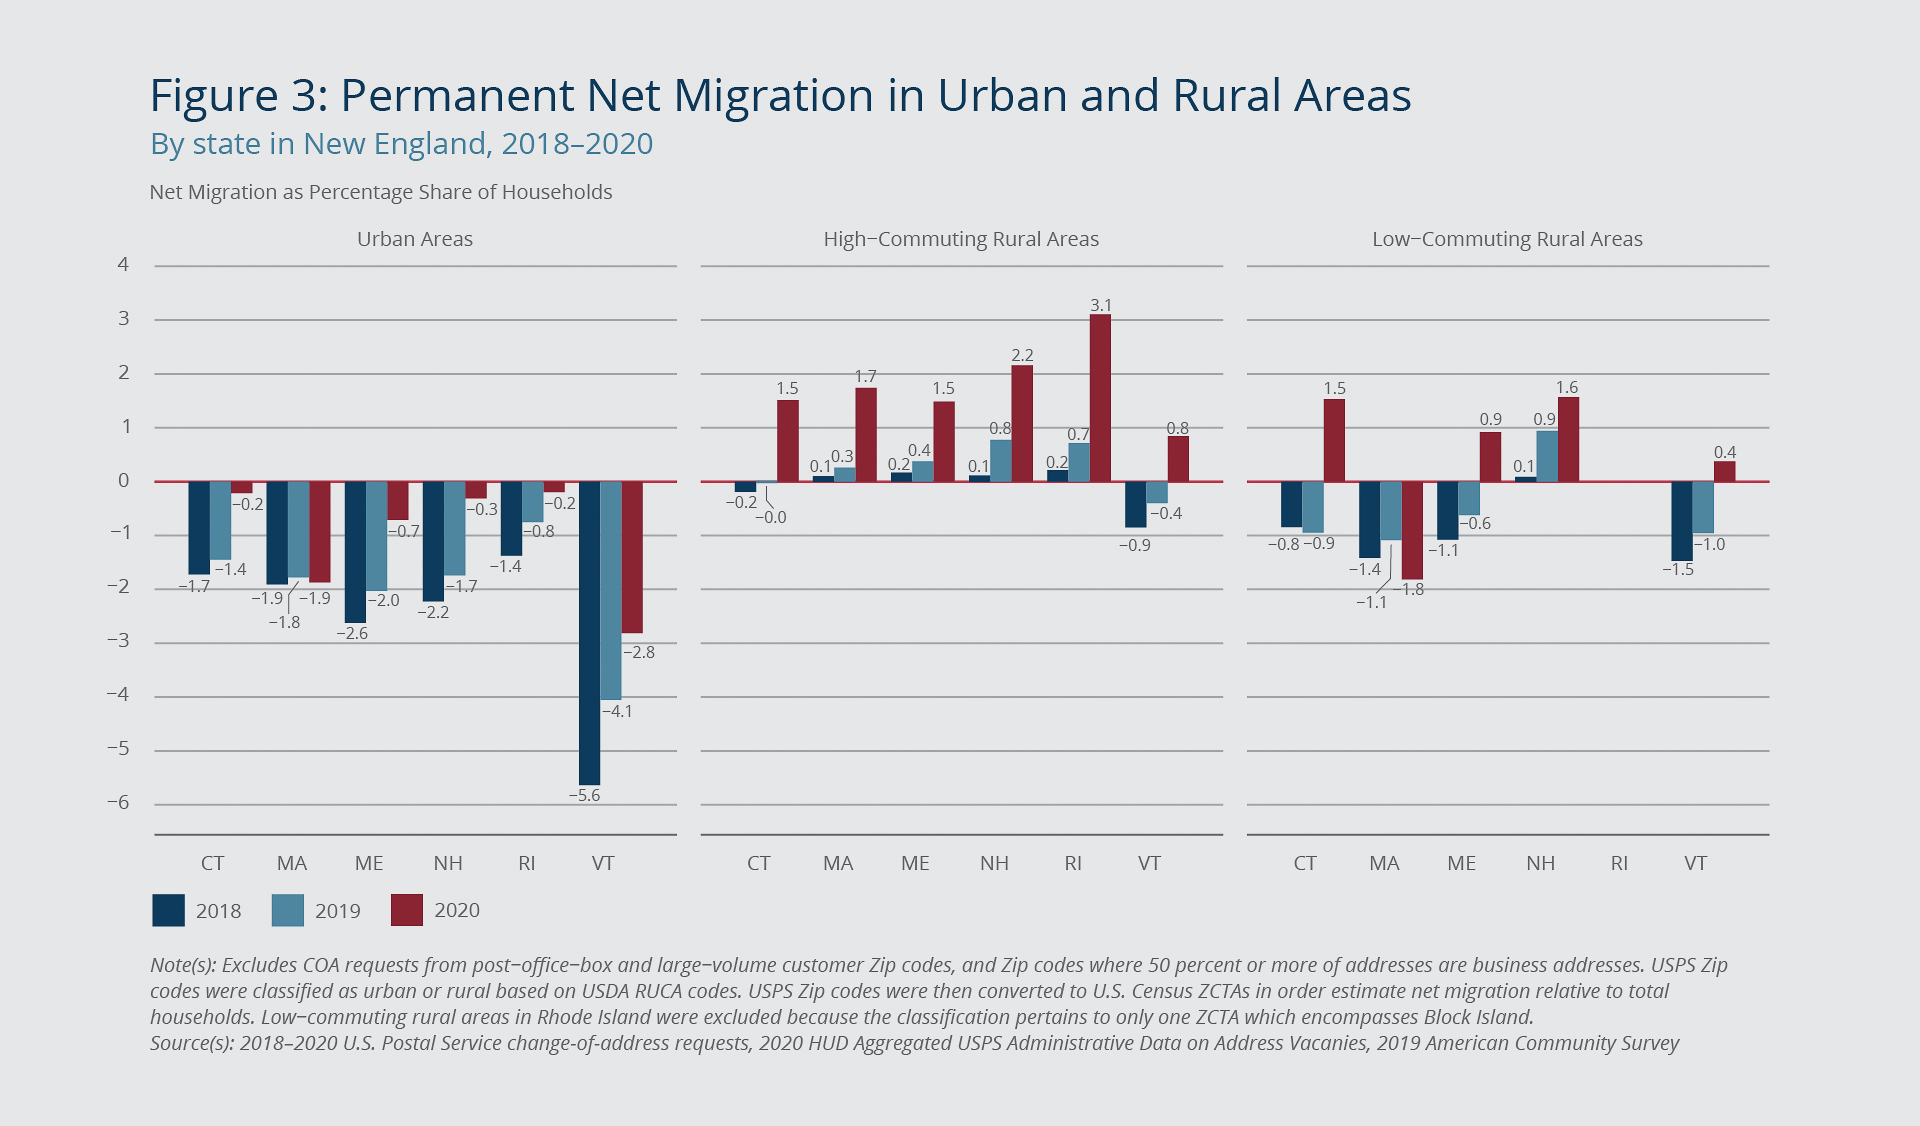
Figure 3 shows permanent net migration rates for both urban and rural areas from 2018 through 2020 as shares of the number of households in those areas in the preceding year. ZCTAs are classified as urban or rural based on U.S. Department of Agriculture (USDA) rural-urban commuting area (RUCA) codes.17 The figure also distinguishes between high-commuting rural areas, where more than 30 percent of workers commute to an urban area for work, and low-commuting areas, where less than 30 percent commute.
Federal Reserve Bank of Boston
In 2020, permanent net migration generally resulted in a move out of urban areas and into rural communities. Urban areas across every New England state lost households, ranging from a 0.2 percent decrease in the number of households in Connecticut to a 2.8 percent decrease in Vermont. Rural communities generally added households. For New England overall, high-commuting rural communities, which are more akin to suburbs than to the countryside, saw a 1.7 percent increase in the number of households. The increases ranged from 0.8 percent to 3.1 percent across New England states. Massachusetts was the only state where rural areas lost households in 2020, but the losses were confined to low-commuting rural areas.18
Again, to the extent that the pandemic shifted migration patterns in New England, it did so by accentuating trends that were already in place. From 2018 to 2019, net migration rates across most urban and rural areas increased, mirroring the state-level trend discussed earlier. For high-commuting rural areas, the permanent net migration rates increased 1.4 percentage points from 2019 to 2020, more than four times the 0.3 percentage point increase from 2018 to 2019. For low-commuting rural areas, the increase was almost twice as large.19 Urban area net migration rates also continued to rise from 2019 to 2020; in some states, the percentage point increase was more than double that of the preceding year.20 Massachusetts was the only state where permanent out-migration increased from 2019 to 2020, but the increase was limited to urban and low-commuting rural areas.
Other characteristics of communities may have inflated out-migration rates during the pandemic. University and college closures and the move to online learning caused many students to move back home for the duration of the spring and fall semesters in 2020. Therefore, ZCTAs with large student-population shares would be expected to have higher rates of out-migration in 2020. This would be particularly evident in Boston given the large number of universities and colleges in and around the city.
Federal Reserve Bank of Boston
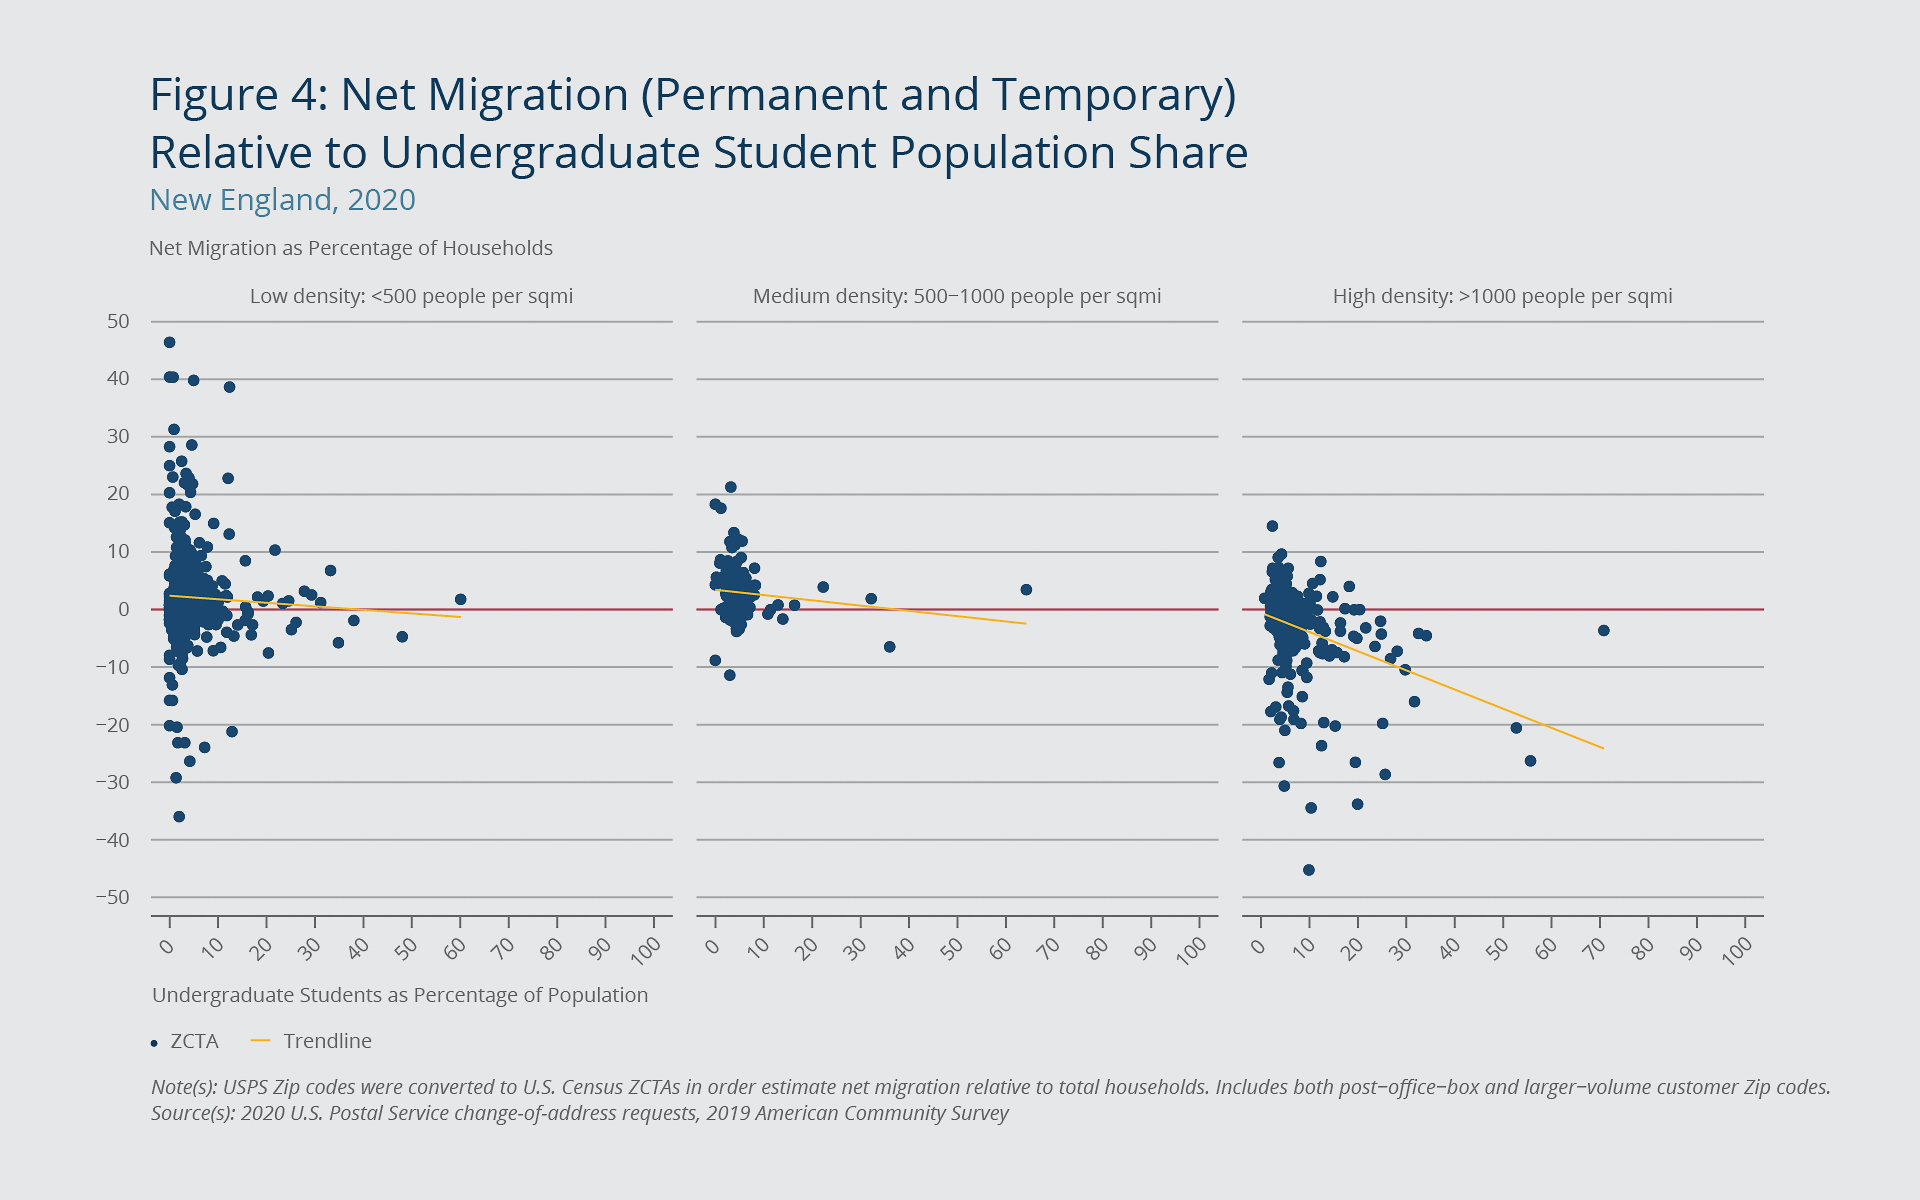
Figure 4 shows net migration as a share of households in a ZCTA relative to the share of the ZCTA population enrolled as undergrads. ZCTAs are grouped into low-density (fewer than 500 people per square mile), medium-density (500 to 1,000 people per square mile), and high-density areas (more than 1,000 people per square mile). Net migration in Figure 4 includes both permanent- and temporary-COA requests to account for the fact that if students file a COA request they may be equally as likely to file a temporary request as a permanent request.21
The effect, if any, that student-led migration had on net migration in 2020 is difficult to discern. Having a larger student population in 2020 was associated with greater out-migration for medium- and high-density ZCTAs. But for low-density ZCTAs, there was little or no correlation. While the relationship is strongest in high-density ZCTAs, this may be because these areas are more likely to be urban. Among ZCTAs with more than 10 percent of their population enrolled as undergrads, those that are urban ZCTAs lost an average of 6 percent of households to net migration in 2020, while those that are non-urban gained an average of about 1 percent.22 Even when all Boston ZCTAs are excluded, urban ZCTAs with a student-population share greater than 10 percent lost an average of 3 percent of households.
An area’s density likely had a greater effect than the size of its student population on net migration. In 2020, ZCTAs with more than 1,000 residents per square mile lost an average of 413 households, or 3 percent, while those with 1,000 or fewer residents per square mile gained an average of 85 households, or 2 percent.23 Even urban ZCTAs with 1,000 or fewer residents per square mile gained households, on average, compared with more densely populated urban ZCTAs.24 It may be that for individual ZCTAs, college students accounted for the overwhelming number of COA out-requests, but overall, the size of the student population was not a common factor among places that had positive or negative net migration in 2020.
Households may have been attracted to less densely populated areas because of the extra space they afford, especially given the need to work from home during the pandemic. Also, many rural parts of New England have high rates of second-home ownership, and households may have been pre-disposed to move to these areas if they already owned a home there, or if there was a large market for short-term rentals. As Table 5 shows, areas with a larger share of seasonal housing stock gained more households during 2020, particularly through temporary net migration.
Table 4: Net Migration (as Share of Total Households) Relative to Seasonal Housing Stock
By request type in New England, 2020
| Share of Housing Stock That is Seasonally Vacant | ||||
| Request Type | 0-25% | 25-50% | 50-75% | 75-100% |
| Permanent | -0.97 | 1.93 | 1.32 | 0.22 |
| Temporary | -0.17 | 1.75 | 4.85 | 8.94 |
| Note(s): Excludes COA requests from post-office-box and large-volume customer Zip codes, and Zip codes where 50 percent or more of addresses are business addresses. USPS Zip codes were converted to U.S. Census ZCTAs in order estimate net migration relative to total households. Includes both post-office-box and larger-volume customer Zip codes. Net permanent-COA and net temporary-COA estimates exclude Zip codes where in- or out-requests were suppressed (10 or fewer requests made). For this reason, net permanent- and temporary-COA requests will not sum to all net requests. Source(s): 2020 U.S. Postal Service change-of-address requests, 2020 HUD Aggregated USPS Administrative Data on Address Vacancies, 2019 American Community Survey |
||||
In areas where less than 25 percent of the total housing stock is seasonally vacant, the number of households decreased 0.43 percent through permanent net migration and 0.02 percent through temporary net migration. Areas with higher shares of seasonal housing had higher net migration. Permanent net migration was greatest in communities with housing stock that is 25 to 50 percent seasonal, whereas temporary net migration continued to increase with the share of the housing stock that is for seasonal use. In ZCTAs where virtually all of the housing is seasonal, temporary net migration resulted in an increase in the number of households in 2020 of almost 9 percent.
Temporary-COA requests are highly seasonal, suggesting that when households move temporarily, they usually do so for longer-term vacations. Thus, it is not surprising that areas with large seasonal housing shares would have attracted these types of moves, but most of these households are likely to move back to their original residence at some point. While some households made permanent-COA requests when moving to areas with large seasonal housing shares, they were much less common than temporary-COA requests. Instead, permanent net migration in 2020 resulted in a shift away from dense urban areas and to less dense rural communities, but ones with strong economic ties to urban places as indicated by high commuting rates. While this trend is not new for New England, it was heightened in 2020 and potentially means that larger suburbs will be a lingering effect of the pandemic.
Conclusion
The COVID-19 pandemic resulted in a notable increase in domestic household migration in New England. Almost every state in the region either saw smaller negative net migration in 2020 or larger positive net migration for the first time in at least the past three years, as measured by United States Postal Service (USPS) change-of-address (COA) requests. Rural New England areas experienced greater gains than urban areas overall. Rural areas with stronger economic ties to urban places, as measured by commuting patterns, gained the most new households through net migration. Every part of New England saw either declining out-migration in 2020 or increasing in-migration, except for the urban communities in and around Boston, a trend mirrored in large urban areas across the country.25
The addition of these new residents could result in new economic activity in many communities by expanding the local labor force and increasing spending in the local economy. But overall gains in the number of households from net migration were small in New England. In counties with permanent positive net migration in 2020, the number of households increased by less than 1 percent on average. Many of the migration trends that were evident from 2019 to 2020 were also apparent from 2018 to 2019, and perhaps earlier. It is not clear whether the COVID-19 pandemic dramatically altered migration trends or just accelerated trends that were already in place. Some of the changes that did occur, such as greater temporary net migration, are less likely to persist. Even the decline in permanent-COA out-requests that increased net in-migration to some areas could reverse if more households move out of the region once the pandemic recedes.
The arrival of new residents during the pandemic can have drawbacks. A growing population can create the need for more classrooms to accommodate increasing public school enrollment, for new housing construction, and for infrastructure investment. State leaders should be cognizant of where permanent net migration increased the most in their state, as these are likely the places that will see longer-lasting population growth. New residents need places to live. The added demand for housing is one factor behind the 14 percent increase in the purchase price for new homes from 2020 to 2021 in New England, more than twice the increase of 6 percent from 2019 to 2020.26 The rental market has also been impacted by the shifting demand for housing. The rental vacancy rate decreased in every New England state except Connecticut and Massachusetts from 2019 to 2020.27 In 2020, the rental vacancy rates in northern New England and Rhode Island were the lowest they had been since at least 2007. Responding to the housing needs of new residents takes time, and without sufficient new construction, residents are likely to be priced out of communities that were once affordable to them. A decrease in the number of permanent-COA out-requests was an important factor in the increase in net migration in the region in 2020. However, a decline in housing affordability could push more people to leave the region in the future, thus reversing this trend.
Appendix
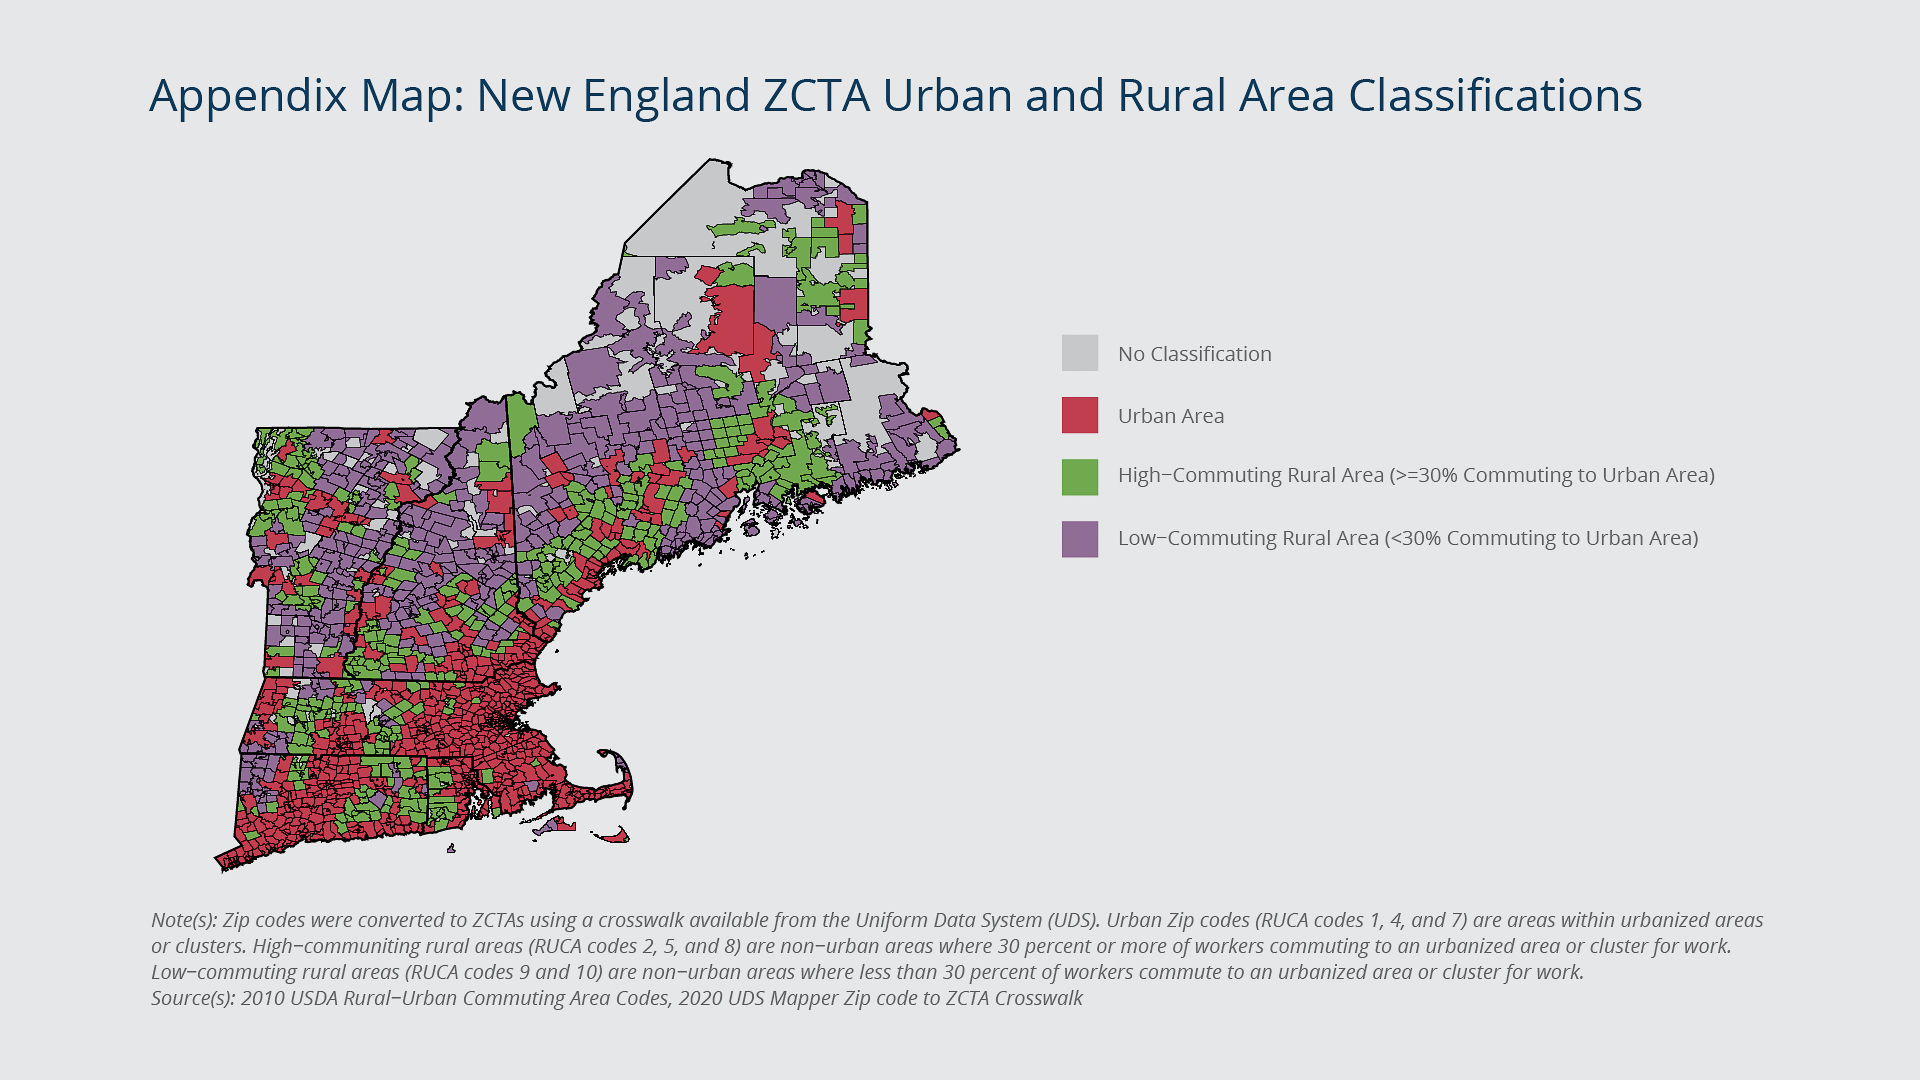
Under the USDA Rural and Urban Commuting Area (RUCA) classification codes, urban areas are the equivalent of U.S. Census urbanized areas and urban clusters (RUCA codes 1, 4, and 7). Rural ZCTAs are divided into high-commuting rural areas, where 30 percent or more of workers commute to an urbanized area or cluster for work (RUCA codes 2, 5, and 8), and all other rural areas where less than 30 percent of workers commute to urban areas (RUCA codes 3, 6, 9, and 10). Zip codes were converted to ZCTAs using a crosswalk from the Uniform Data System (UDS), part of the Health Resources and Services Administration. The crosswalk was retrieved from https://udsmapper.org/zip-code-to-zcta-crosswalk/.
Federal Reserve Bank of Boston
Data Sources
The change-of-address-request data used in this report are a combination of publicly available sources and administrative sources obtained through a Freedom of Information Act request to the United States Postal Service (USPS). Monthly data at the Zip code level were obtained for the period April 2020 through February 2021.
Important additional sources of data used in this report include the U.S. Department of Housing and Urban Development’s Aggregated USPS Administrative Data on Address Vacancies, the 2019 American Community Survey 1-year estimates, and the 2010 U.S. Department of Agriculture Rural-Urban Commuting Area Codes for Zip Codes.
Endnotes
- Whitaker, Stephen D. 2021. “Did the COVID-19 Pandemic Cause an Urban Exodus?” District Data Brief. Federal Reserve Bank of Cleveland.
- Zip codes assigned to post office boxes and large distributors are excluded from this analysis, because they likely pertain to businesses as opposed to residential addresses. Zip codes are also excluded if more than 50 percent of the addresses within them are business addresses, based on data from the U.S. Department of Housing and Urban Development’s (HUD) Aggregated USPS Administrative Data on Address Vacancies.
- From 2017 through 2019, domestic net migration, based on USPS COA requests, followed the same directional pattern (declining and rising in tandem) year to year as domestic net migration estimates from the U.S. Census Bureau’s State-to-State Migration Tables. Two exceptions were in 2018 for the two smallest New England states, Maine and Vermont, where the USPS measure diverged from the U.S. Census measure. One explanation may involve differences in the types of households moving into and out of these states. For example, if families are more likely to move into a state and individuals are more likely to move out, then COA requests will overestimate out-migration due to undercounting the number of people in families. Among New England states, COA requests generally undercount in-migration and so more likely result in estimates of negative net migration overall.
- Counting an individual COA request is straightforward, with one request equaling one person moving. However, counting family requests is a bit more difficult. Scaling family COA requests by the average single-family household size in each state generally leads to an overestimate of out-migration in New England states, particularly in Massachusetts, when compared with estimates from the U.S. Census Bureau. One reason that COA requests undercount in-migration in New England could be because the families moving into the region are larger than those moving out, or they are less likely to file COA requests altogether.
- Based on data from U.S. Census State Population Totals and Components of Change: 2010–2019.
- Temporary-COA requests are those lasting from 15 days to one year, after which mail is sent to the original address. Permanent-COA requests last an indefinite period of time.
- The regional- and state-level trends in Table 1 remain after the analysis controls for the number of households in a given year, and so the decline is not due to a change in the total number of households in New England or each state.
- COA request data are available only for the months of April through December for 2017. Nationally, there were about 68.1 million COA requests made in the United States in 2020, which is 3.1 percent more than in 2019 but less than 1 percent more than in 2018. These totals exclude COA requests made in Puerto Rico and other U.S. territories.
- Frost, Riordan. 2020. “Are Americans Stuck in Place? Declining Residential Mobility in the US.” Joint Center for Housing Studies. Harvard University.
- Permanent-COA in-requests accounted for an additional 12 percent of the increase in COA in-requests. Due to data suppression, the remaining 10 percent could not be identified as either temporary or permanent requests. The number of COA requests were suppressed if 10 or fewer occurred in a Zip code in a given month. This report excludes from net-migration estimates any Zip code with suppressed COA in- or out-requests. From 10 to 11 percent of Zip codes had suppressed values for either permanent- or temporary-COA in- or out-requests.
- Some of the data used in this report were obtained as part of an FOIA request; the rest are public and available online. While the USPS does track the origin and destination of movers, this information was not included as part of the data request.
- These three counties are Fairfield County in Connecticut, Dukes County in Massachusetts, and Carroll County in New Hampshire. Among these three counties, permanent-COA out-requests increased by an average of 2,675 (3.8 percent) from 2019 to 2020, while permanent-COA in-requests increased by an average of 8,871 (14.4 percent). Averages were weighted based on the number of households in the county in 2019.
- These six counties are Kennebec County in Maine; Bristol, Franklin, and Plymouth Counties in Massachusetts; Kent County in Rhode Island; and Grand Isle County in Vermont. Among these six counties, permanent-COA out-requests declined by an average of 2,017 (6.2 percent) from 2019 to 2020, while for New England counties overall, permanent in-requests declined by an average of 1,236 (3.1 percent). Averages were weighted based on the number of households in the county in 2019.
- Norfolk County’s (Massachusetts) largest city is Quincy. Middlesex County’s (Massachusetts) largest city is Lowell. Androscoggin County’s (Maine) largest city is Lewiston. Essex County (Vermont) is the smallest of these four counties, with a population of about 6,200.
- In Suffolk County, Massachusetts, permanent household net migration as a share of all households decreased 2.7 percentage points from 2019 to 2020.
- USPS Zip codes were converted to U.S. Census ZCTAs to estimate the number of households, college student population, and seasonal housing stock at the local level. Zip codes were converted to ZCTAs using a crosswalk available from the Uniform Data System (UDS), part of the Health Resources and Services Administration. The crosswalk was retrieved from https://udsmapper.org/zip-code-to-zcta-crosswalk/.
- While RUCA codes are primarily defined at the census-tract level, the USDA does provide RUCA classifications for Zip codes. When Zip codes were converted to ZCTAs, the corresponding RUCA codes were used. If more than one RUCA code could be assigned, the one corresponding to the Zip code with the largest share of population in the ZCTA was used. A map showing how New England ZCTAs are classified is included in the appendix to this report.
- Rhode Island’s low-commuting areas also lost households due to permanent out-migration in 2020; however, since the state has only one ZCTA that is classified as low-commuting rural, it was excluded from Figure 3.
- In New England, permanent net migration as a share of households increased 1.19 percentage points from 2019 to 2020 and 0.53 percentage point from 2018 to 2019.
- In New England’s low-commuting rural areas, urban area permanent net migration as a share of households increased 0.53 percentage point from 2019 to 2020, compared with 0.3 percentage point from 2018 to 2019.
- Figure 4 also includes Zip codes assigned to post office boxes and large-volume customers in order to capture requests made by universities and colleges.
- Urban ZCTAs with less than 10 percent of their population enrolled as undergraduates lost 0.7 percent of their total number of households, while rural ZCTAs with less than 10 percent gained 2.6 percent.
- Averages were weighted by the number of households in a ZCTA in 2019.
- Urban ZCTAs with fewer than 1,000 people per square mile gained an average of 99 households in 2020, or about 2 percent. Averages were weighted by the number of households in a ZCTA in 2019.
- Frey, William H. 2021. “Pandemic Population Change across Metro America: Accelerated Out-migration, Less In-migration, Fewer Births, and More Deaths.” Metropolitan Policy Program. The Brookings Institution.
- Based on the Federal Housing Finance Agency’s (FHFA) Purchase-Only House Price Index. Estimates compare quarter one (January through March) of 2019 with quarter one of 2021.
- Based on the U.S. Census Bureau’s Housing Vacancy Survey for 2007 through 2020.

 About the Authors
Nicholas Chiumenti
Resources
Site Topics
Keywords
- Coronavirus ,
- COVID-19 ,
- New England ,
- NEPPC ,
- household migration