Recent Trends in Infrastructure Investment and Capacity in New England 


| Key Facts | |
 |
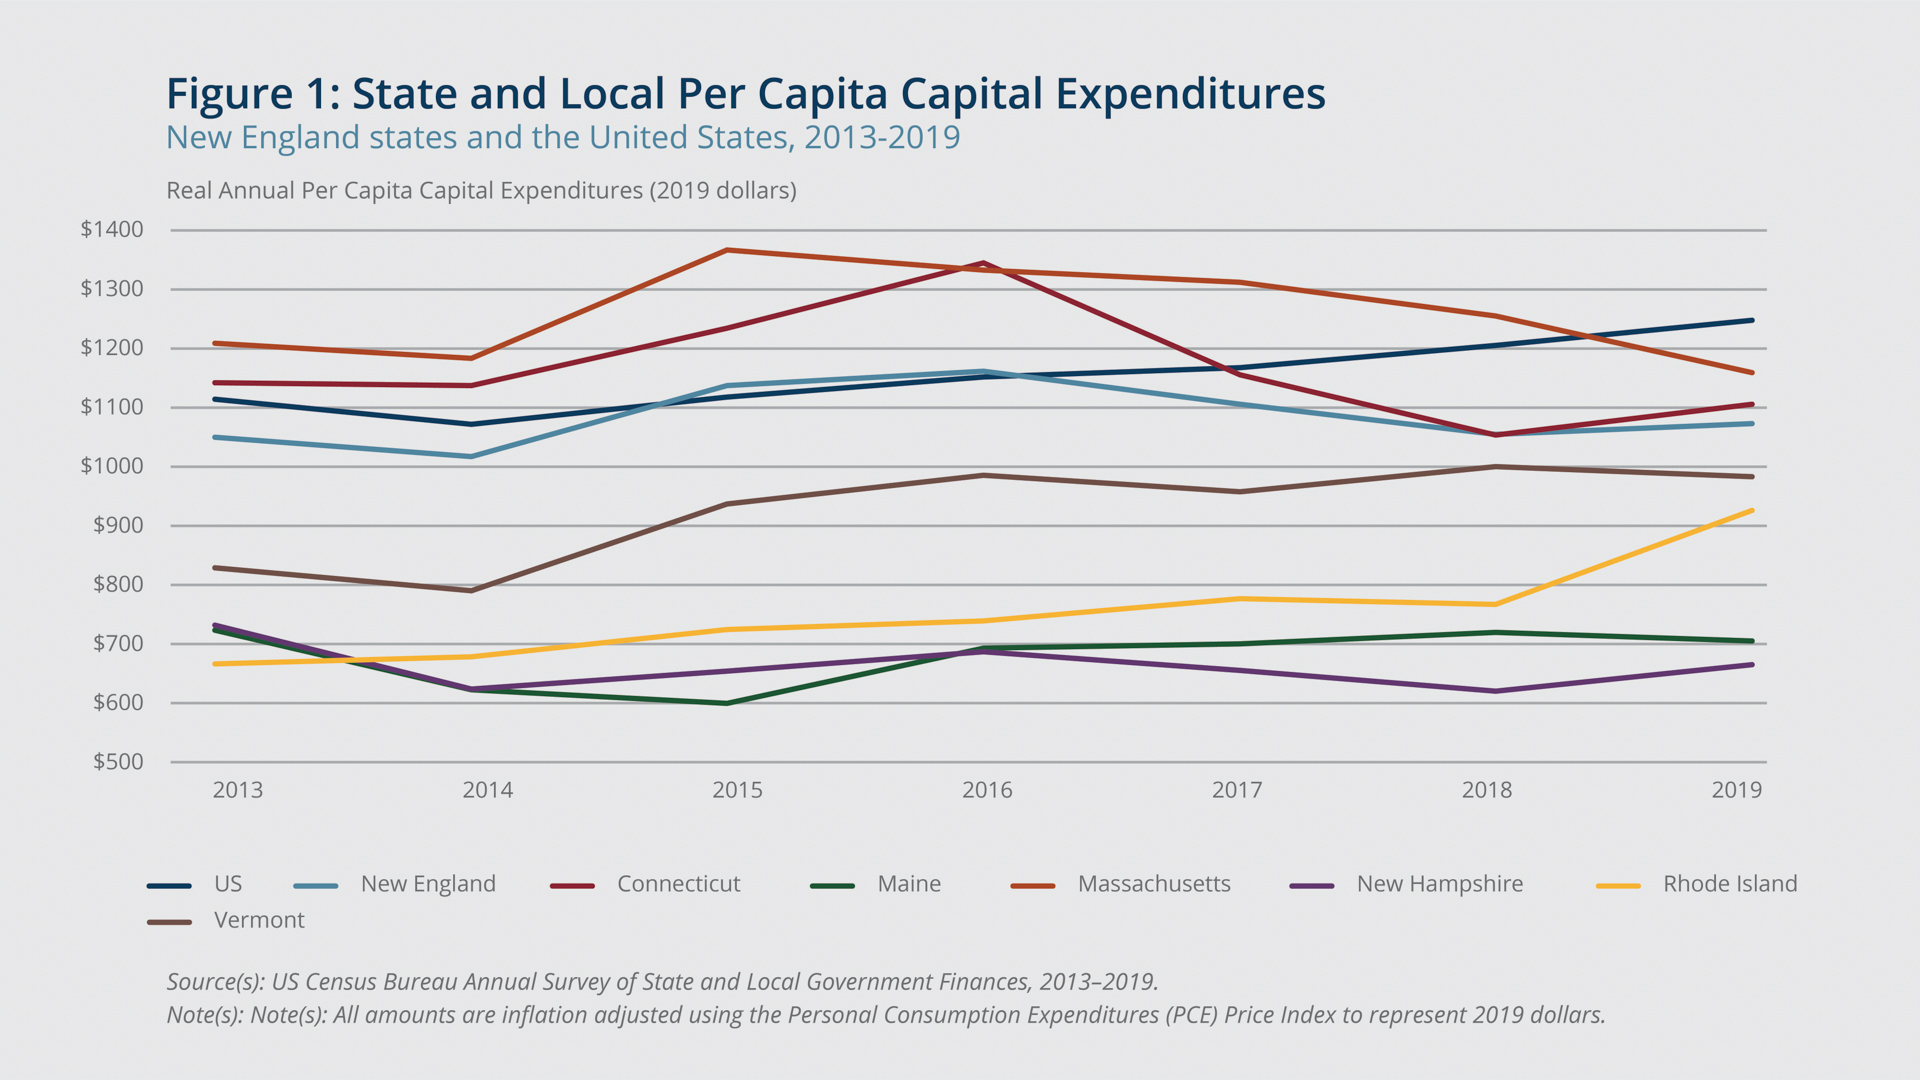
On average, state and local capital spending in New England trailed the national average. |
 |
Each New England state is receiving a per capita amount of IIJA funding that is greater than the national average. |
 |
IIJA allocations for highways far exceed the annual state and local spending in each New England state, but other categories, including education, remain heavily reliant on state and local funding. |
 |
|
Households and businesses throughout New England rely on roads, bridges, dams, sewers, drinking water systems, and other elements of public infrastructure daily. However, the region’s states and municipalities have long been acknowledged as spending less than much of the rest of country on these public capital assets. The Infrastructure Investment and Jobs Act of 2021 (IIJA) represents a massive and historic opportunity that will fund billions of dollars’ worth of repairs and improvements to public infrastructure across the region. The $1.2 trillion package contains $550 billion in new federal spending on public transit, broadband access, roads and bridges, water treatment, and the power grid. Notwithstanding these appropriations, state and local capital investments remain an important component of maintaining the public capital stock. This brief describes how elements of the IIJA will affect infrastructure in the region, discusses how new federal spending will fill the existing gap between infrastructure needs and spending, and reviews current state and local capital expenditures in the New England states.
Sign up for new research and data on the New England economy.
Infrastructure Act Appropriations
The Infrastructure Investment and Jobs Act of 2021 (IIJA) was signed into law in November 2021 after months of negotiations. The act, commonly referred to as the Bipartisan Infrastructure Law, differs from the more comprehensive, $2.3 trillion Build Back Better Act, which was passed by the U.S. House of Representatives but stalled in the Senate. The Build Back Better Act featured a broader definition of infrastructure that included human capital development, whereas the IIJA’s definition is more traditional. Many components of the $1.2 trillion plan are continuations of funding for existing projects; however, it also includes $550 billion in new allocations. While some of the appropriations are specifically for federal projects, including $66 billion for Amtrak maintenance and expansion, much of the new funding has been allocated to state and local governments over the next five years.
The IIJA features the largest investments in roads and bridges in decades. The allocations for drinking water and wastewater systems, public transportation, airports, broadband, and climate resiliency represent large per capita investments in each state. Funds for expanding electric vehicle charging stations and cybersecurity infrastructure have also been allocated to each state.
Each New England state is receiving state and local formula-based and minimum allocations from the IIJA that are greater than the national average on a per capita basis; Vermont is receiving one of the country’s highest per capita allocations (Table 1). In addition to these defined allocations, about $80 billion in funding is competitive, meaning that state and local governments will be eligible to apply and compete for additional IIJA funding for roads and bridges and substantially more funding for cybersecurity, energy, and public transit safety.
Table 1: Appropriations from the Infrastructure Investment and Jobs Act of 2021
New England states, selected categories
| Roads | Bridges | Drinking Water and Wastewater Systems | Combined Per Capita Appropriations | |
| US | $271.7 B | $26 B | $40.6 B | $1,287 |
| NE | $13 B | $2.6 B | $3.1 B | $1,626 |
| CT | $3.5 B | $561 M | $445 M | $1,675 |
| ME | $1.3 B | $225 M | $390 M | $1,736 |
| MA | $4.2 B | $1.1 B | $1.1 B | $1,327 |
| NH | $1.1 B | $225 M | $418 M | $1,487 |
| RI | $1.5 B | $242 M | $378 M | $2,345 |
| VT | $1.4 B | $225 M | $355 M | $3,458 |
| Source(s): “White House Releases Updated State Fact Sheets Highlighting the Impact of the Infrastructure Investment and Jobs Act Nationwide,” White House Statements and Releases, August 4, 2021. Note(s): Selected category values represent formula-based funds over five years. Values may be greater depending on the outcomes of additional competitive funding opportunities that are part of the IIJA. |
||||
Each U.S. state is receiving a minimum of $100 million to increase access to broadband. This allocation and other imposed minimum allocations are not tied to a state’s population, so they contribute to the above-average allocations in New England, particularly in Vermont, which has one of the smallest populations in the country. Many of the formulas require a state to contribute a portion of the investment to receive the full allocation.1 In addition to the nationally competitive grants, funding for a variety of programs has been allocated specifically for different geographic areas. One example for New England is the $15 million in competitive grants that has been set aside for the rehabilitation of the southeastern New England watershed. The U.S. Environmental Protection Agency is administering the application process for that funding.2
Economic Impact of Infrastructure Investment
It is generally understood that quality public infrastructure supports long-run economic growth by improving productivity, increasing the quality of life of residents, and at times spurring private investment in an area. The benefits of a strong infrastructure can include more efficient transportation and travel systems and safer water treatment facilities, and it can prevent public safety hazards that could result from deteriorating infrastructure.3 In addition, a region may see spillover effects whereby one state’s or municipality’s capital spending on, for example, roads or education raises the value of neighboring states’ or municipalities’ capital investment.4 This is particularly relevant in New England, where states are relatively small and engage in substantial interstate economic activity.
While the benefits of a high-quality infrastructure seem obvious, determining whether the level of existing infrastructure capacity and ongoing investments are inadequate or excessive is more complicated, and economic research yields mixed results.5 The economic approach to evaluating infrastructure investment involves computing the benefits and costs of projects and then the rates of return. The locations, types of infrastructure projects, and quality and level of existing public and private capital are important factors to consider when evaluating these costs and benefits. Evaluation of infrastructure investments also commonly takes into account competing policy interests, including equal treatment and “fair” allocations for residents across locations, in addition to the economic costs and benefits of certain projects.
Because state and local governments play large roles in developing and maintaining public capital stock, geographical differences, competing policy priorities, and the ability to raise revenues can result in the quality varying widely by location. Measures of existing capital stock are described in the box below. While marginal cost-benefit estimates are not readily available for all states and types of infrastructure, the quality of the existing capital stock documented by the American Society of Civil Engineers (ASCE) analysis is suggestive of needed upgrades.
Table 2 lists the ASCE-estimated status of some categories of public capital in the New England states. Roads, bridges, and water systems are among the categories receiving the largest appropriations from the IIJA. These estimates are the best available measures of existing capital stock across a variety of categories at the state level.7
Quality Measures of Existing Infrastructure
For highways and education—the two largest categories of state and local capital spending—measures of the quality of state and local capital stock exist but are limited. The measures used most by researchers are those for transportation facilities, especially roads and bridges. The quality of existing roads is tracked by the U.S. Department of Transportation, which shows the percentage of travel on roads classified by roughness categories.a
Interstate quality measures of public school facilities are noticeably lacking, even though this category represents the second-largest share of state and local government capital expenditure nationally (about 25 percent). The U.S. Government Accountability Office (GAO) last undertook a nationally comprehensive analysis of public school facilities in 1995,b but a more limited GAO report published in June 2020 found that about half of public school districts needed to update or replace multiple building systems or features in their schools. c The U.S. Census Bureau reports annually, by state, on several categories of capital expenditure by public schools but does not provide comparable measures of the existing capital stock.
The report card analysis by the American Society of Civil Engineers (ASCE) includes both actual capital outlays for construction of schools and estimates of school infrastructure funding needs. Citing a 2015 Congressional Research Service report, the ASCE concludes that "national data on the condition of school infrastructure and the investment needs are extremely limited and outdated, and comprehensive findings remain elusive. There is no consistent federal data collection process to aggregate information on the condition of schools. Furthermore, the data that are collected are based on a wide variety of assumptions and definitions regarding both conditions and needs."d The ratio of actual past spending to future "needs" provides a rough measure of how well a state is addressing the need for investment in school infrastructure. Given the lack of comparable government data, the ASCE report card serves as the most useful resource in making state-by-state comparisons despite any potential flaws.
- See U.S. Department of Transportation, Federal Highway Administration, Office of Highway Policy Information, https://www.fhwa.dot.gov/policyinformation/statistics.cfm.
- See U.S. Government Accountability Office, "School Facilities: Condition of America's Schools," February 1, 1995, https://www.gao.gov/products/hehs-95-61.
- See U.S. Government Accountability Office, "School Districts Frequently Identified Multiple Building Systems Needing Updates or Replacement," June 2020, https://www.gao.gov/assets/gao-20-494.pdf.
- American Society of Civil Engineers, "2021 Report Card for America's Infrastructure," American Society of Civil Engineers, https://infrastructurereportcard.org/cat-item/schools/.
Table 2: Quality of Existing Infrastructure and Estimated Future Needs
New England states and the United States
| Share of Roads in Poor Condition | Share of Bridges Deficient | Drinking Water Systems Needs | Wastewater Systems Needs | Gap in School Capital Expenditures | Overall ASCE Grade | |
| US | 20% | 7.5% | $434 B | $434 B | $46 B | C- |
| CT | 34% | 6.3% | $4.0 B | $4.6 B | $689 M | C- |
| ME | 23% | 12.8% | $1.3 B | $970 M | $304 M | C- |
| MA | 25% | 9.0% | $12.2 B | $8.4 B | $1.39 B | C- |
| NH | 20% | 8.5% | $1 B | $2.0 B | $324 M | C- |
| RI | 50% | 22.3% | $833 M | $1.9 B | $241 M | C- |
| VT | 17% | 2.4% | $643 M | $154 M | $198 M | C |
| Source(s): “2021 Report Card for American Infrastructure,” the American Society of Civil Engineers. Note(s): See box on page 4 for details on quality measures of existing infrastructure. The wastewater and drinking water systems needs are estimated amounts of investment required by 2029. |
||||||
The overall rating for each New England state is nearly the same as the national average, but the categories requiring greater investment vary by state. For example, fewer than 3 percent of the bridges in Vermont are deficient, which is far below the rates in the rest of the region. The estimated future need for wastewater systems investment in Vermont also pales in comparison with that of their neighboring states. The need for drinking water systems investment and the estimated gap in school capital expenditures in Vermont, albeit the smallest in the region, are much closer in magnitude to those in New Hampshire, Maine, and Rhode Island.
The Role of State and Local Capital Spending in New England
Earlier research by the Federal Reserve Bank of Boston explored trends in state and local capital spending behavior across the New England states.8 The research found that from 2000 through 2012, the combined state and local per capita capital expenditure for each of the New England states was well below the national average. The relative capital expenditure was especially low in Maine, New Hampshire, Rhode Island, and Vermont. The available evidence did not appear to support the view that additional capital spending by state and local governments in New England during the 2000–2012 period would have been unnecessary because the quantity or quality of existing public capital was unusually high.
The most recently available data (through 2019) indicate a continuation or resumption of this trend, with state and local per capita capital expenditures in Connecticut and Massachusetts falling below the national average in recent years after exceeding it for a few years, and expenditures in the other four New England states remaining below the average throughout the entire period (Figure 1). In 2019, state and local per capita capital expenditures were below the national average in each New England state.

Meghan Smith/Federal Reserve Bank of Boston
The Allocation of State and Local Expenditures in Recent Years
In addition to showing that state and local capital spending was below the national average in most of the New England states throughout the 2013–2019 period, U.S. Census Bureau data reveal substantial differences among the states in the composition of capital investment. Table 3 shows the mix of state and local government capital spending by state over that same time span. There are striking differences in the mix of capital spending among the New England states and between the region as whole—as well as each state—and the rest of the country.
Among the outliers, the shares of capital spending on higher education and elementary and secondary education in Rhode Island were substantially lower than those of every other New England state. Large variation is also evident in capital spending on highways, ranging from a share of 46 percent in Vermont to 21 percent in Massachusetts. Capital spending on hospitals represented a greater share of funding nationally than in any New England state. The same is true for capital spending on public utilities, except in Massachusetts, where the share was slightly higher than the national average.
Table 3: Average Annual State and Local Capital Expenditures and Shares of Capital Spending
New England states and the United States by category, 2013–2019
| US | NE | CT | ME | MA | NH | RI | VT | |
| Higher Education | $34.0 B | $1.5 B | $458 M | $61 M | $843 M | $86 M | $13 M | $61 M |
| 9.1% | 9.6% | 11.0% | 6.7% | 9.8% | 9.7% | 1.6% | 10.5% | |
| Elementary & Secondary Education | $62.2 B | $2.2 B | $554 M | $124 M | $1.3 B | $140 M | $75 M | $62 M |
| 16.7% | 13.9% | 13.3% | 13.7% | 14.6% | 15.8% | 9.5% | 10.7% | |
| Hospitals | $9.7 B | $97 M | $23 M | $1 M | $67 M | $2 M | $3 M | $0.1 M |
| 2.6% | 0.6% | 0.6% | 0.1% | 0.8% | 0.2% | 0.4% | 0.0% | |
| Highways | $104.5 B | $4.3 B | $1.2 B | $363 M | $1.8 B | $315 M | $296 M | $265 M |
| 28.1% | 26.7% | 28.9% | 40.2% | 21.1% | 35.5% | 37.3% | 45.9% | |
| Correction | $2.5 B | $68 M | $6 M | $5 M | $40 M | $10 M | $6 M | $1 M |
| 0.7% | 0.4% | 0.1% | 0.5% | 0.5% | 1.1% | 0.7% | 0.2% | |
| Natural Resources | $5.5 B | $146 M | $46 M | $7 M | $64 M | $8 M | $15 M | $5 M |
| 1.5% | 0.9% | 1.1% | 0.8% | 0.7% | 0.9% | 1.9% | 0.9% | |
| Parks & Recreation | $9.7 B | $207 M | $48 M | $26 M | $113 M | $7 M | $5 M | $9 M |
| 2.6% | 1.3% | 1.2% | 2.9% | 1.3% | 0.8% | 0.6% | 1.5% | |
| Sewerage | $20.2 B | $975 M | $305 M | $55 M | $480 M | $76 M | $37 M | $22 M |
| 5.4% | 6.1% | 7.3% | 6.0% | 5.6% | 8.5% | 4.7% | 3.9% | |
| Solid-Waste Management | $2.1 B | $71 M | $19 M | $6 M | $18 M | $12 M | $14 M | $2 M |
| 0.6% | 0.4% | 0.5% | 0.7% | 0.2% | 1.4% | 1.8% | 0.4% | |
| Utility | $55.6 B | $2.2 B | $312 M | $55 M | $1.7 B | $31 M | $91 M | $41 M |
| 15.0% | 14.0% | 7.5% | 6.1% | 19.9% | 3.5% | 11.4% | 7.1% | |
| Other | $65.9 B | $4.1 B | $1.2 B | $200 M | $2.2 B | $200 M | $239 M | $109 M |
| 17.7% | 26.0% | 28.7% | 22.2% | 25.6% | 22.6% | 30.1% | 18.8% | |
| Source(s): U.S. Census Bureau Annual Survey of State and Local Government Finances, 2013–2019. Note(s): All amounts are inflation adjusted to 2019 dollars using the Personal Consumption Expenditures (PCE) Price Index. |
||||||||
Looking at Tables 2 and 3 together, it is clear that allocating a high share of capital spending to a specific category of infrastructure in recent years does not ensure high-quality conditions. The increased spending could be the result of states prioritizing projects in categories that are particularly deficient, and continued investments over time may raise the overall quality of the existing stock. For example, during the 2013–2019 period, Rhode Island invested more than 37 percent of its state and local capital expenditures in highways, which outstrips the New England average for that period by more than 10 percentage points, but the share of roads and share of bridges that were in poor condition in Rhode Island were more than double those rates in four other New England states.
The example of Rhode Island indicates that consistent investment may be needed in order to thoroughly improve the quality of infrastructure in an area. The national per capita appropriation for the IIJA’s base formulas is $1,287, which is about 103 percent of the 2019 national average per capita state and local infrastructure appropriation of $1,247, as shown in Figure 1. States are receiving, on average, the equivalent of an additional year of funding to be used in conjunction with their own funds to invest in public capital. This represents a substantial infusion of funds to all states and especially the New England states. As noted, as of 2019, each New England state had a lower-than-average level of state and local per capita capital spending, and each is receiving above-average levels of per capita IIJA funding. The amounts range from 115 percent of 2019 state and local capital spending in IIJA appropriations for Massachusetts to 352 percent for Vermont.9
The specificity of allocations for certain infrastructure categories will result in some categories of capital spending receiving even higher levels of stimulus funding relative to current levels. As shown in Table 3, capital spending on highways in New Hampshire collectively received $315 million in state and local funding in the seven years from 2013 through 2019, or an average of $45 million per year over that period. Appropriations for roads in New Hampshire are receiving at least $1.1 billion over the five-year span of the IIJA, or roughly 24 times the 2013–2019 average annual state and local expenditure on that category.
The IIJA represents a more substantial influx of funding for certain categories relative to average annual allocations, but to estimate the total impact the funding will have on an infrastructure category in a given state would require a more intensive study of proposed projects and local conditions. Narrowing the scope to just bridges, we can examine at a high level the effect this funding could have on the maintenance and improvement of the 18,233 bridges across New England. Among the bridges in the region, 1,399, or 7.7 percent, were in poor condition as of 2021, according to the U.S. Department of Transportation. Bridge improvement and maintenance projects across New England are receiving a base funding through the IIJA of nearly $2.6 billion over five years. In Vermont, where only 68 (2.4 percent) of the bridges are in poor condition, the $225 million IIJA allocation for bridges could substantially reduce the number of deficient structures. Rhode Island is receiving $242 million, which is about 8 percent more than Vermont, despite having twice the number of bridges (136) that are in poor condition. While the large infusion of funds should make a dent in the number of structurally deficient bridges in Rhode Island, the IILA allocation will likely have a larger effect in Vermont. Infrastructure categories across states will benefit to varying degrees from the IIJA, but the estimated needs and levels of funding suggest that the act will enable every state to make substantial improvements to a wide range of infrastructure.
Looking Ahead
New England as a region is confronted with unique challenges because it developed its capital stock earlier than other parts of the country that have experienced more recent population growth. The aging infrastructure in some parts of New England was built when the needs of the areas were different from what they are today. In Massachusetts, every year, oversized vehicles collide or nearly collide with the low bridges on either side of the Charles River. The bridges that cross the Cape Cod Canal are inadequate for the summer traffic, so residents and visitors lose what could otherwise be productive time waiting in that traffic. The share of roads and share of bridges in disrepair in Rhode Island shown in Table 2 speak to the status of parts of the infrastructure of the smallest state, but all six New England states have substantial numbers of roads and bridges in need of investment such as that provided by the IIJA.
Communities across the region are continuously working to ensure that the drinking water is safe and the systems are reliable and that wastewater is properly treated and disposed. The estimated spending-versus-needs gaps shown in Table 2 for such water-related issues are larger than the additional allocations shown in Table 1. State and local governments will need to continue to invest in these systems to close these estimated gaps, and they can apply for additional grants through the IIJA to assist in this effort.
The base level of IIJA funding for each New England state exceeds its average annual state and local capital spending, but some categories remain reliant on consistent, if not increased, levels of funding to fill the estimated gaps between maintenance needs and spending. Schools represent the second-largest category of state and local capital spending nationally and in New England. They are behind only highways, which, as noted, in states including New Hampshire are receiving far more than the annual state and local appropriations through the IIJA. Table 2 also shows the estimated gaps between capital spending and maintenance needs for schools. As the box above describes, comparable quality measures for the capital stock of schools have not been updated in decades, but a 2020 GAO report noted that more than half of school districts were operating buildings in need of major improvements. Formula-based funding for schools is not a major component of the IIJA, though the three pandemic-related economic stimulus bills passed in recent years included funding for schools. State and local governments will need to continue to invest in the capital stock of these institutions if they want to maintain modern standards.
In addition to improving the infrastructure, the IIJA funds invested in the region will affect the labor market because new workers will be needed to fill jobs associated with these capital improvement projects. The consensus among economists is that improvements to public infrastructure stimulates economic activity, either directly or by augmenting the productivity of private capital investment. By enhancing a region's amenities, an improved public infrastructure can also attract companies and residents, which further contributes to a region’s growth.10 As a region, New England faces unique infrastructure challenges. The relatively small land area and high level of interstate commerce make each state’s capital stock relevant to all the region’s states. Although the behaviors of the New England states vary, capital expenditures in each state impact the economy of the region. The spillover effects of infrastructure and other capital investments are strengthened when all neighboring states invest in capital. For these reasons, capital spending around New England is a regional concern.
Data Sources
The primary data source for this report is the U.S. Census Bureau Survey of State and Local Government Finances. The bureau defines state and local government capital expenditure as “direct expenditure for construction of buildings, roads, and other improvements undertaken either on a contractual basis by private contractors or through a government’s own staff … for purchases of equipment, land, and existing structures; and for payments on capital leases.” There are several advantages to the capital spending data collected and reported by the U.S. Census Bureau. First, the bureau applies a consistent definition of capital spending, even though individual states may label capital spending differently. Second, the data are adjusted for differences in the way states report spending—including different fiscal years and different financial accounting practices—to allow consistent comparisons among the states. Third, for each state, the bureau reports separate aggregate data for state governments, local governments, and other governmental entities, such as public universities and special districts, enabling an examination of overall public capital investment in a state regardless of the institutional structure. An important implication of these practices is that the census data for an individual state may differ from similar information reported in a state’s or city government’s budget or financial report. Still, for all the reasons noted above, census data are preferred for interstate comparisons of capital spending.
Endnotes
- For example, for the first $100 million of highway rehabilitation spending, a state is required to pay 20 percent of the costs of projects, and 80 percent is covered by the IIJA funding. While many projects have specified parameters for eligibility, a framework has been put in place to allow local control so that many municipal projects can function without state oversight, particularly for the competitive grants.
- See “Building a Better America: A Guidebook to the Bipartisan Infrastructure Law for State, Local, Tribal, and Territorial Government, and other Partners,” The White House, https://www.whitehouse.gov/wp-content/uploads/2022/01/BUILDING-A-BETTER-AMERICA_FINAL.pdf.
- Gramlich, Edward. 1994. “Infrastructure Investment: A Review Essay.” Journal of Economic Literature 32(3): 1176–1196.
- Cohen, Jeffrey P., and Catherine J. Morrison Paul. 2004. “Public Infrastructure Investment, Interstate Spatial Spillovers, and Manufacturing Costs.” The Review of Economics and Statistics 86(2): 551–560.
- The effect of a high-quality public infrastructure varies based on the type of analysis performed, the period examined, and the method of measuring the public capital stock. Munnell (1992), Gramlich (1994), Fisher (1997), and Bivens (2012) provide reviews of this literature.
Munnell, Alicia. 1992. “Policy Watch: Infrastructure Investment and Economic Growth.” Journal of Economic Perspectives 6(4): 189–198.
Gramlich, Edward. 1994. “Infrastructure Investment: A Review Essay.” Journal of Economic Literature 32(3): 1176–1196.
Fisher, Ronald C. 1997. “The Effects of State and Local Public Services on Economic Development.” New England Economic Review 1997(2): 53–67.
Bivens, Josh. 2012. “Public Investment: The Next New Thing for Powering Economic Growth.” Briefing Paper 338. Economic Policy Institute. - Hansen, Niles M. 1965. "Unbalanced Growth and Regional Development," Western Economic Journal 4: 3–14.
- While the ASCE is an interested party because its members stand to receive a direct financial benefit from increased spending on these projects, the ASCE report card is nevertheless the most thorough available resource for comparing a wide range of public infrastructure across states.
- Fisher, Ronald, and Riley Sullivan. 2016. “Why Is State and Local Government Capital Spending in the New England States Lower than in the U.S.?” Federal Reserve Bank of Boston Policy Report 16-1.
- The average across New England is 152 percent of 2019 funding. Connecticut is similarly 152 percent, and New Hampshire (225 percent), Maine (247 percent), and Rhode Island (254 percent) all exceed the national and regional averages.
- Eberts, Randall W. 1990. “Public Infrastructure and Regional Economic Development.” Economic Review 26(1): 15–27.

 About the Authors
Riley Sullivan,
Federal Reserve Bank of Boston
Riley Sullivan is a senior policy analyst with the New England Public Policy Center in the Federal Reserve Bank of Boston Research Department.
Email: riley.sullivan@bos.frb.org
Resources
Site Topics
Keywords
- New England ,
- NEPPC ,
- infrastructure spending ,
- Infrastructure Investment and Jobs Act ,
- Bipartisan Infrastructure Law