Recent Migration and Visa Trends in New England and Implications for the Labor Market 


| Key Facts | |
 |
From 2010 to 2021, 56 percent of the total population growth in New England came from increases in foreign-born residents. |
 |
The labor force participation rate of foreign-born residents in the region in 2022 was 4 percentage points higher than that of native-born residents. |
 |
While numbers of J-1 visa workers and international students in the region have declined, overall temporary employment visa use in the region has continued to rise. |
 |
|
The contributions of foreign-born residents to the workforce in New England have become increasingly important. In the region, the share of population growth since 2010 that is attributable to foreign-born residents (56 percent) is more than double the national share (24 percent). In 2021, foreign-born workers comprised 17.4 percent and 17.2 percent of the US and New England labor force, respectively.
Dramatic shifts in employment and labor force participation related to the COVID-19 pandemic further illustrate the region’s increasing reliance on foreign-born workers. Labor force participation rates among native-born residents in New England were flat in the years leading up to 2020 and have not fully recovered from their sharp declines during the early months of the pandemic. At the same time, the labor force participation rate for foreign-born workers was trending upward before the pandemic, and rates have recovered more quickly than those for their native-born counterparts.
This brief focuses on programs for temporary-employment visas and student visas—two important sources of legal immigration—and it evaluates their contributions to New England’s labor supply in recent years. The brief shows that while the number of visas granted in high-tech-focused programs (H1-B) increased from 2018 to 2021, visas for seasonal work (J-1) declined sharply, exacerbating worker shortages reported by hotels and other tourism-related establishments and in tourism-dependent regions of New England. Participation in seasonal labor programs rebounded in 2022, but declines in international students predate the pandemic and will continue to affect universities and businesses that employ new graduates for years to come.
Sign up for new research and data on the New England economy.
Foreign-born Residents in New England
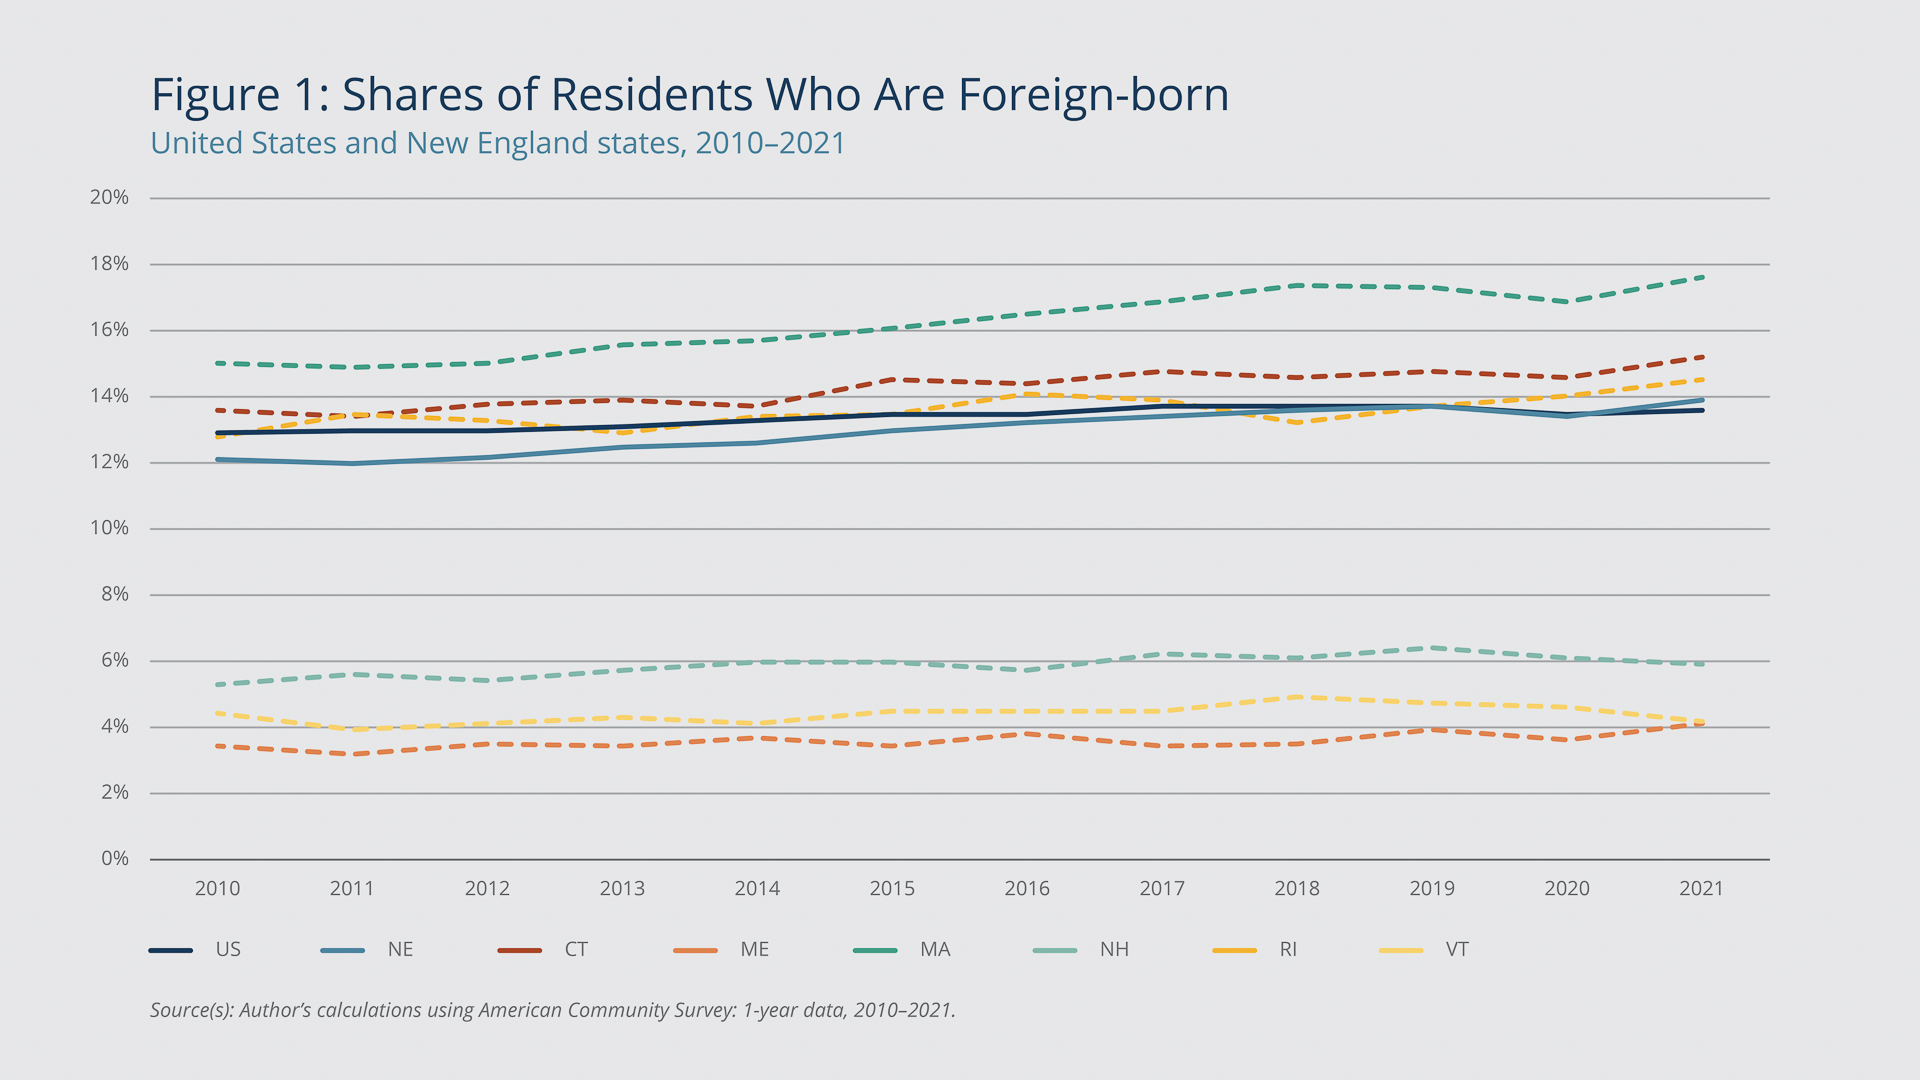
As with several demographic dimensions, there is a divide between the southern and northern New England states in terms of shares of foreign-born residents. The southern New England states, particularly Massachusetts, have largely maintained foreign-born population shares that are greater than the national average, and that share rose from 2010 to 2021. Meanwhile, the northern New England states have seen their populations’ shares of foreign-born residents remain largely consistent over that same period, and Vermont and Maine host shares that are roughly 10 percentage points below the national and regional averages.
In 2010, the region’s population had a smaller proportion of residents who were foreign-born compared with the United States as a whole, but that gap narrowed, and in 2021, the New England share (13.9 percent) slightly outstripped the national share (13.6 percent). The change is largely attributable to the foreign-born population in Massachusetts, which increased 2.7 percentage points over the last decade.
Foreign-born residents are, on average, younger than native-born residents. This trend could help to mitigate a demographic imbalance between the region and the rest of the country. In addition to having relatively low shares of foreign-born residents, the populations of the three northern New England states have the nation’s highest median ages, raising the region’s median age above that of the United States.1 An older population in which a larger share of workers are reaching typical retirement ages can have negative implications for labor force participation rates and local labor markets.

Federal Reserve Bank of Boston
Table 1: Population Changes by Nativity
United States and New England states, 2010–2021
| Total Population | Foreign-born Population | Population Change Excluding Foreign-born Residents | Share of Total Population Growth from Foreign-born Residents | |||
| 2010 | 2021 | 2010 | 2021 | |||
| US | 309,349,689 | 331,893,745 | 39,955,854 | 45,270,103 | 6.4% | 24% |
| NE | 14,457,499 | 15,092,739 | 1,747,987 | 2,101,631 | 2.2% | 56% |
| CT | 3,577,073 | 3,605,597 | 487,120 | 549,441 | –1.1% | 218% |
| ME | 1,327,567 | 1,372,247 | 45,666 | 56,068 | 2.7% | 23% |
| MA | 6,557,254 | 6,984,723 | 983,564 | 1,227,488 | 3.3% | 57% |
| NH | 1,316,759 | 1,388,992 | 69,742 | 82,127 | 4.8% | 17% |
| RI | 1,052,886 | 1,095,610 | 134,335 | 159,304 | 1.9% | 58% |
| VT | 625,960 | 645,570 | 27,560 | 27,203 | 3.3% | –2% |
| Source(s): Author’s calculations using American Community Survey: 1-year data, 2011–2021. | ||||||
The growth of the native-born population has been slowing for decades across the country, and it has decelerated even more in New England. Indeed, Connecticut would have experienced negative population growth over the last decade without the influx of foreign-born residents. In the region, 56 percent of the population growth from 2010 to 2021 is attributable to the increase in foreign-born residents. Although foreign-born residents comprise less than 14 percent of the total population in New England, they drove more than half of the total population growth, which is substantially greater than the national average. The United States hosted more than 5 million more foreign-born residents in 2021 compared with 2010, which represents a 13 percent increase. The foreign-born population in New England increased by more than 354,000, or 20 percent, over that period. More than two-thirds of that regional rise was the result of the growing foreign-born population in Massachusetts, which increased by roughly 244,000 in the 12 years considered.
The Use of Different Types of Visas in New England
In general, foreign citizens can migrate to the United States on family-based or employment-based visas that require the sponsorship of US citizens, legal permanent residents, or prospective employers. However, only a small number of permanent resident visas, or “green cards,” are allocated for employment-based immigration. In 2021, 52 percent of immigrants were immediate relatives of US citizens.2 Employment-based visa recipients tend to be highly skilled and highly educated, as the visas are allocated on a preference-based system that favors those with exceptional abilities, professional experience, or advanced degrees.
Foreign-born workers and students can access various visa programs to enter the United States. Four of the most widely used programs are J-1, H-1B, H-2B, and H-2A visas.3 Table 2 shows the number of approved petitions for each type of visa. In New England, the J-1 and H-2B visas typically are used for seasonal workers, often in the hospitality industry, but other sectors are also eligible to employ foreign-born workers. These visa types are popular in summer destinations, where an influx of labor supply is needed for just a portion of the year. H-1B visas are reserved for specialty occupations, such as highly skilled workers in the life sciences industry and other sectors. H-2A visas, which are used for temporary agricultural workers, are more prevalent in other parts of the country; in 2021, New England hosted 3,704 workers under that program, which amounted to just over 1 percent of the national share.
Table 2: Recent Changes in Numbers of Visas Used
United States and New England states, 2018–2022
| US | NE | CT | ME | MA | NH | RI | VT | ||
| J-1 | 2018 | 104,512 | 15,329 | 640 | 3,097 | 6,588 | 2,611 | 862 | 1,531 |
| 2021 | 39,647 | 6,237 | 172 | 1.406 | 2,174 | 1,019 | 274 | 1,192 | |
| 2022 | 92,619 | 13,446 | 526 | 2,644 | 5,165 | 2,317 | 719 | 2,075 | |
| H-1B | 2018 | 334,961 | 21,598 | 3,426 | 285 | 16,397 | 525 | 681 | 284 |
| 2021 | 475,123 | 39,504 | 5,534 | 512 | 29,722 | 937 | 2,409 | 390 | |
| 2022 | 466,191 | 26,768 | 3,696 | 348 | 19,808 | 704 | 1,947 | 265 | |
| H-2B | 2018 | 103,197 | 5,330 | 340 | 1,625 | 2,144 | 358 | 400 | 463 |
| 2021 | 132,301 | 6,454 | 192 | 2,329 | 2,319 | 712 | 560 | 342 | |
| 2022 | 183,002 | 9,398 | 338 | 3,083 | 3,370 | 1,033 | 622 | 952 | |
| H-2A | 2018 | 279,482 | 2,454 | 618 | 665 | 439 | 187 | 5 | 540 |
| 2021 | 339,314 | 3,704 | 1,287 | 1,152 | 497 | 268 | 4 | 496 | |
| Source(s): Author’s calculations using US Citizenship and Immigration Services H-2B, H-1B, and H-2A Data Hub files, FY 2018 and FY 2021 and US Department of State’s J-1 Visa data files. Note(s): J-1 visas are limited to summer work travel students. The H-1B, H-2B, and H-2A numbers reflect the total number of approved petitions for positions in these areas and do not reflect the actual number of employees working in that year. H-2A state worksite data were not available for 2022 at the time of writing, but 402,929 petitions were approved nationally. |
|||||||||
The number of J-1 visas dropped sharply with the onset of the COVID-19 pandemic and remained depressed in 2021, which disproportionately affected Cape Cod and other tourist areas. Program participation rebounded in 2022 but remained below pre-pandemic levels. This reduction in available foreign-born workers coincided with low unemployment, exacerbating the difficulty businesses faced hiring workers. The H-1B program and other longer-term visa programs are a substantial component of the labor force in New England, particularly Greater Boston. In addition to employing foreign-born workers, the New England states host thousands of international students annually. International students are eligible to transition to the workforce on a temporary basis through Optional Practical Training (OPT), which directly affects the labor supply.4 The various visa programs—and recent trends—which are discussed in greater detail below, combine to represent tens of thousands of workers throughout the region.
Seasonal Workers: J-1 and H-2B Visas
Although the J-1 and H-2B programs are operated by different departments of the federal government (the US Department of State and the US Department of Labor, respectively) and have different goals (the J-1 program emphasizes educational training), in New England, most of the seasonal workers in both programs are employed in the same industry: leisure and hospitality. In the region, Cape Cod, Nantucket, Martha’s Vineyard, and the counties along the coast of Maine have the highest use of these types of visas.
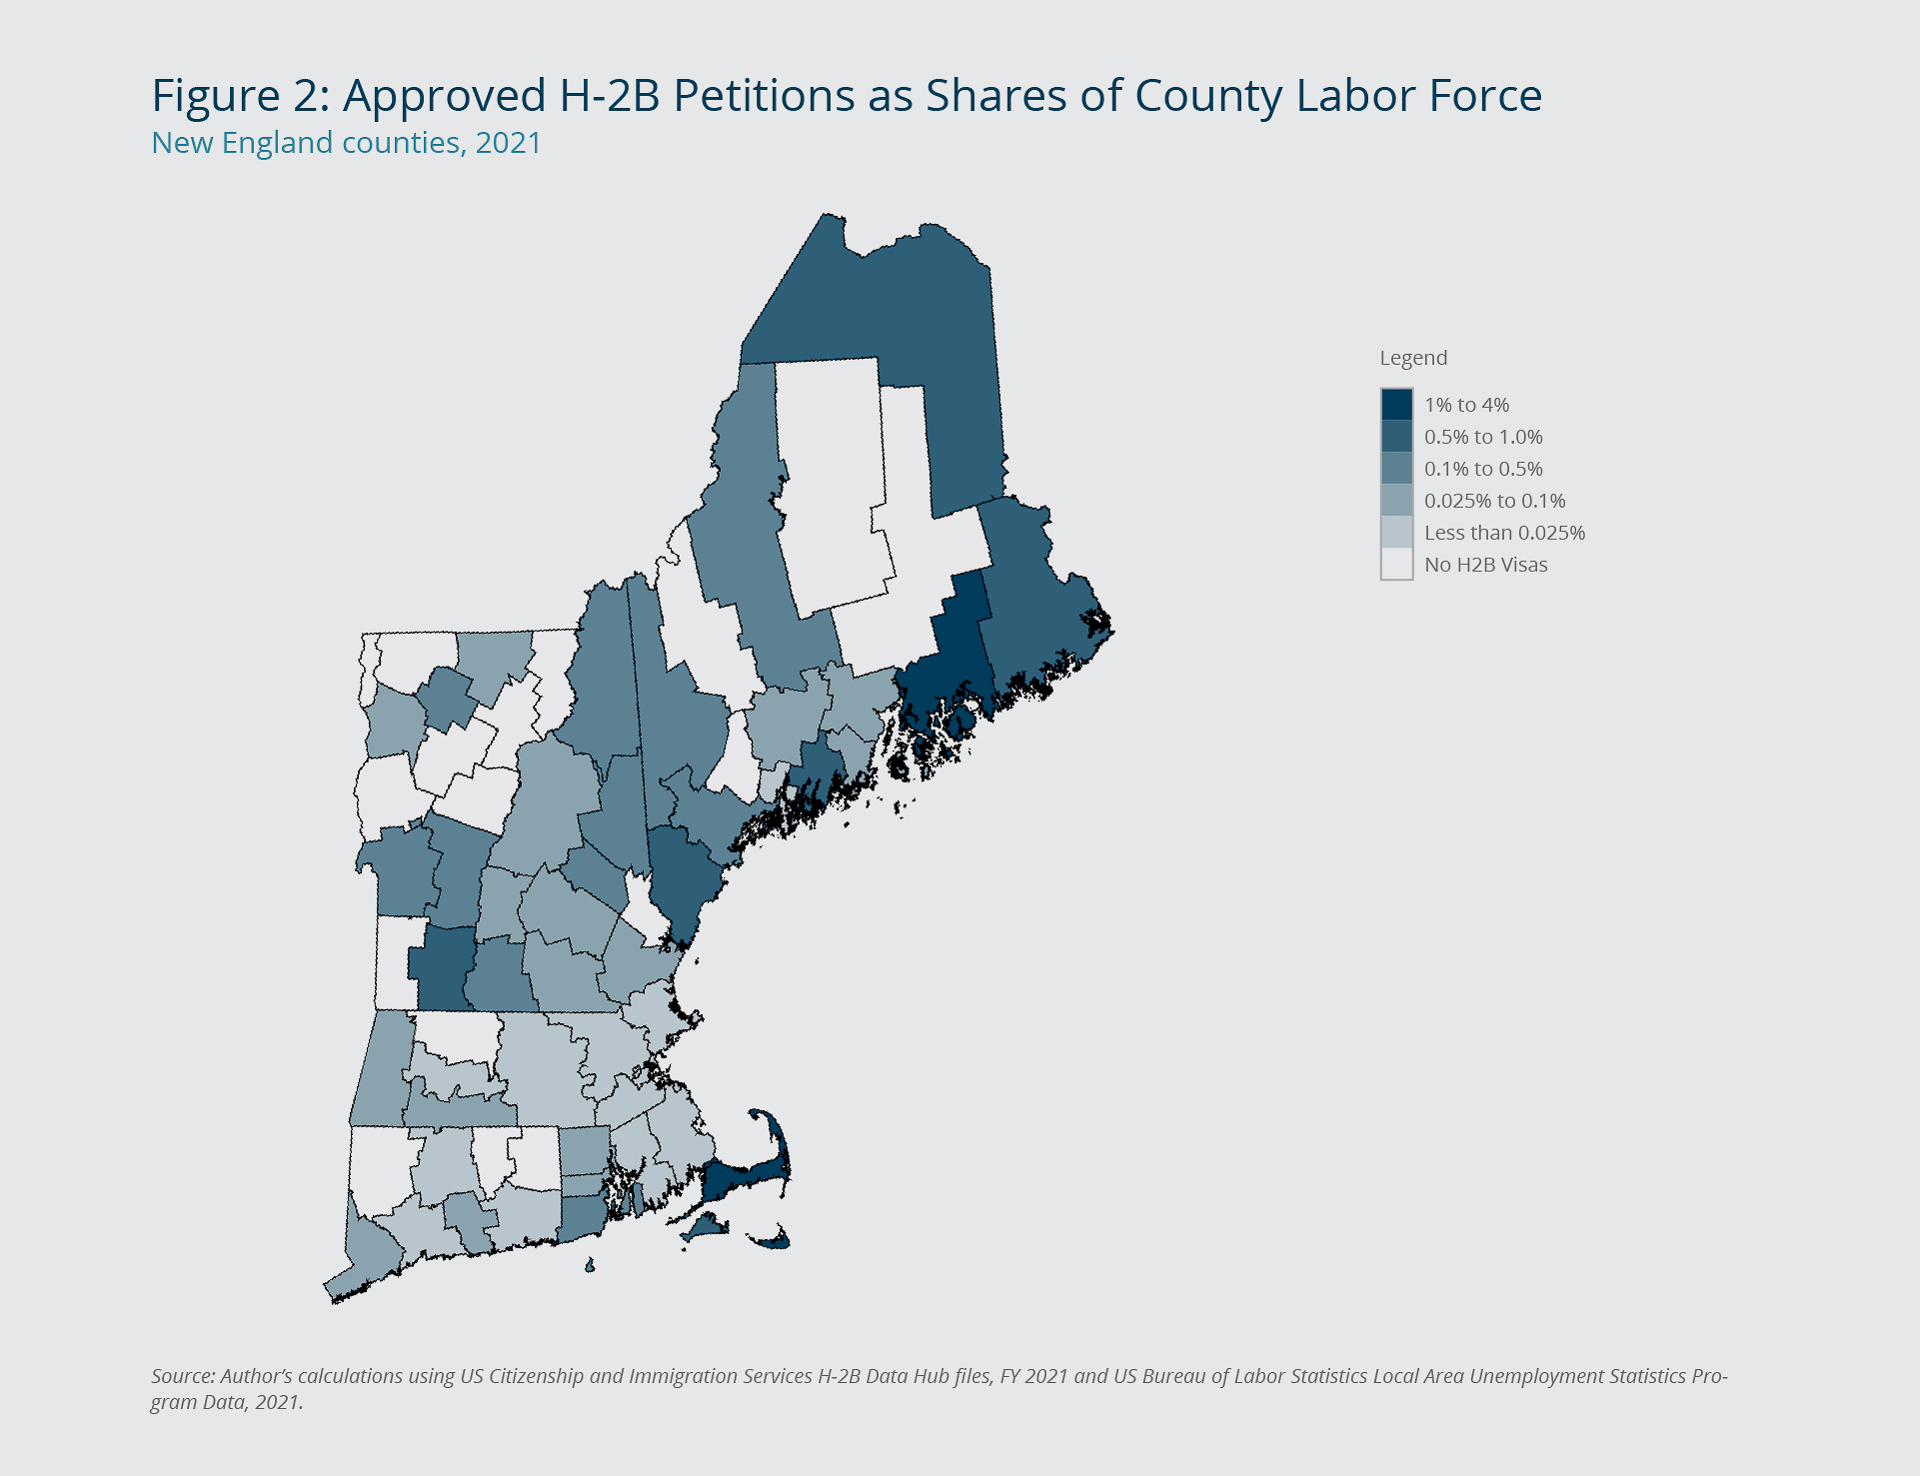
From 2018 to 2021, the number of J-1 visas dropped substantially nationwide as the pandemic limited international travel and access to foreign consulates, where applications typically originate. Collectively, businesses in New England employed more than 9,000 fewer J-1 visa workers in 2021 compared with 2018. By contrast, the number of workers on H-2B visas increased during that period but by just slightly more than 1,100. Figure 2 illustrates the role H-2B visas played in supplying the labor force of each New England county in 2021. About 5 percent of the country’s total number of participants in J-1 summer work programs were on Cape Cod, Martha’s Vineyard, and Nantucket, and the sharp decline in J-1 visas particularly affected the local labor market in those areas despite the increase in H-2B visas.
Federal Reserve Bank of Boston
H-1B Visas
Instead of the seasonal visa programs, a longer-term (but still temporary) option for certain foreign workers is the H-1B visa. Created in 1990, the H-1B visa program allows employers to hire guest workers in "specialty occupations" and allows these workers to apply for permanent residency while working on the temporary visa, a practice referred to as “dual intent.” Visas are granted for an initial three-year interval and can be extended for an additional three-year term.
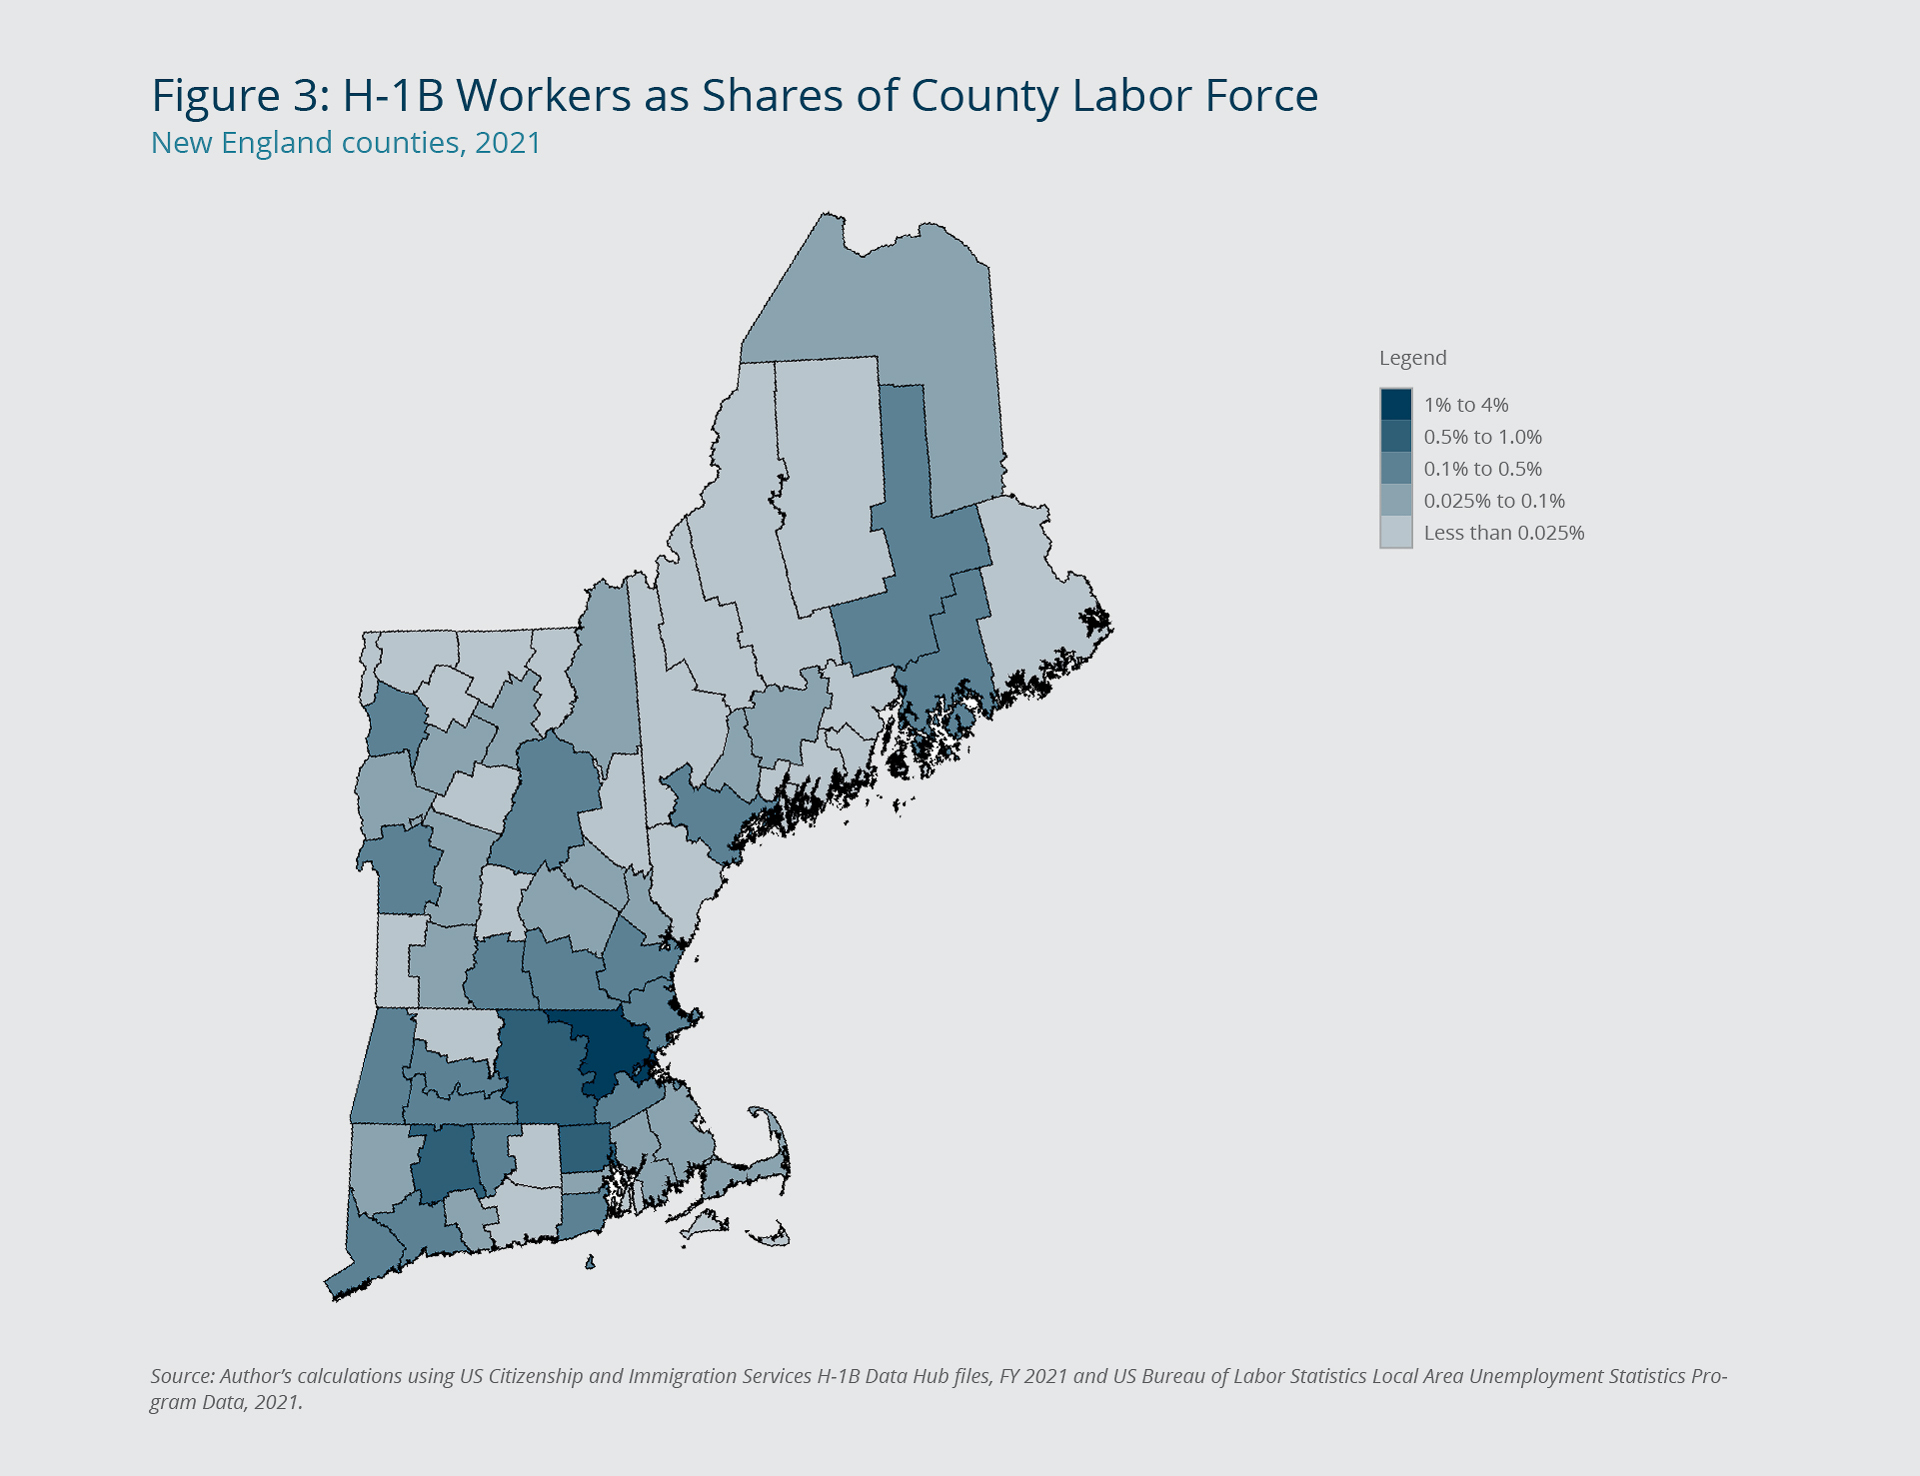
New England has some of the highest demand for H-1B workers nationwide, relative to employment, due to significant demand from a few metropolitan labor markets in Connecticut and Massachusetts. Figure 3 shows the substantial share of H-1B workers in the labor force of each New England county. The labor forces of Suffolk (2.4 percent) and Middlesex (1.4 percent) counties in Massachusetts have two of the highest concentrations of H-1B visa holders; each hosted more than 10,000 in 2021. Unlike the number of seasonal workers, the number of workers with H-1B visas rose from 2018 to 2021.
Federal Reserve Bank of Boston
International Students
New England is home to a disproportionate share of colleges and universities compared with the rest of the country. In the 2021–2022 academic year, New England hosted 93,505 students, and more than 70,000 of those students were based in Massachusetts. Several of the region’s schools are among the most popular destinations for international students, who add millions of dollars annually to each New England state’s economy. Massachusetts hosted nearly 10 percent of all international students in the country during the 2021–2022 academic year. Despite the large numbers of students, each New England state, except for Maine, hosted fewer international students in the 2021–2022 academic year than it did before the onset of the pandemic. Table 3 lists the enrollment in recent academic years for the New England states and the nation. After the number of international students fell sharply in the 2020–2021 academic year, it did not fully recover the following year.
Table 3: Population Changes by Nativity
United States and New England states, 2010–2021
| 2018-2019 | 2019-2020 | 2020-2021 | 2021-2022 | |||
| US | 872,214 | 851,957 | 710,210 | 763,760 | ||
| NE | 98,666 | 100,592 | 87,715 | 93,505 | ||
| CT | 14,832 | 15,112 | 11,778 | 12,352 | ||
| ME | 1,335 | 1,480 | 1,427 | 1,492 | ||
| MA | 71,098 | 73,695 | 66,273 | 71,026 | ||
| NH | 4,333 | 3,531 | 2,828 | 2,942 | ||
| RI | 5,376 | 5,225 | 4,181 | 4,401 | ||
| VT | 1,692 | 1,549 | 1,228 | 1,292 | ||
| Source(s): Author’s calculations using American Community Survey: 1-year data, 2011–2021. | ||||||
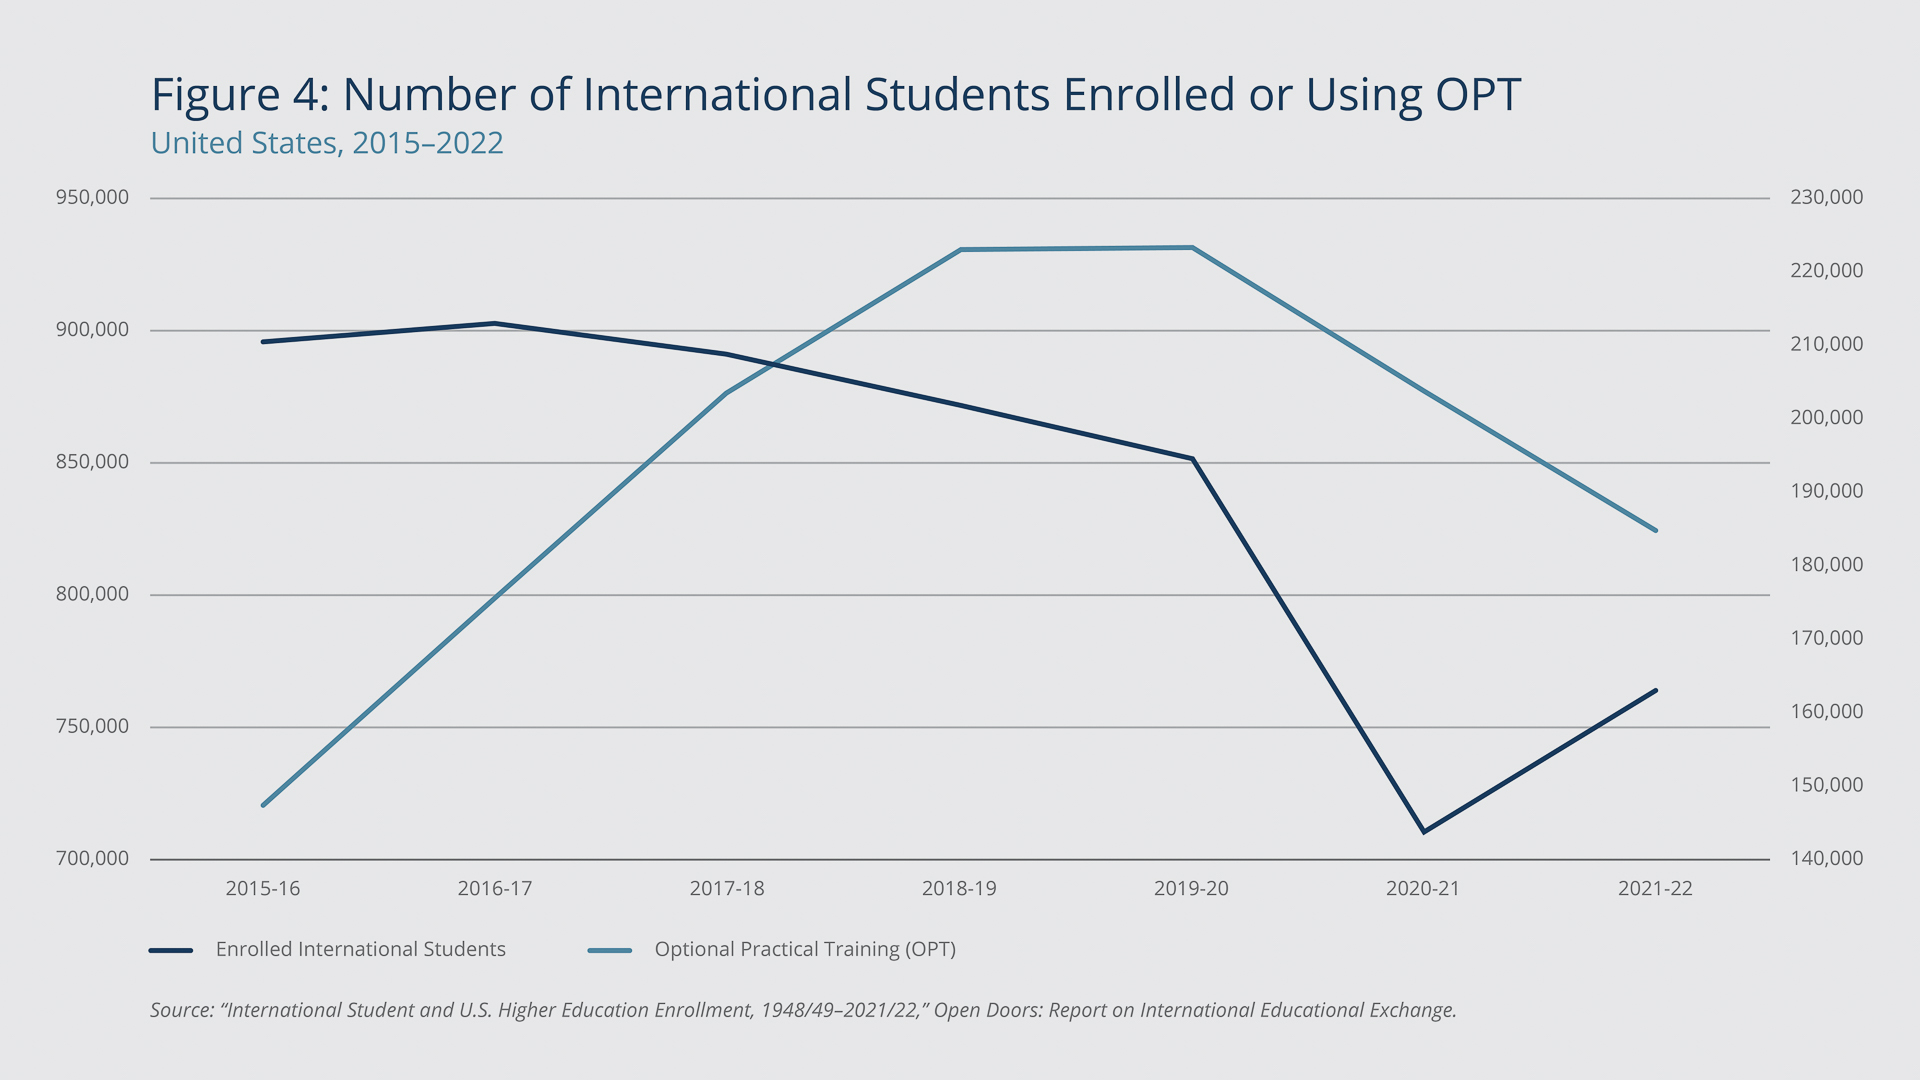
The impact of international students on local economies lasts throughout enrollment, and their effect on the local labor markets can continue if they engage in Optional Practical Training (OPT), which allows these students to work while they are in school and for a year after they graduate. An additional, second year is available for students with degrees in STEM fields. Figure 4 illustrates the national levels of enrolled students and those engaged in OPT work.
Federal Reserve Bank of Boston
While the pandemic led to a sharp decline nationally in international-student enrollment, a trend of decreasing enrollment predates the pandemic. Since the 2016–2017 academic year, enrollment has been modestly but steadily falling at the national level. Students engaged in OPT work had lagged the enrollment trend, but a slowed growth and eventual decline in the number of those workers occurred in the second half of the observed period, as depicted in Figure 4.
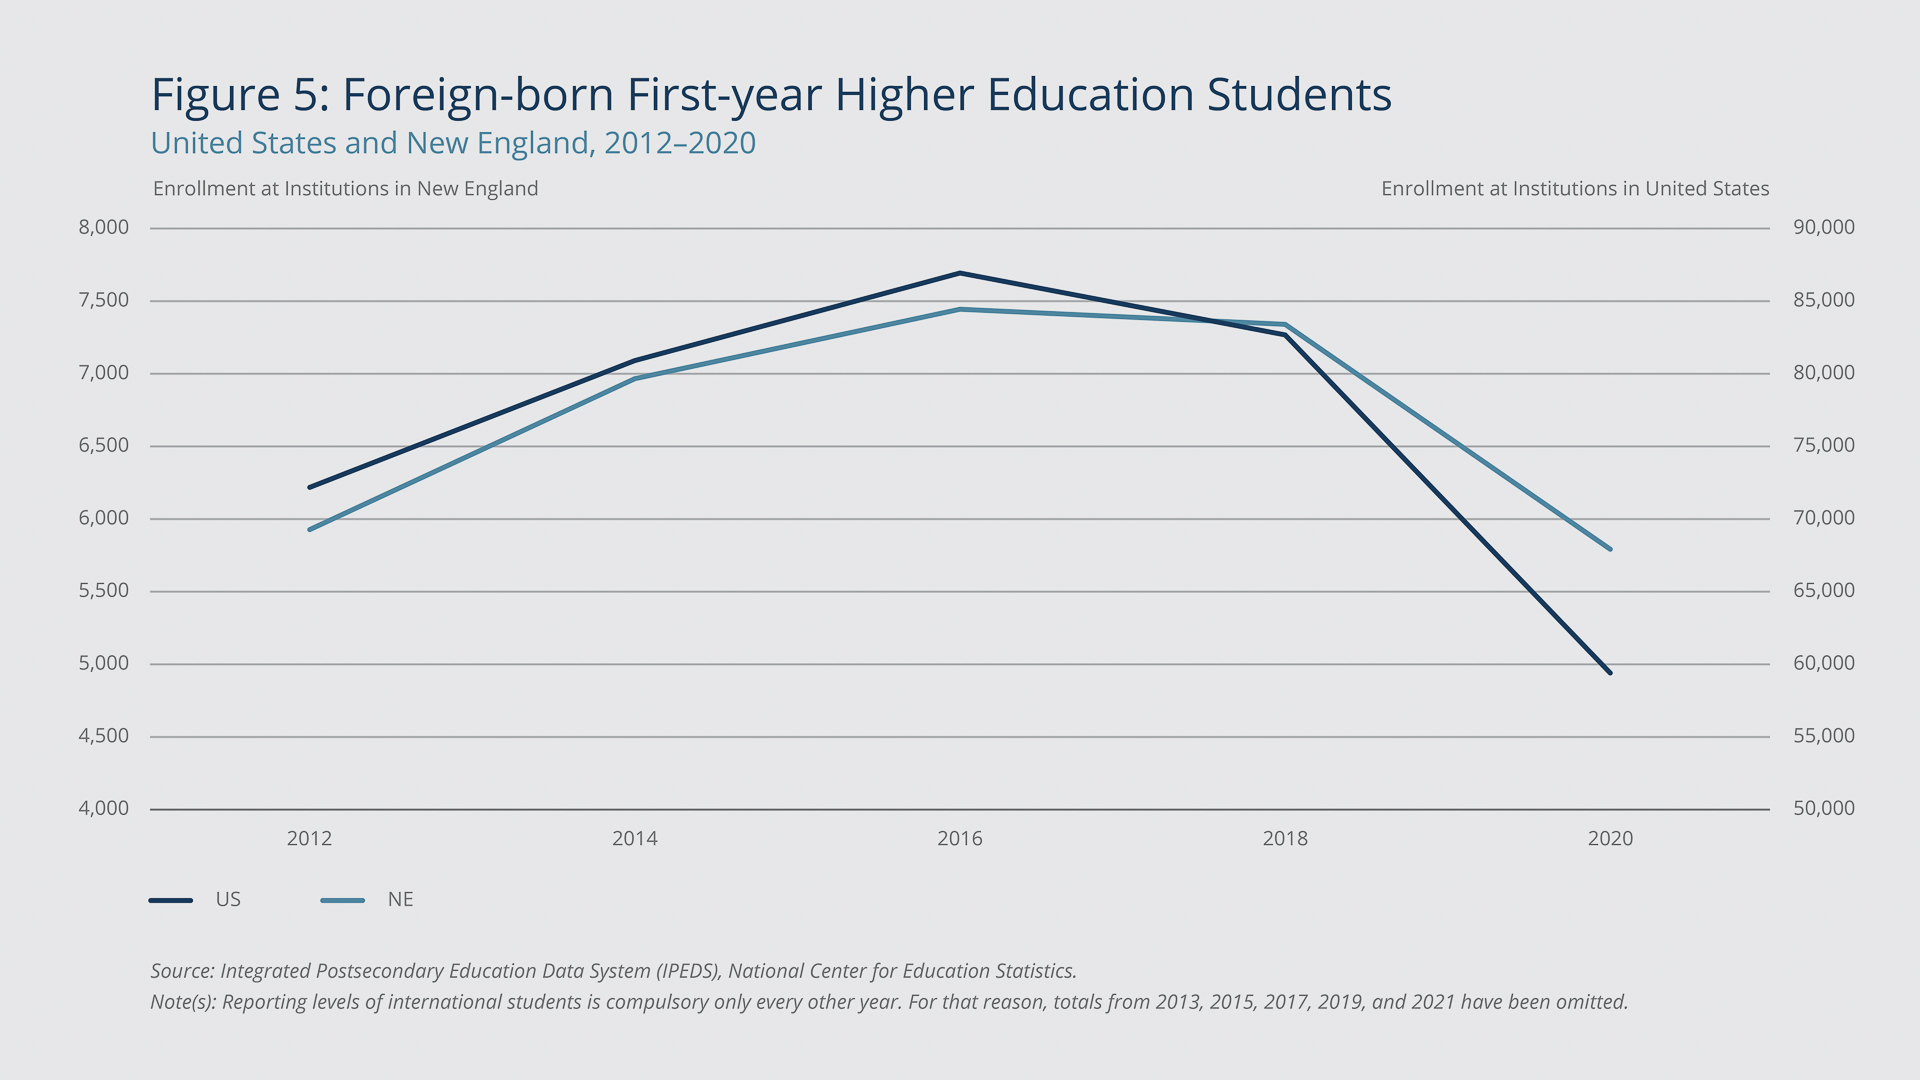
Figure 5 shows the biennial change in enrollment of first-year international college students for the United States and for New England. Enrollment of international students peaked in 2016 and fell in 2018, but the change was more modest in the region than nationally. From 2018 to the fall of 2020, after the onset of the pandemic, the enrollment plummeted both nationally and regionally, though the national decline was even more pronounced.
Federal Reserve Bank of Boston
The Role of Immigrants in the Labor Force
The COVID-19 pandemic led to a sharp decline in payroll employment throughout the country, and it affected every county in New England. Despite a quick recovery in employment and a return to historically low unemployment rates, the total size of the labor force has yet to recover in many parts of the region. This lasting dip in the labor force is attributable to a range of factors, including the continued aging of the region’s population, which is older than national average.
Before the pandemic, the labor force participation rates (LFPRs) for nearly all the New England states historically had been higher than the US rate (Maine’s rate fell below the national rate in 2018). Since the onset of the COVID-19 crisis, the LFPR in Maine has been persistently below the national rate, and the rates of the other New England states have, on average, remained closer to the national rate than had been typical.
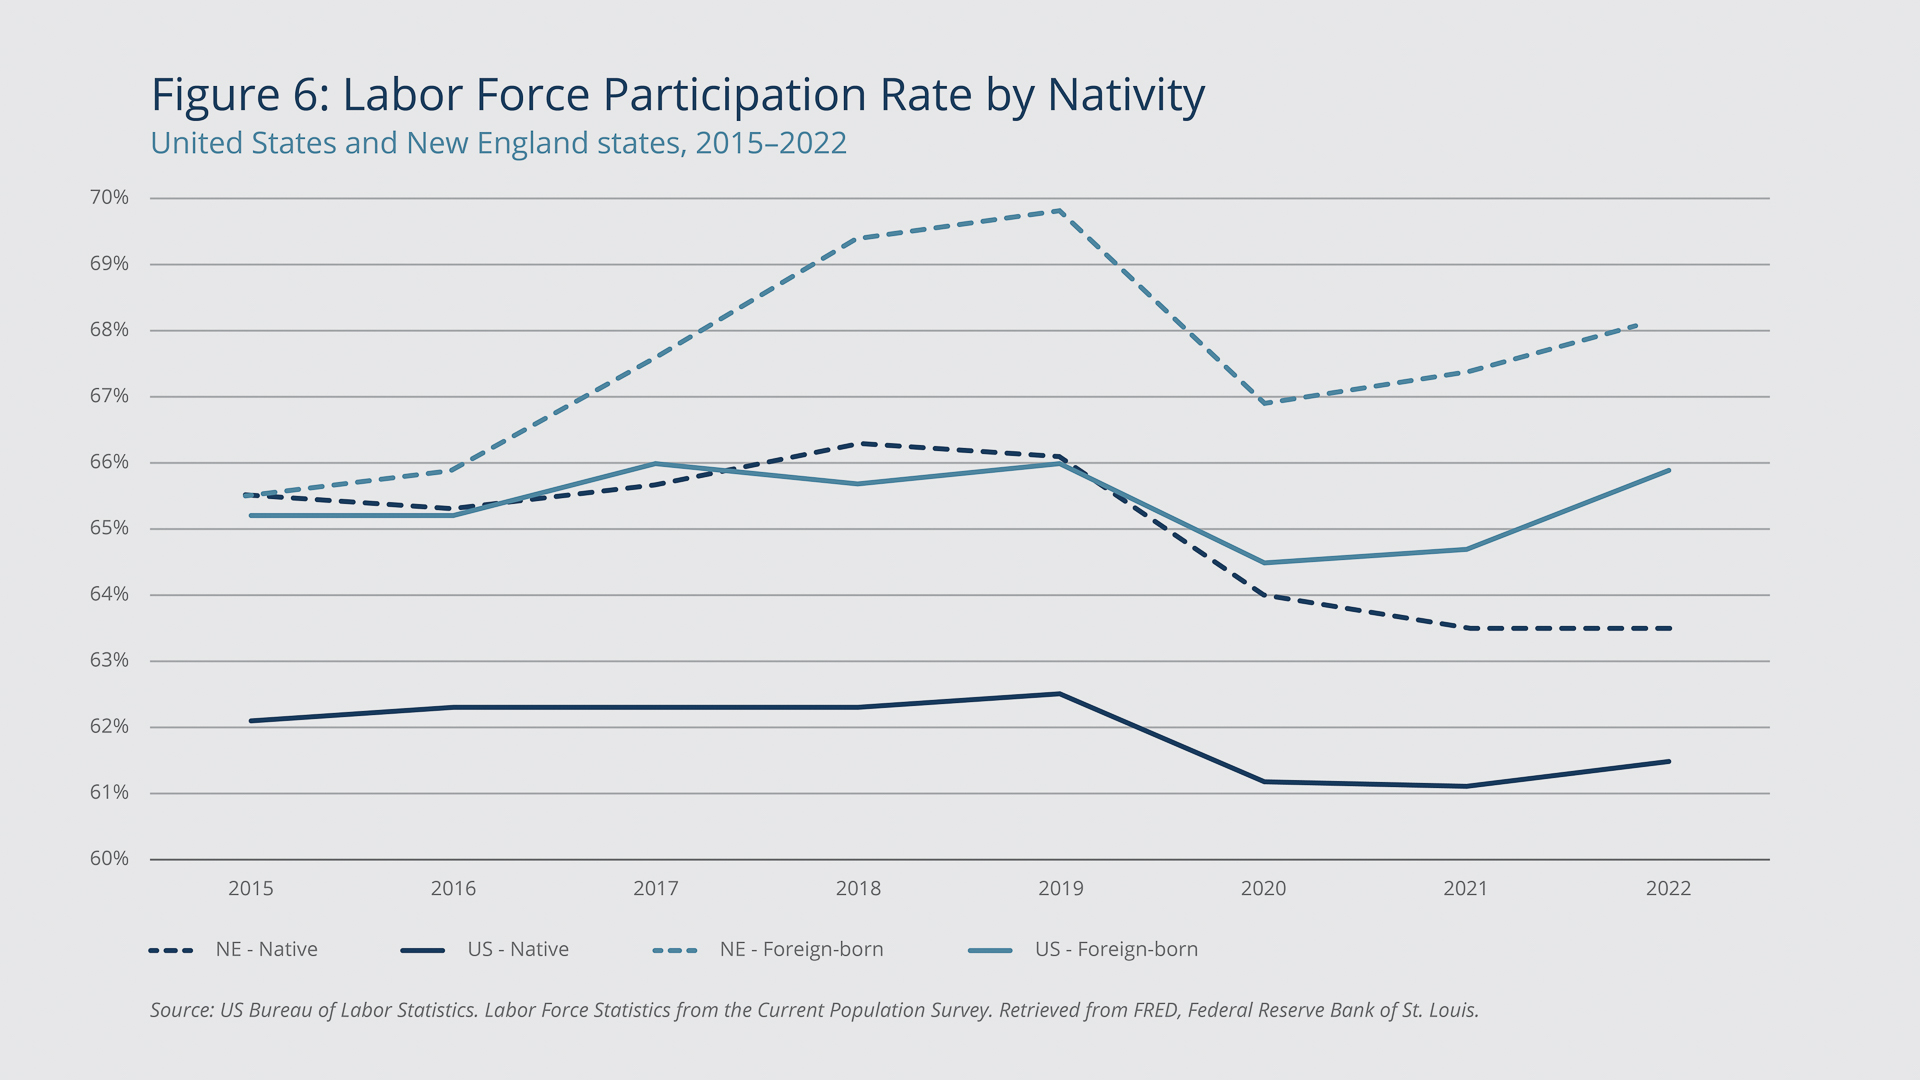
Foreign-born residents throughout the country and region have, on average, higher rates of labor force participation compared with native-born residents (see Figure 6). Not only has the foreign-born LFPR exceeded the native-born rate, it also has recovered more quickly from pandemic declines. In 2015, the foreign-born and native-born LFPRs in New England were the same, but by 2022, the rates had diverged by more than 4 percentage points. These rates highlight the national, and particularly the regional, importance of foreign-born workers in bolstering the flagging LFPR.
Federal Reserve Bank of Boston
While the exact cause of the difference between the New England and national LFPRs is not the focus of this brief, several demographic factors plausibly are contributing to these diverging trends. New England has an older population, yet historically it has had a higher LFPR among older workers compared with the rest of the country.5 The pandemic led workers near or past typical retirement ages to exit the labor disproportionately, which could help to explain why the LFPR for native-born New Englanders has been slow to recover.6 Additionally, differences in labor force participation between men and women diverge more substantially among foreign-born residents, with men landing above and women falling below their native-born counterparts.7 The composition of industries employing these different workers may also have played a role in the varying outcomes since the onset of the pandemic.
According to US Census data, the flow of immigrants to New England varied widely from 2011 through 2022. From 2013 through 2017, on average, about 70,000 immigrants arrived in New England annually. By 2019, that number had fallen to about 45,000. The slowdown leading up to 2020 demonstrates that the chilling effect of the pandemic was not the sole cause of diminished immigrant-population growth. This is a concern because New England simultaneously faces near-term labor shortages and long-term slow population growth that is becoming slower. Immigration is relevant to both issues, but overhauling immigration processes would be necessary to overcome the long-run challenges.
The temporary visa programs may be an important component of addressing the labor shortages confronting the region. Reduced worker availability has plagued portions of the economy in recent years, including the hospitality sector, resulting in delays and reductions in operating hours.8 In some areas, such as Cape Cod, labor shortages are associated with the sharp decline in J-1 visas. Despite the headlines this issue grabbed, it is not emblematic of all visa programs. The use of H-1B and H-2B visas has increased since before the pandemic. However, the number of international students in New England has declined, and this is a trend that predates the COVID-19 crisis.
Together, these patterns illustrate that foreign-born workers and students are vital to the economy and that the labor shortages in recent years are not entirely attributable to pandemic-era declines. Overhauls to permanent-immigration pathways and changes in caps and processes for temporary visas could alleviate a portion of the longer-run demographic challenges in New England.
Looking Ahead
Foreign-born residents affect the local economies and labor markets of all corners of New England and the United States. Whether through family-based immigration, work-sponsored seasonal and longer-term visa programs, or educational opportunities, an influx of foreign-born residents adds prime-age workers to the labor market. The addition of such workers is particularly important to a region such as New England, where the population is aging and rates of labor force participation are decreasing.
The slowdown in the J-1 visa summer-worker program in the region resulted in thousands of fewer workers in an already-tight labor market. Policymakers in Massachusetts launched a pilot program this year that is intended to ease these difficulties. The legislature earmarked funding for the Cape Cod Chamber of Commerce to hire a housing coordinator and address the scarcity of low-cost housing that is one of the primary barriers for temporary workers in that area.9
Foreign-born workers have contributed substantially to the national and regional economy. The tight labor market combined with the demographic trends of New England signal that an influx of younger workers may be necessary to return to historic levels of labor force participation. Policymakers could consider reforms to temporary visa programs that would improve the efficiency of immigration processes and strengthen the national labor market by ensuring a continued supply of labor across all industries and skill levels.
Data Sources
This brief draws on a range of data sources from the US Census Bureau, the Bureau of Labor Statistics (BLS) of the US Department of Labor, the US Citizenship and Immigration Services (USCIS) Data Hub files, and the US Department of State’s J-1 Visa data files.
On April 1, 2019, USCIS launched the H-1B Employer Data Hub to provide information on employers petitioning for H-1B workers. The data hub allows the public to search for H-1B petitioners by fiscal year, NAICS code, employer name, city, state, or Zip code. On June 23, 2021, the USCIS launched the H-2B Employer Data Hub to provide information on US employers or US agents (“H-2B petitioners”) petitioning for H-2B workers. The data hub provides an additional layer of transparency to the H-2B program by allowing the public to search for H-2B petitioners by cap fiscal year, employer (petitioner) name, city, state, Zip code, worksite state, cap type, North American Industry Classification System (NAICS) code, and Standard Occupational Classification (SOC) code.
The labor market data in this brief come from the Local Area Unemployment Statistics (LAUS) program, a federal-state cooperative effort through which monthly estimates of total employment and unemployment are prepared for more than 7,500 areas. These estimates are key indicators of local economic conditions. The BLS is responsible for the concepts, definitions, technical procedures, validation, and publication of the estimates that state workforce agencies prepare under agreement with the bureau.
Endnotes
- In 2021, the median age for New England was 41.0 and the national median age was 38.8, according to the US Census Bureau.
- See Nicole Ward and Jeanne Batalova, “Frequently Requested Statistics on Immigrants and Immigration in the United States,” Migration Information Source, March 14, 2023. https://www.migrationpolicy.org/article/frequently-requested-statistics-immigrants-and-immigration-united-states
- These are among the four largest temporary-employment-based visa categories, but many other programs exist. They include E visas (for treaty traders, investors, and specialty occupations), I visas (for the foreign press), L visas (intracompany transfers), O visas (persons with extraordinary abilities), P visas (athletes and entertainers), Q visas (cultural exchange), R visas, (religious workers), and TN visas (NAFTA professionals from Mexico and Canada).
- Optional Practical Training (OPT) is temporary employment for students and recent graduates directly related to their major area of study for as long as 12 months for most students or 24 months for students with degrees in science, technology, engineering, or math (STEM).
- Burke, Mary A. 2016. “Labor Force Participation in New England vs. the United States, 2017–2015: Why Was the Regional Decline More Moderate?” Federal Reserve Bank of Boston Current Policy Perspectives No. 2016-2. https://www.bostonfed.org/publications/current-policy-perspectives/2016/labor-force-participation-in-new-england-vs-the-united-states-2007-2015.aspx
- Davis, Owen F., Laura D. Quinby, Matthew S. Rutledge, and Gal Wettstein. 2023. “How Did Covid-19 Affect the Labor Force Participation of Older Workers in the First Year of the Pandemic?” Journal of Pension Economics and Finance. doi:10.1017/S1474747223000045
- In July 2023, the LFPR for native-born males was 66.7 percent, and it was 58.0 percent for native-born women. Foreign-born men landed at 78.3 percent and foreign-born women at 56.1.
- See, for example, Allison Pohle, “Restaurants, Bars, and Hotels Keep Hiring and Say They Still Don’t Have Enough People,” Wall Street Journal, August 5, 2022. https://www.wsj.com/articles/restaurants-bars-and-hotels-keep-hiring-and-say-they-still-dont-have-enough-people-11659734572
- Massachusetts General Laws 2022, Chapter 268, Section 2A, 1599-6090. https://malegislature.gov/Laws/SessionLaws/Acts/2022/Chapter268

 About the Authors
Riley Sullivan,
Federal Reserve Bank of Boston
Riley Sullivan is a senior policy analyst with the New England Public Policy Center in the Federal Reserve Bank of Boston Research Department.
Email: riley.sullivan@bos.frb.org
Resources
Site Topics
Keywords
- New England ,
- NEPPC ,
- Labor Market ,
- immigration ,
- visas ,
- international students ,
- foreign-born workers ,
- COVID-19