New England’s Lotteries: Trends in State Revenues and Player Spending 


Federal Reserve Bank of Boston
The views expressed herein are solely those of the author and should not be reported as representing the views of the Federal Reserve Bank of Boston, the principals of the Board of Governors, or the Federal Reserve System.
Revenue from state-run lotteries has been a key component of public finance in New England since the 1960s in New Hampshire, which launched the country’s first modern-day state lottery, and the 1970s in the rest of the region. In fiscal year 2023, Massachusetts, collected record-breaking lottery revenue exceeding $6 billion, enabling it to contribute roughly $1.2 billion to cities and towns for municipal aid, infrastructure improvements, and educational services.1 New Hampshire reported a 5 percent year-over-year increase in lottery sales in fiscal year 2024 from fiscal year 2023. Proceeds from those sales contributed a record $200.7 million to the state’s fiscal year 2024 public education budget.2
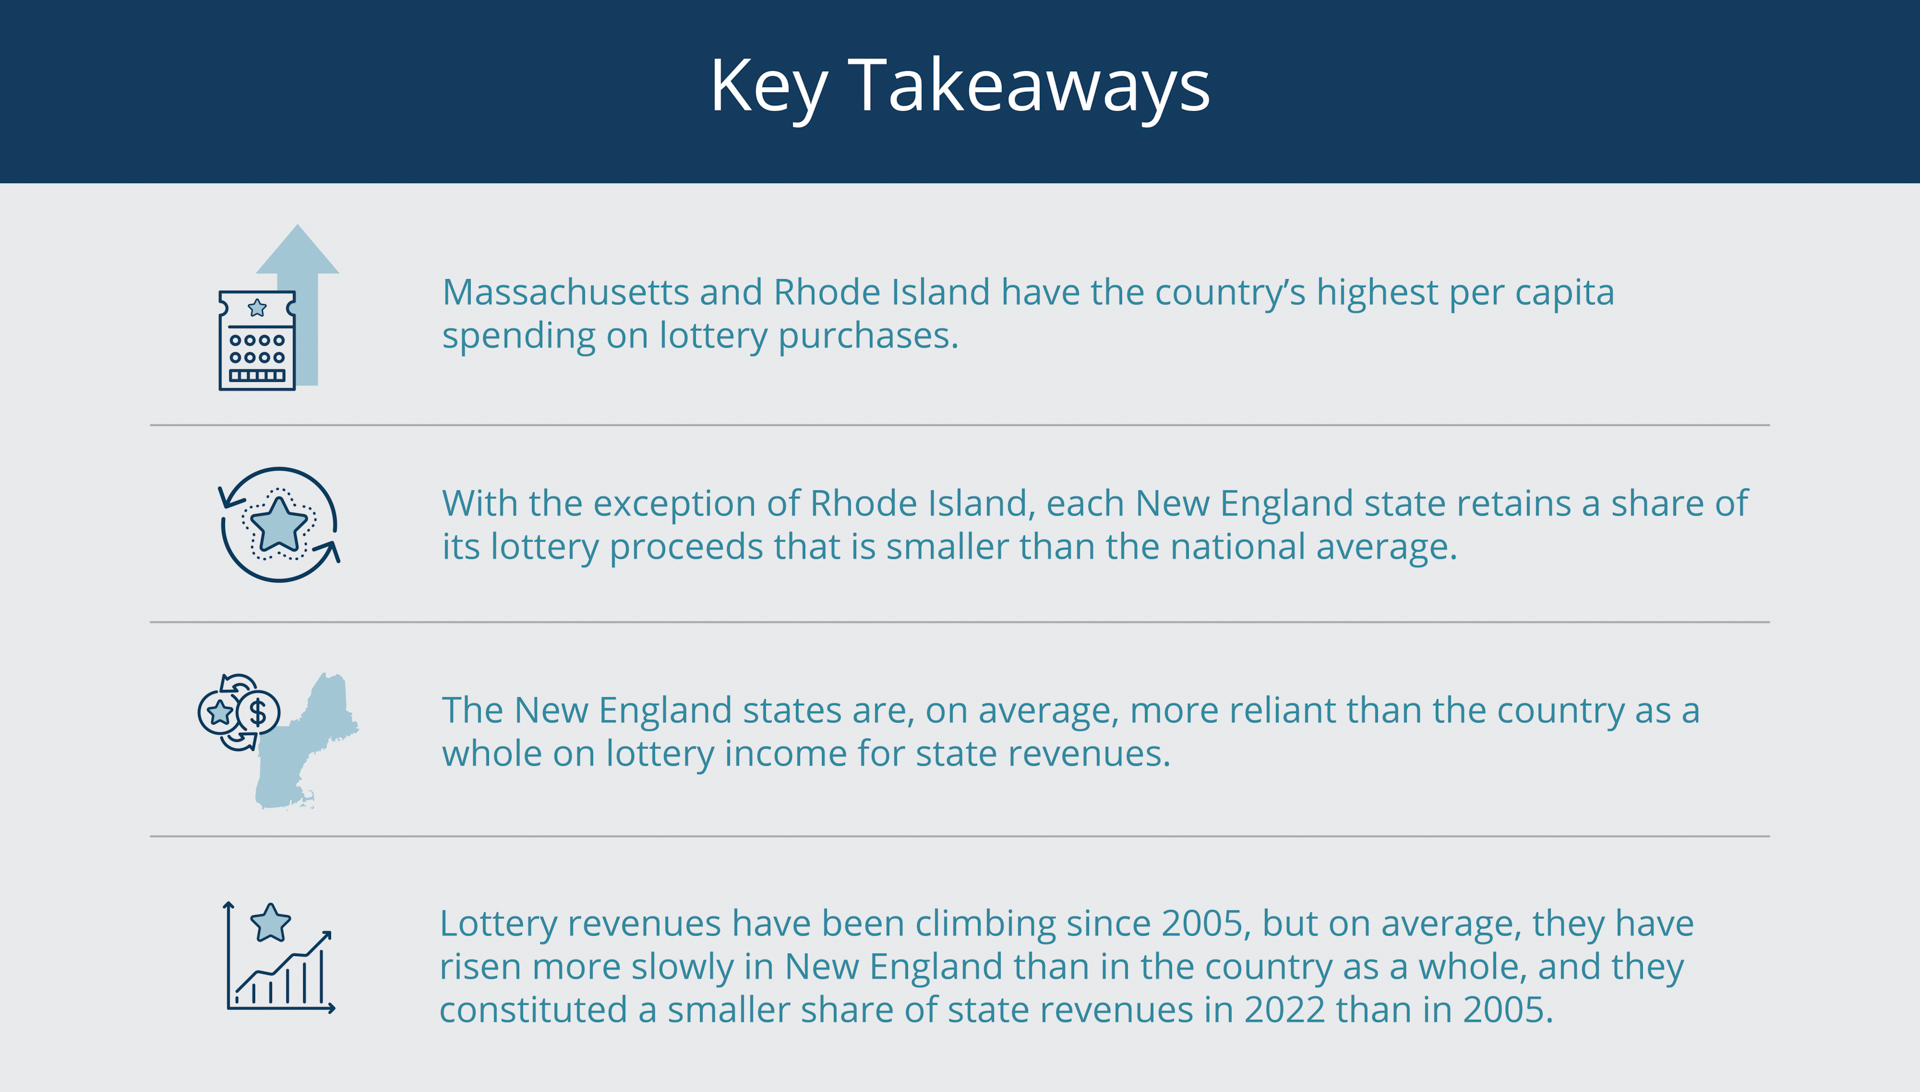
While lottery proceeds account for less than 3 percent of state revenues in each New England state, per capita spending on lottery purchases in Massachusetts is the highest in the country, and spending in Rhode Island is the second highest. For this reason, the benefits and detriments of state-run lotteries are particularly salient for the region. For example, despite the funding opportunities they represent, lotteries are often criticized for their regressive nature, for disproportionately affecting lower-income individuals who spend a larger percentage of their income on tickets (Dadayan 2016).
Sign up for new research and data on the New England economy.
In addition to concerns about the fairness of the lottery-based funding model, there are questions about its sustainability. Lottery proceeds continue to grow, but at a slower pace compared with other sources of state revenues, and the legalization of online sports betting plus the introduction of phone apps that enable online purchases of lottery tickets may influence lottery revenue trends going forward.
Per Capita Lottery Spending Is Relatively High in New England
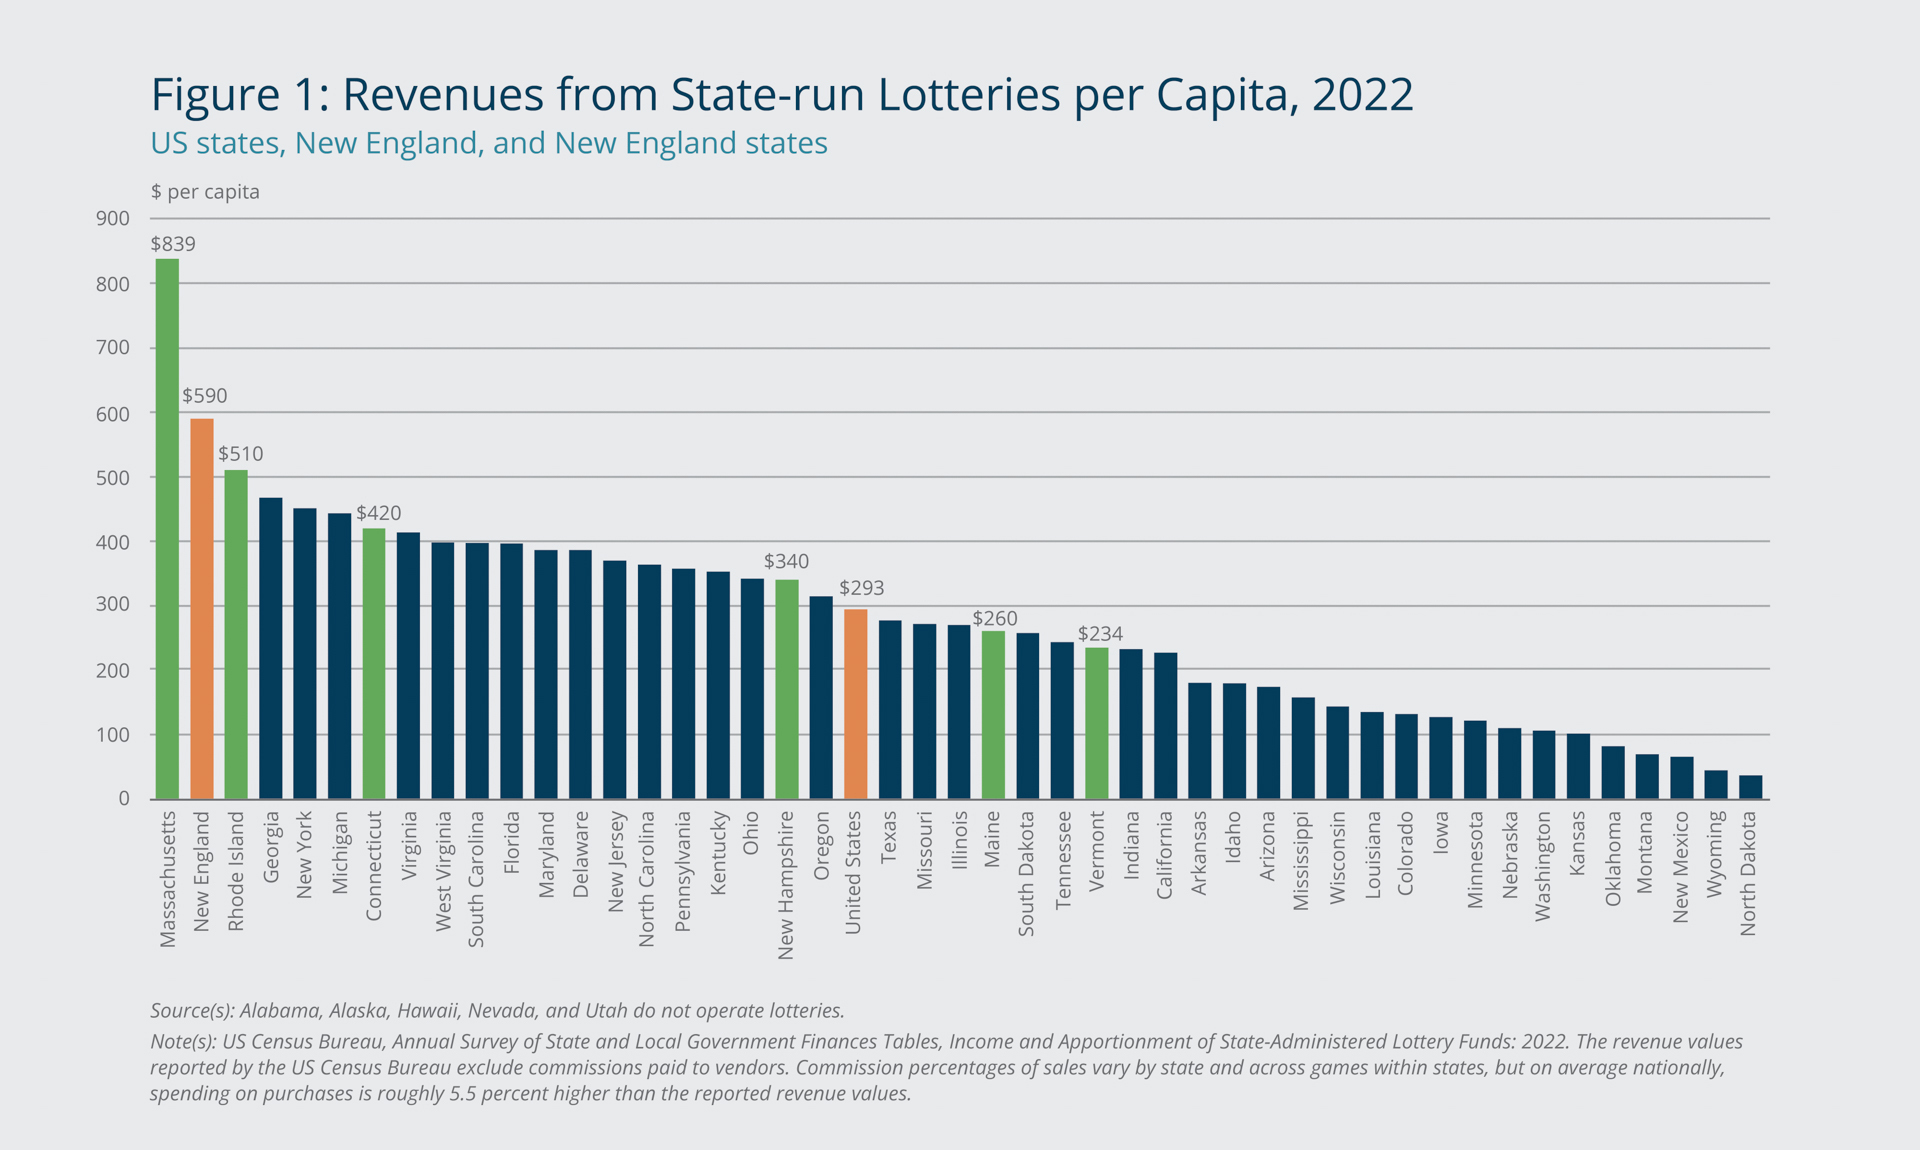
New England states, particularly Massachusetts and Rhode Island, exhibit remarkably high per capita spending on lottery purchases relative to the national average. In 2022, Massachusetts residents spent an average of $839 per person on the state’s lottery tickets, significantly outpacing the national average of $293, as shown in Figure 1. (Note that a person does not have to be a resident of a state to make a lottery purchase in that state; therefore, it is not completely accurate to assign all the lottery spending in Massachusetts to residents of the state.) The per capita amount does not take into account that individuals under 18 cannot legally make lottery purchases. Furthermore, a substantial portion of the population 18 and older does not participate in lottery games, so the per capita spending among those who play the lottery is likely far greater than $839.
Federal Reserve Bank of Boston
Participation in state lottery games varies across age groups, genders, and income levels (Barnes 2011). Although higher income might contribute to increased disposable income available for lottery purchases, in Massachusetts, lottery spending typically is greater in lower-income areas, suggesting that even in relatively affluent states, some demographic groups are more inclined than others to participate in lotteries.3 This trend suggests that complex socioeconomic factors beyond the scope of this brief influence lottery participation.
In Massachusetts and the two other southern New England states, where per capita spending far exceeds the national average, understanding who participates in the lottery can be particularly important. While lotteries generate revenue that is crucial for funding municipal aid, education, and other public services, the funding model carries ethical and financial implications if it relies on spending by lower-income individuals.
Lottery Spending Relative to Income Is Higher in New England
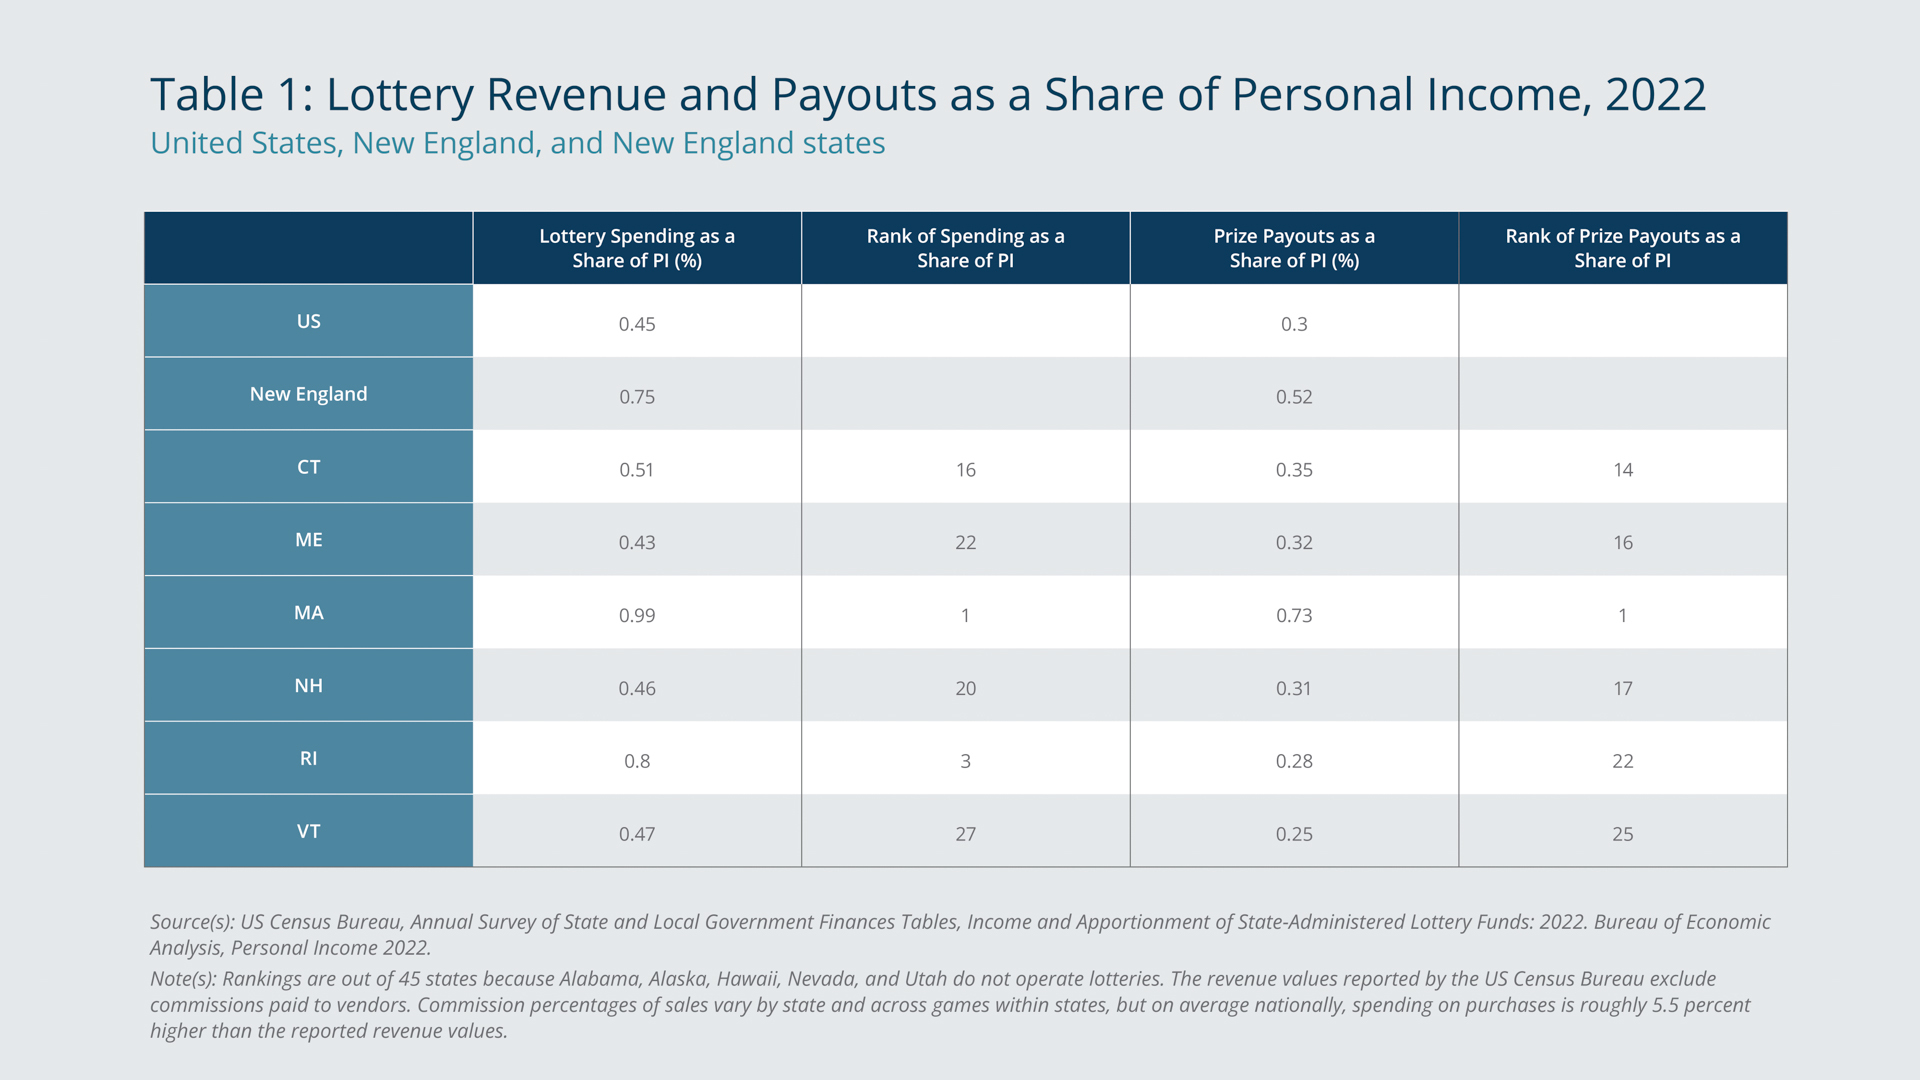
Lottery spending as a share of personal income is notably higher in certain states, particularly Massachusetts, where residents spent 0.99 percent of their personal income on lottery games in 2022. (Note that this calculation does not account for Massachusetts lottery sales to residents of other states or spending by Massachusetts residents on other states’ lotteries.) It was the highest rate in the country and more than double the national average of 0.45 percent (Table 1). The rate for all of New England was 0.75 percent.
Federal Reserve Bank of Boston
Relative to lottery spending, prize payouts represented a substantially smaller share of personal income both regionally and nationally—about one-third smaller in each case. The New England share was 0.52 percent, and the national share was 0.30 percent. The Massachusetts share was the highest in the country at 0.73 percent.
The New England states collectively paid out $6.2 billion in prizes from $8.9 billion in lottery sales in 2022. Rhode Island, which ranked third nationally in spending as a share of personal income (0.80 percent) and 22nd in payouts as a share of personal income (0.28 percent), experienced the nation’s highest per capita loss from lottery purchases, $330, in 2022. The gap between spending and prizes results in more proceeds to fund the designated uses of the lottery, but the losses from spending are concentrated among the most frequent players, and the distribution of winnings is uneven, with a small number of players receiving large payouts while the majority experience losses (Abrams and Garibaldi 2010).
A History of Supplementing Education and Municipal Funding
New Hampshire established the first modern state lottery in 1964, primarily to fund education without raising property taxes. Other New England states soon adopted this model. The first was Massachusetts, in 1971. It became a leader in lottery sales by introducing instant-win scratch tickets. In Massachusetts, lottery proceeds benefit local aid to cities and towns. Maine launched its lottery in 1974; proceeds support the state’s general fund, which finances various public services. Rhode Island, which established its lottery in 1974, also allocates the proceeds to the state’s general fund. Vermont launched its lottery in 1978, and similarly to New Hampshire, it uses the proceeds to help fund the state’s education system. Connecticut introduced its lottery in 1972; proceeds support the state’s general fund, which finances public services including education.
Federal Reserve Bank of Boston
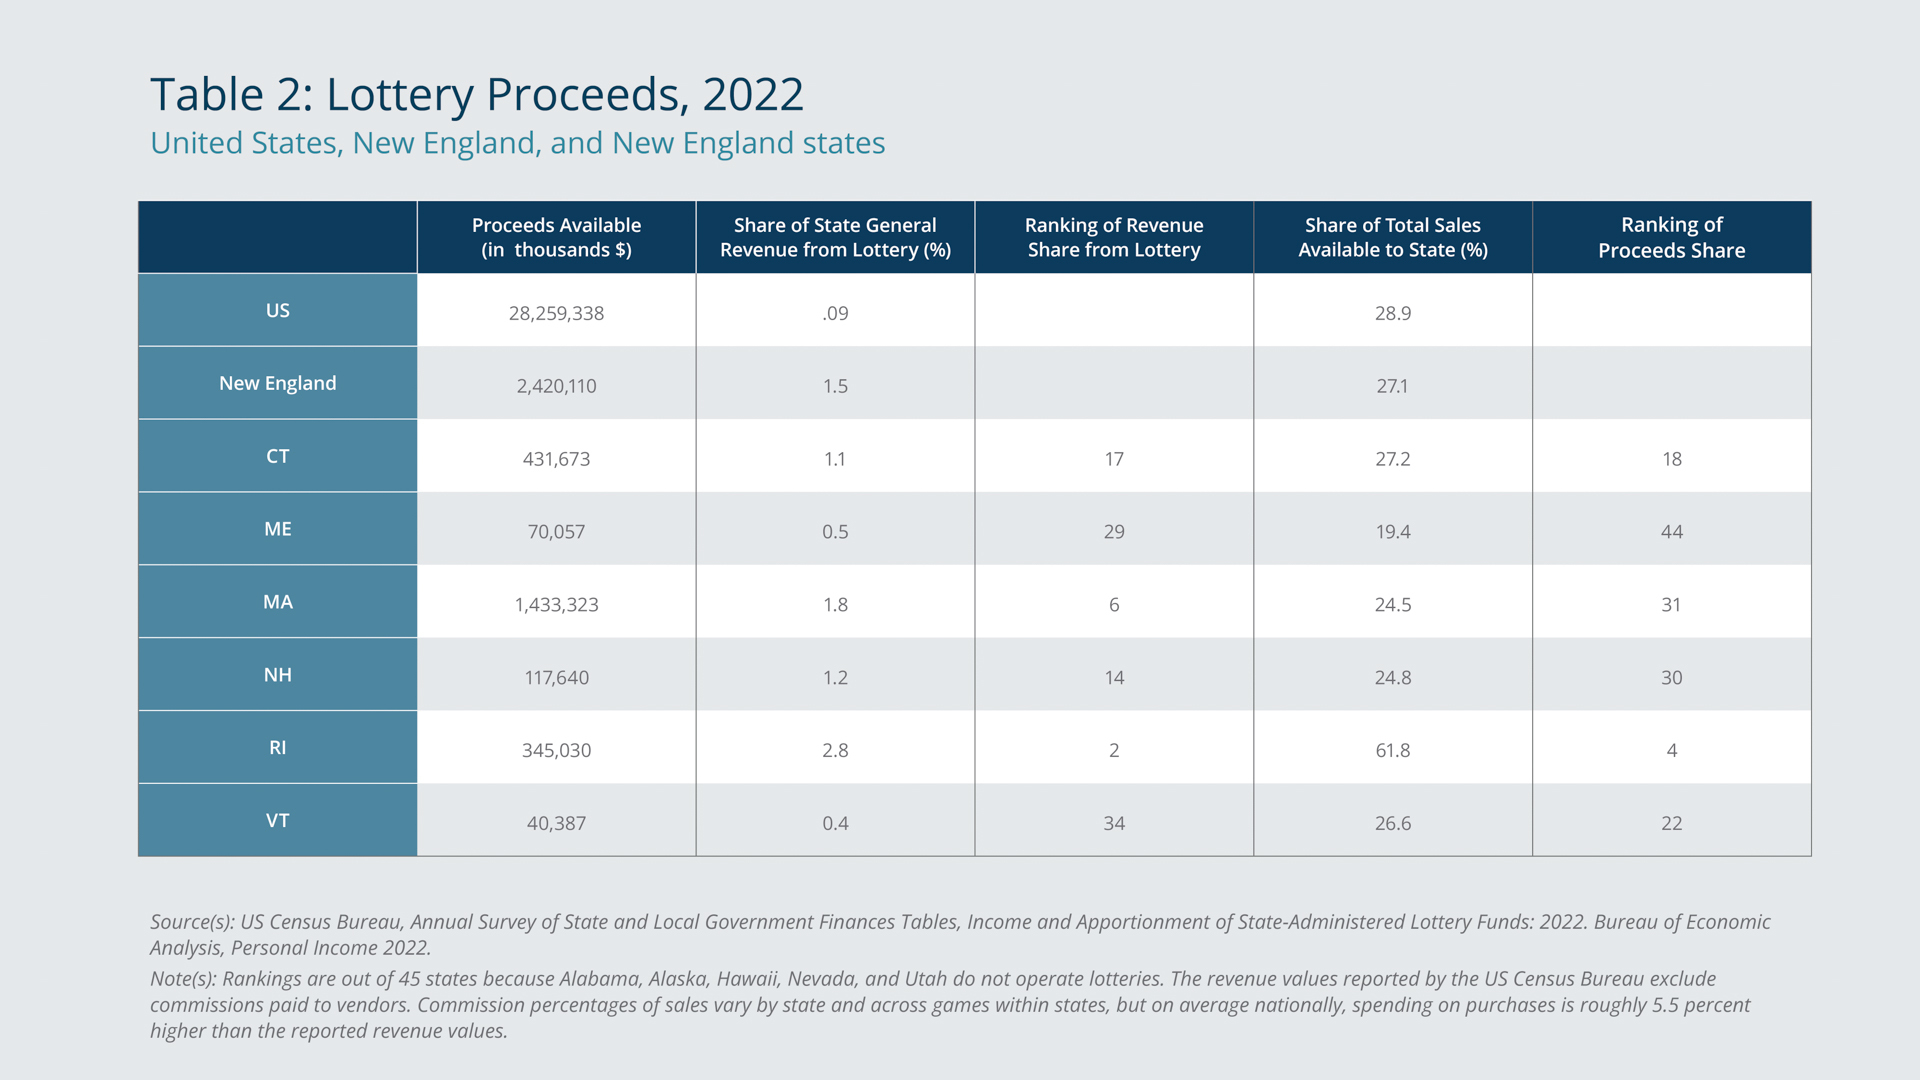
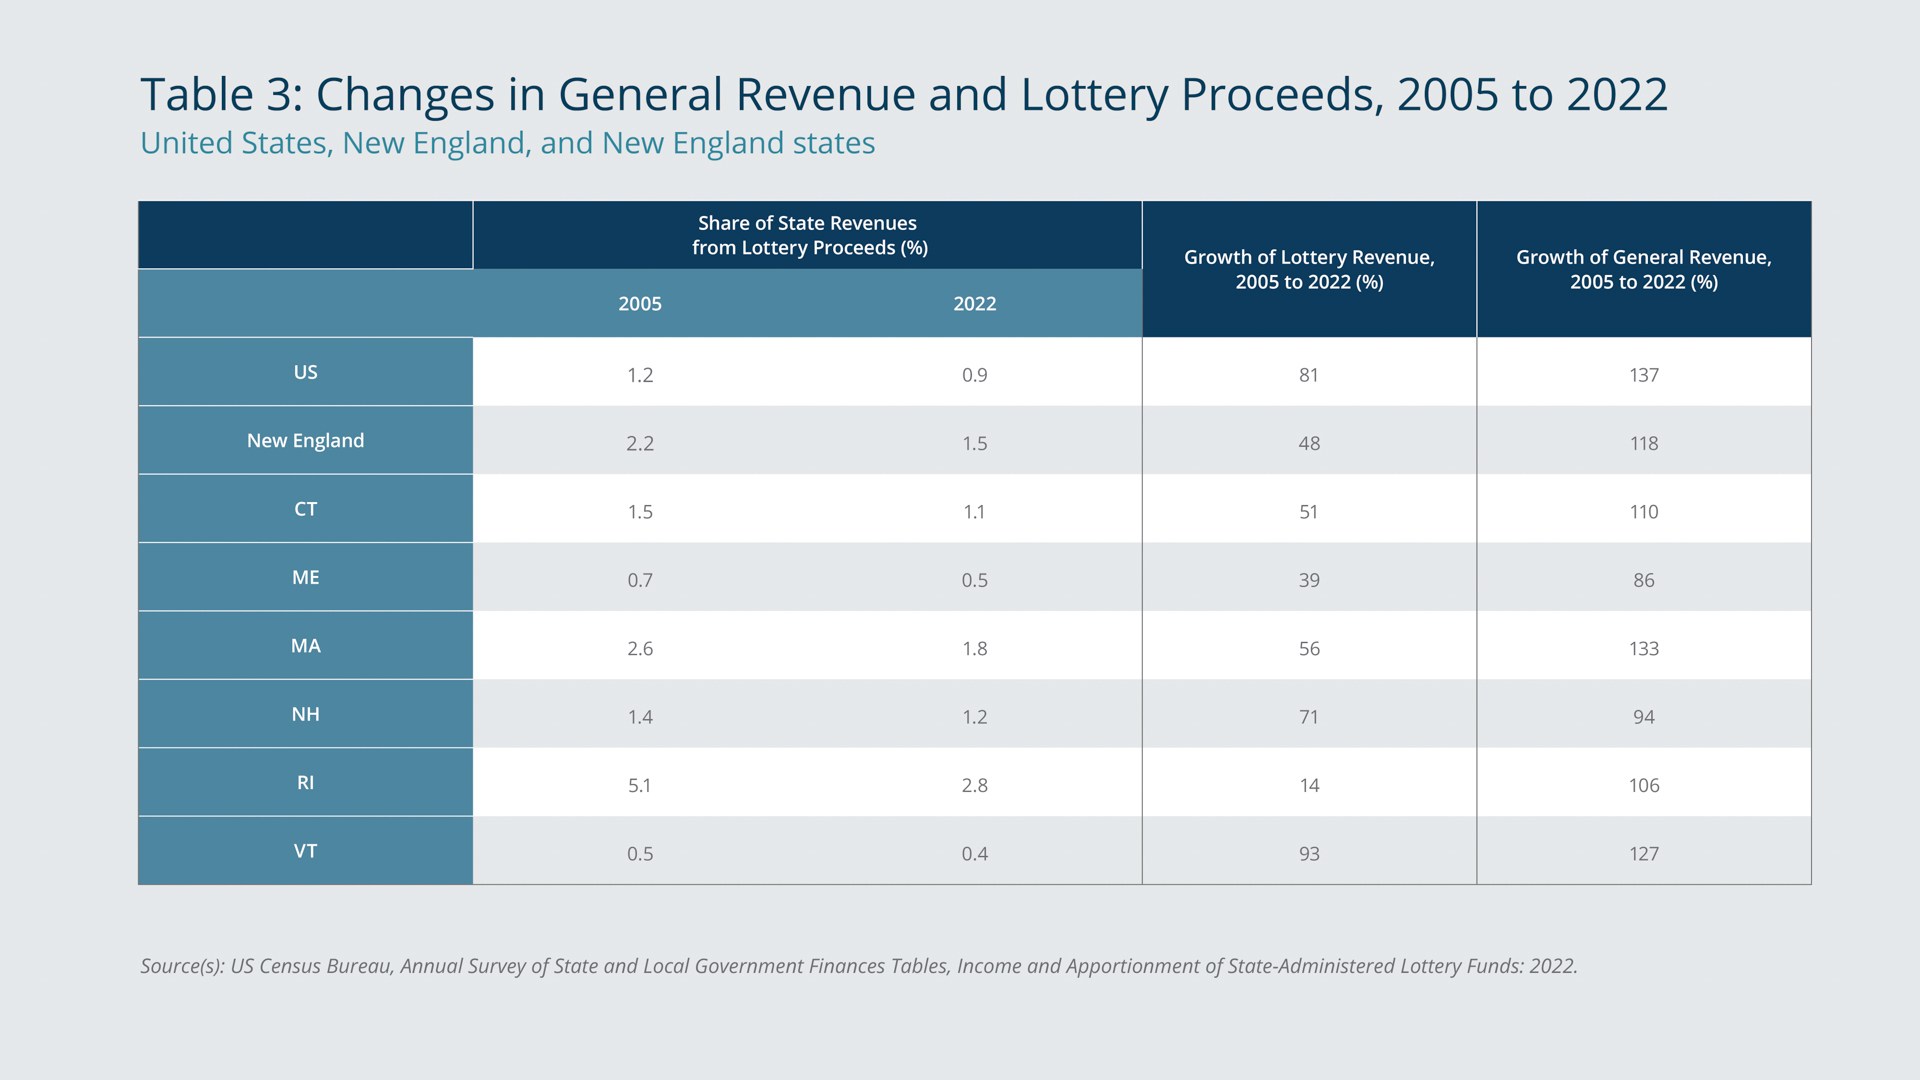
For fiscal year 2022, the New England states collectively retained $2.4 billion in proceeds from their respective state lotteries. That total amounted to about 1.5 percent of the region’s general state revenues. Among the New England states, Rhode Island’s lottery proceeds represented the largest share of general revenue, 2.8 percent, which aligns with the state having the region’s highest retention of total sales, nearly 62 percent (Table 2).
Federal Reserve Bank of Boston
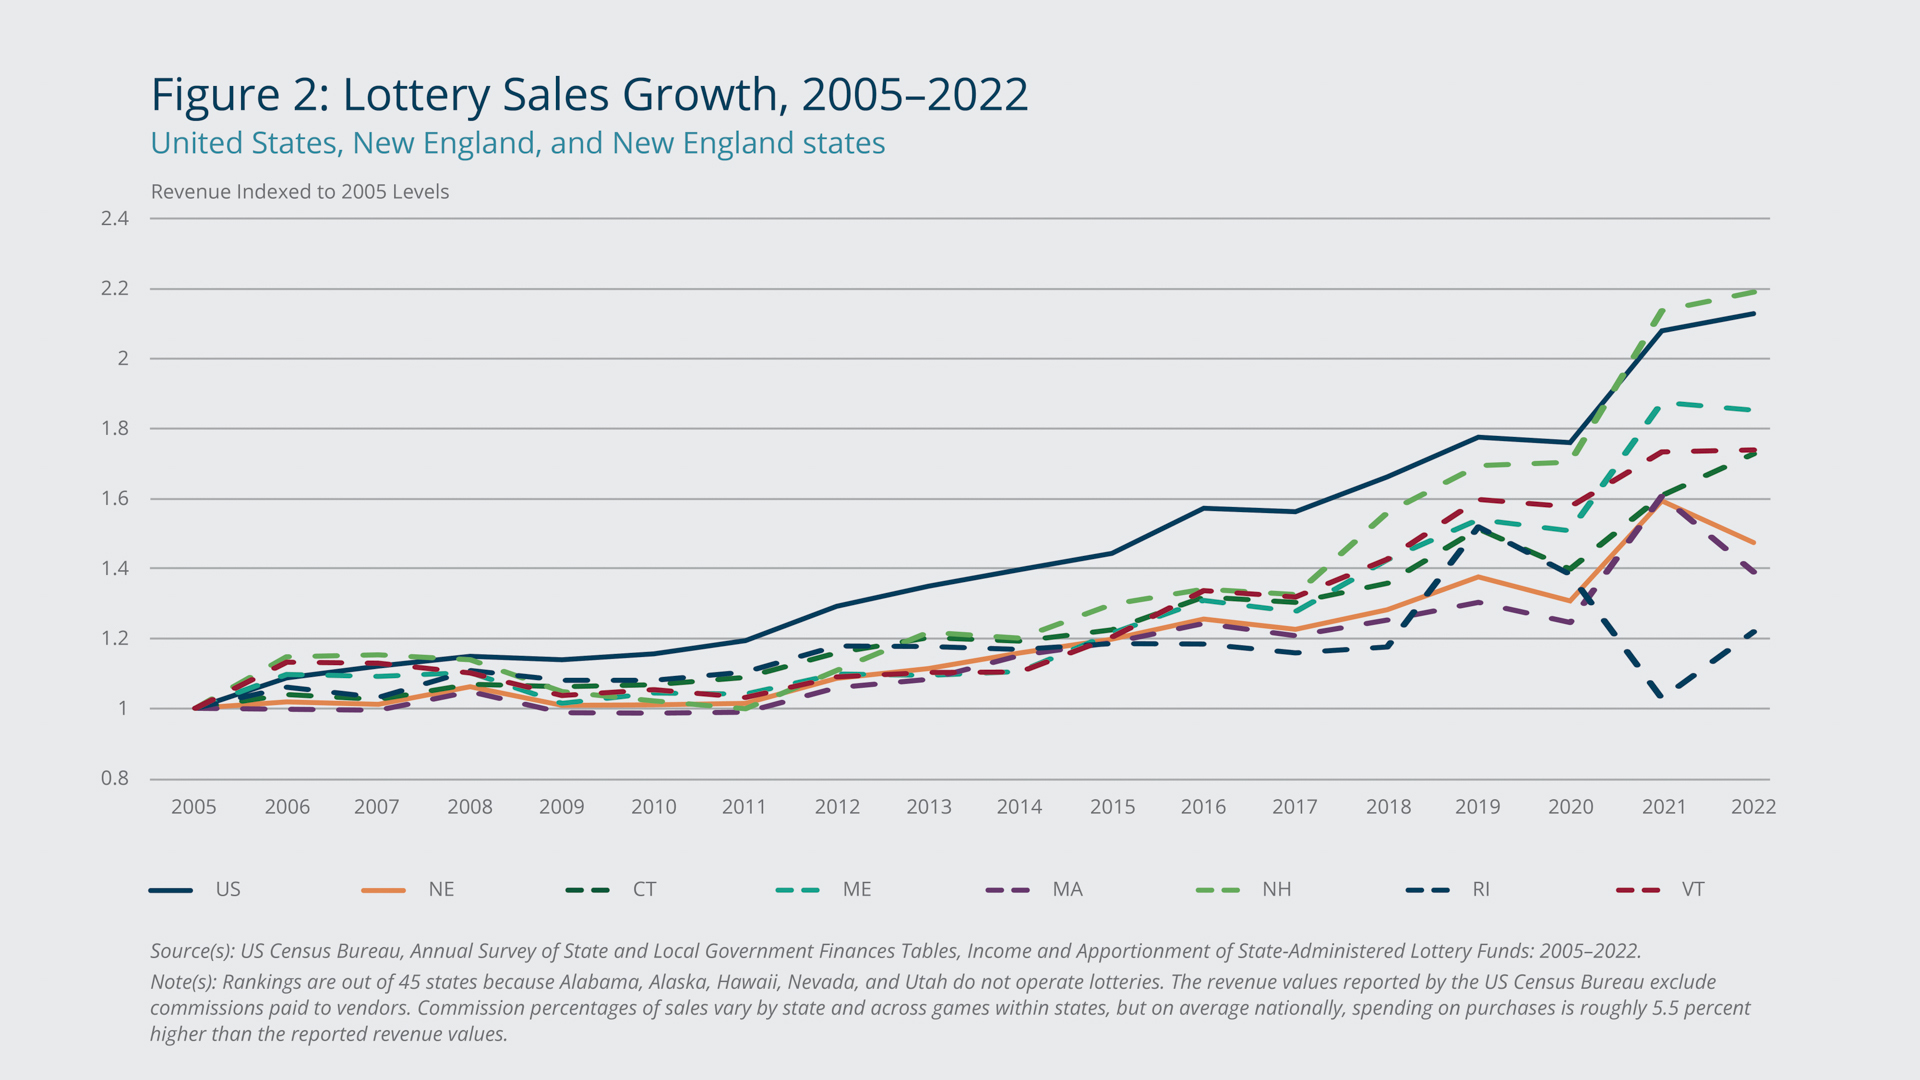
Figure 2 illustrates the overall growth in lottery sales in each New England state since 2005, including spikes and dips in recent years. Despite the high volume of sales in the region, the rate of growth has trailed the national rate significantly. The gap is only partially attributable to the introduction of lotteries in three states outside New England (Arkansas in 2009, Wyoming in 2013, and Mississippi in 2019). A fuller explanation may involve the higher rates of population growth in the rest of the country over the past two decades that have created more potential customers for the lotteries in those states. In New England, New Hampshire’s lottery sales have soared while Rhode Island’s sales growth has been modest, especially after declining sharply from 2019 to 2021. Nevertheless, per capita spending on lottery purchases in Rhode Island has continued to far exceed New Hampshire’s per capita spending.
Other Revenue Streams Growing Faster than Lottery Sales
As Figure 2 illustrates, lottery sales have grown, but since 2005, general revenues have grown faster than lottery revenues in many states, as shown in Table 3. As general revenues grow, states become less reliant on lottery funds, though as noted, lotteries generate less than 3 percent of state revenues in each New England state.
Federal Reserve Bank of Boston
A lower reliance on lottery revenue may shield states from the effects of changes in economic conditions, consumer behavior, and the gaming market, all of which can cause fluctuations in lottery sales (Dadayan 2016). States often see an initial surge in revenue following the launch of a lottery, but a surge typically is followed by a plateau or decline as the novelty diminishes. This “boredom” factor necessitates constant innovation in lottery games to sustain interest and revenue (National Gambling Impact Study Commission 1999). Lottery revenue also can be affected positively by economic downturns, during which sales often increase as people seek quick financial relief.4
Compared with states in other regions, the New England states have shown a strong commitment to using lottery revenues for education and public services. However, the region’s states have not maintained lottery revenue growth amid broader changes. As a result, that growth trails growth in expenses associated with the services that lottery revenues fund. Supplementing the lottery proceeds that fund education and municipal aid therefore may be necessary to keep pace with spending.5
Lotteries Are No Longer the Only Legal Gaming Option
State-run lotteries face uncertainties in the coming years, including those involving the expansion of legalized sports betting and new technologies that increase access to lottery tickets. Legalized sports betting presents an alternative form of gambling that could draw players away from state lotteries, reducing the revenue they generate. However, legalized sports betting can bring in substantial tax revenue for states. In Massachusetts, tax revenue from sports betting for the first year it was legal nearly doubled projections: $108 million realized versus $60 million projected. In some states, though, the allocation of sports betting revenue differs from lottery revenue allocation, so substitution away from playing lotteries to betting on sports may adversely affect funding of the programs supported by lottery revenue.6, 7
The introduction of apps such as Jackpocket that enable the purchase of lottery tickets via smartphones likely will boost lottery revenues, initially at least. These apps increase the accessibility of lottery games, potentially broadening the customer base and boosting sales. However, policymakers may need to balance the benefits of increased access with the risks of oversaturation and the potential for an increase in gambling disorder (or, compulsive gambling).
In New England, where lottery spending is notably high, policymakers should closely monitor these developments. Massachusetts is exploring online lottery options, looking to other states for guidance on implementation and regulation.8 The region’s reliance on lottery revenues for funding public services, particularly education, means that any significant changes in lottery participation could have substantial implications, even though lottery revenues account for relatively small shares of the states’ budgets. The New England states may need to adopt innovative strategies to sustain lottery revenues in the face of these developments, or they may have to adjust how education and municipal aid are funded.
Endnotes
- See Chloe Courtney Bohl, “Lottery Revenues Are at an All-time High. Here’s Where the Money’s Going,” Boston.com, June 27, 2023. https://www.boston.com/news/local-news/2023/07/27/massachusetts-lottery-revenues-all-time-high/
- See “NH Lottery Surpasses $631 Million in Total Sales,” New Hampshire Lottery press release, August 20, 2024. https://www.nhlottery.com/About-Us/Lottery-News
- See Lisa Creamer, Jeff Kelly Lowenstein, and Daigo Fujiwara, “See How Much Money Your Town or City Gives, and Gets from, the Lottery,” WBUR, November 20, 2018. https://www.wbur.org/news/2018/11/20/state-lottery-funds-map-winners-losers
- See Ross Cristantiello, “How the Modern Lottery Was Born, and Fine-tuned, in New England,” Boston.com, June 8, 2023. https://www.boston.com/news/off-beat/2023/06/08/lottery-history-new-england-massachusetts-new-hampshire/
- For example, US Census data for the New England states indicate that average annual state and local education expenditures increased 3.1 percent from 2005 to 2021, while lottery revenues rose 2.6 percent during the same period.
- See Steph Solis, “Massachusetts Sports Betting Market Blew Past Tax Revenue Projections in First Year,” Axios Boston, February 27, 2024. https://www.axios.com/local/boston/2024/02/27/sports-betting-massachusetts-tax-revenuehttps://www.axios.com/local/boston/2024/02/27/sports-betting-massachusetts-tax-revenue
- In 2018, the US Supreme Court struck down a federal ban on sports betting, which unleashed a flurry of activity across states to establish regulations and create funding streams. In Connecticut, a 13.75 percent tax goes entirely to the state general fund. In Maine, revenue from a 10 percent tax is allocated mostly to the general fund but also to gambling addiction prevention, the state racing commission, and the agricultural fair promotion fund. Massachusetts has a 15 percent tax on retail wagering meaning in-person and a 20 percent tax on mobile wagering. Revenue from those taxes is allocated to the general fund (45 percent), local aid (27.5 percent), workforce investment (17.5 percent), public health (9 percent), and youth development (1 percent). New Hampshire has a 50 percent retail tax and 51 percent online tax that are nearly entirely dedicated to funding the state’s education trust fund, similarly to the state lottery. Revenue from Rhode Island’s 51 percent tax go entirely to the general fund. Vermont has platform-specific taxes ranging from 31 percent (on bets placed with DraftKings or Fanatics) to 33 percent (on bets placed with FanDuel). Some money from those taxes support gambling disorder programs, and the vast majority goes into the state general fund. For more information, see Andrea Jimenez, “March Madness Brings on the Bets,” National Council of State Legislators, March 22, 2024. https://www.ncsl.org/fiscal/march-madness-brings-on-the-bets
- See Rebecca Pereira, “Mass. Lottery Looks to Other States for Path Forward Online,” WBGH, August 16, 2024. https://www.wgbh.org/news/local/2024-08-16/mass-lottery-looks-to-other-states-for-path-forward-online
Data Sources
This brief relies on the Annual Survey of State Government Finances of the US Census Bureau. The survey covers the 50 state governments as well as all dependent state-level governmental entities. The Annual Survey of State Government Finances provides a comprehensive summary of the annual survey findings for state governments, as well as data for individual states. The tables contain information on revenue by source, expenditure by object and function, indebtedness by term, and assets by purpose.
Reporting of government finances by the US Census Bureau involves the presentation of data in terms of uniform categories. Financial items of the same kind are merged. For example, expenditure amounts for a similar purpose are combined, regardless of the amount of government funds involved. The statistics reflect state government fiscal years, which, for all six New England states, end on June 30.
For further information on what is measured and how data are classified, consult the Government Finance and Employment Classification Manual, https://www2.census.gov/govs/class/classfull.pdf.
References
Abrams, Aaron, and Skip Garibaldi. 2010. “Finding Good Bets in the Lottery, and Why You Shouldn’t Take Them.” The American Mathematical Monthly 117(1): 3–26. https://doi.org/10.4169/000298910X474952
Dadayan, Lucy. 2016. “State Revenues from Gambling: Short-term Relief, Long-term Disappointment.” Rockefeller Institute of Government. https://rockinst.org/issue-area/state-revenues-gambling-short-term-relief-long-term-disappointment/
Barnes, Grace M., John W. Welte, Marie-Cecile O. Tidwell, and Joseph H. Hoffman. 2011. “Gambling on the Lottery: Sociodemographic Correlates across the Lifespan.” Journal of Gambling Studies 27: 575–586. https://link.springer.com/article/10.1007/s10899-010-9228-7
National Gambling Impact Study Commission. 1999. “Final Report.” US Department of Justice. https://www.ojp.gov/ncjrs/virtual-library/abstracts/national-gambling-impact-study-commission-final-report

 About the Authors
Riley Sullivan,
Federal Reserve Bank of Boston
Riley Sullivan is a senior policy analyst with the New England Public Policy Center in the Federal Reserve Bank of Boston Research Department.
Email: riley.sullivan@bos.frb.org
Acknowledgments
Resources
Keywords
- New England ,
- NEPPC Regional Brief ,
- state-run lotteries ,
- lottery revenues ,
- lottery spending