Getting to Work in New England: Commuting Patterns across the Region 


Federal Reserve Bank of Boston
The views expressed herein are solely those of the authors and should not be reported as representing the views of the Federal Reserve Bank of Boston, the principals of the Board of Governors, or the Federal Reserve System.
Commuting is nearly ubiquitous across New England. Employers in cities and towns large and small depend on workers who commute from communities near and far. Communities, in turn, rely on employers located in cities and towns scattered in every direction to provide jobs for their residents. Workers may choose to live in a city other than where they work for a host of reasons, including housing and transportation options, school preferences, and work locations of a partner or spouse.
This Regional Brief analyzes data on current commuting patterns, using 2022 New England data primarily. While the COVID-19 pandemic created a substantial disruption to commuting behavior, the spatial relationships between home and work addresses that we observe in 2022 are remarkably similar to those of 2019, suggesting that the patterns described for New England in this brief are fairly stable over the short term and that effects of hybrid and remote work arrangements on the region’s workplace–residence landscape are subtle. Recent research also indicates existing “flexible work” arrangements are overwhelmingly hybrid, requiring considerable “on-site” presence, and that fully remote work arrangements have grown increasingly rare since the height of the pandemic, accounting for less than 12 percent of workers employed by firms as of 2022 (Barrero, Bloom, and Davis 2023).
Sign up for new research and data on the New England economy.
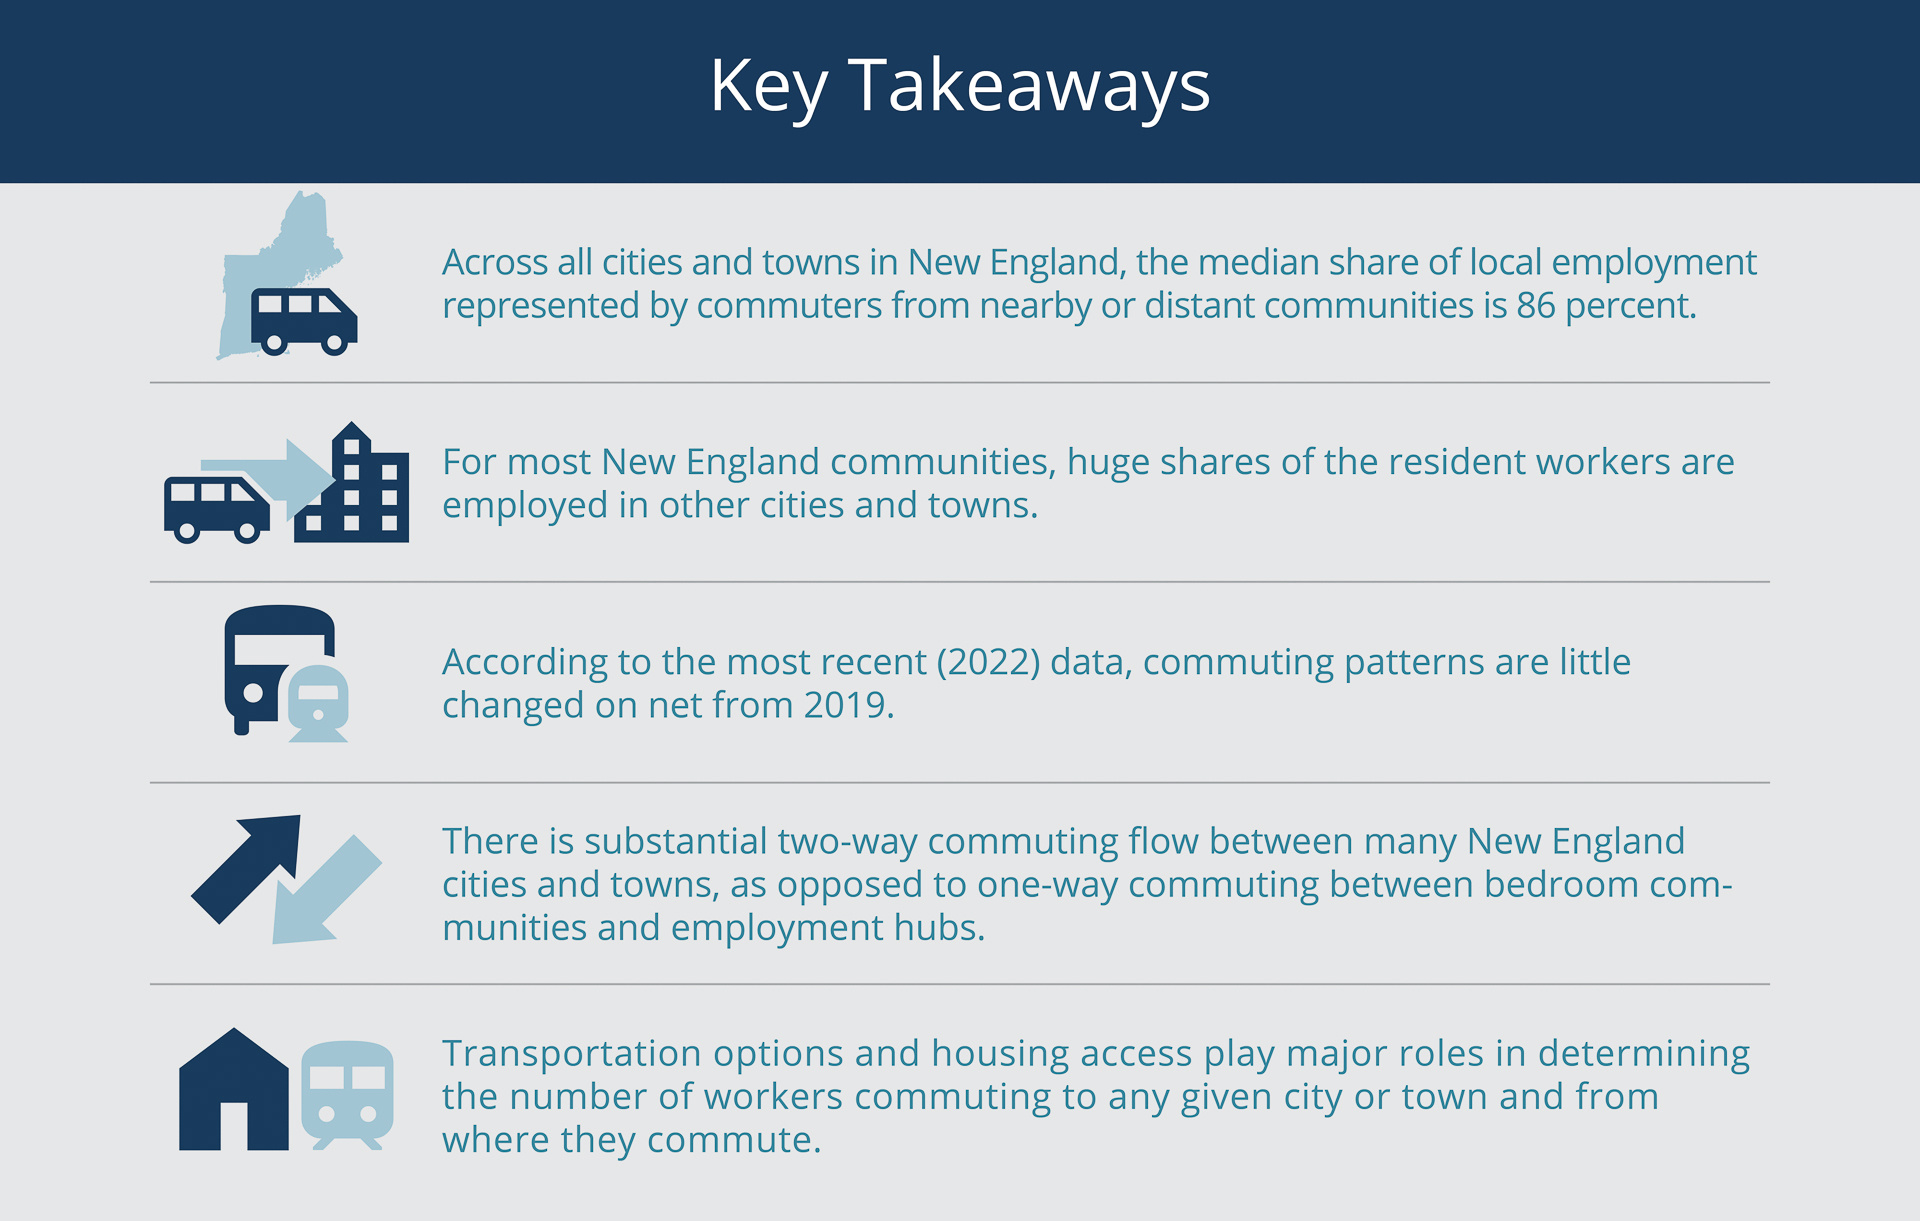
We find that across all cities and towns in New England, the median share of local workers who commute from another community (referred to in this report as the “commute share”) is 86 percent, and a huge share of nearly every New England city and town’s residents work in communities other than the one in which they live (the “export share”). We also find that the geographic distribution of commuting behavior is complex; it is not as simple as so-called bedroom communities sending all their workers to the nearest major employment hub. Instead, there is substantial two-way commuting flow between many cities and towns and considerable variation across cities and towns in the extent to which they attract local and nearby workers. Lastly, we highlight how transportation options and housing access play major roles in determining the number of workers commuting to any given city or town and from where they commute.
For our analysis, we rely primarily on data from the US Census Bureau’s Longitudinal Employer–Household Dynamics (LEHD) program, which publishes public use data on employers and households that link home addresses and work addresses. This data, known as LEHD Origin-Destination Data (LODES), uses administrative records to produce counts of flows between census blocks, which can be aggregated up to larger units such as county subdivisions. We examine data for 1,567 county subdivisions in New England. In much of the region, the country subdivisions are synonymous with cities and towns; however, in more sparsely populated areas of northern New England, they include townships, gores, and census-designated places. Our analysis includes only county subdivisions containing identifiable places of employment. Some remote county subdivisions have no employers, and some have no population.1
Nearly Every Worker in New England Commutes
Among the nearly 1,600 county subdivisions in our study, the median share of resident workers who are employed in another subdivision (out-commuters) is 93 percent. The median county subdivision in New England is home to 1,017 residents who work, and on average, 892 of them are out-commuters. In nearly 9 percent of the county subdivisions in New England, 100 percent of the resident workers are out-commuters, though those subdivisions tend to be small, serving as home to 60 working individuals on average.
The Massachusetts cities of Revere and Brookline have the region’s highest out-commuter percentages among municipalities with at least 25,000 resident workers. Both cities abut Boston and export nearly 95 percent of their resident workers. Many of the county subdivisions exporting a higher-than-average share of their residents are home to fewer than 1,000 employed residents; however, some surpass 5,000 employed residents. The Connecticut town of Ansonia and the Massachusetts towns of Hanson, Holbrook, Sharon, Whitman, and Wayland each export more than 95 percent of their 5,000-plus employed residents. These are, without exception, modestly sized communities in close proximity to major employment hubs.
There are extreme outliers on the low side of out-commuting as well, typically due to physical geography. For instance, Nantucket exports only 33 percent of its employed residents. Provincetown, at the tip of Cape Cod, and Bennington, in Vermont’s Green Mountains, are also constrained by geography. Consequently, each exports only about 44 percent of its employed residents to other communities.2
Major employment hubs, particularly those in rural areas, also tend to be low-side outliers among resident-worker exporters. Notable examples include Bangor, Maine, from which only 46 percent of resident workers commute; Pittsfield, Massachusetts, at 46 percent; Portland, Maine, at 52 percent; and Lebanon, New Hampshire, at 52 percent. Boston exports only 47 percent of its employed residents, a consequence of its exceptionally strong job market.
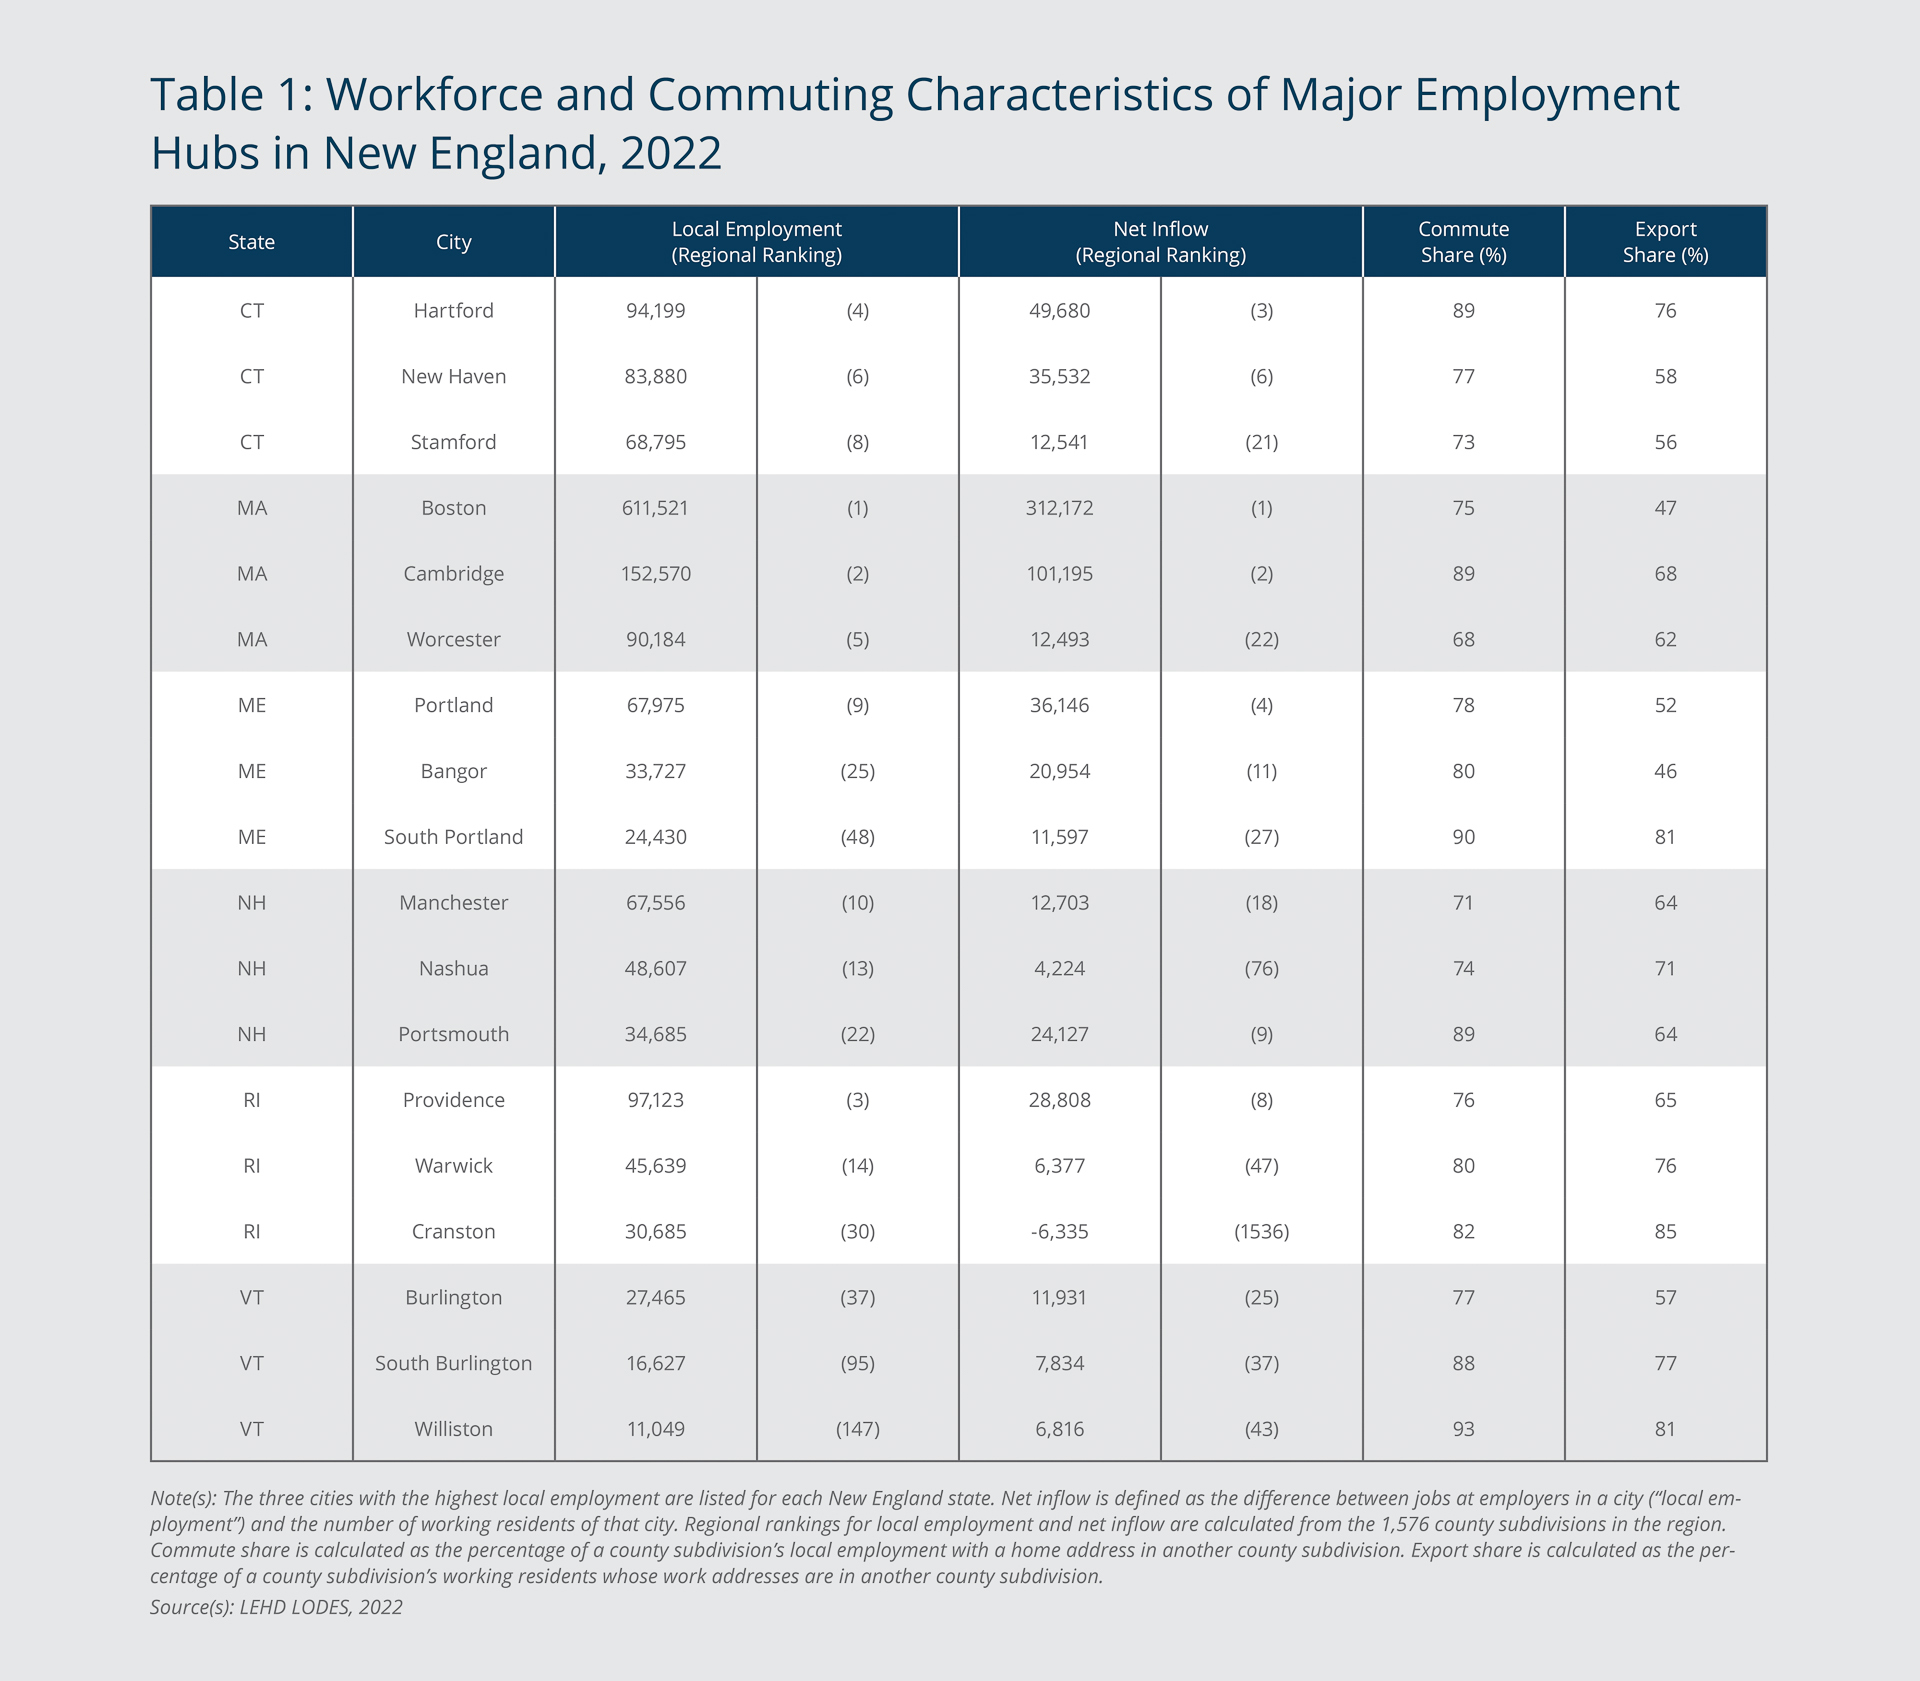
Looking at the extent to which local employers rely on in-commuters (workers from outside communities), we find that the median county subdivision sources 86 percent of its workers from elsewhere. This statistic, the commute share, is remarkably consistent across the region: The average commute share in the lowest quartile of communities is 72 percent, and in the third quartile it is 89 percent. Table 1 shows the commute share values for major cities in each New England state. Among the 34 municipalities in New England with local employment of at least 30,000 workers, the median commute share is 79 percent. The highest values among these communities belong to the Massachusetts communities of Andover, Burlington, and Woburn, each of which sources 93 percent or more of its workers from outside its boundaries.
Federal Reserve Bank of Boston
Low-commute-share outliers among these largest employment centers include the Massachusetts cities of Worcester (68 percent), Fall River (67 percent), and New Bedford (58 percent). Worcester’s low reliance on in-commuters is particularly noteworthy given that its local employment is the fifth highest in New England.
There is symmetry between towns that export smaller shares of their employed residents and those that are less reliant on in-commuters. Geographic constraints that limit the outflow of commuters (the export share) also affect the inflow (the commute share). Thus, Provincetown (18th lowest commute share and 6th lowest export share), Bennington (32nd, 8th), and Fort Kent (13th, 3rd), on Maine’s northern border with New Brunswick, for example, are among the New England county subdivisions with the lowest commute shares and the lowest export shares. Isolated hubs such as Pittsfield in Western Massachusetts (57 percent commute share) also tend to rely on workers from outside communities at relatively low rates.
Though the commute share varies across the region, virtually every city and town sources a large majority of its workforce from outside its boundaries. Commuting is therefore essential to the functioning of the region’s local labor markets.
Most New England Communities Are ‘Net Senders’
The largest net receivers of workforce—that is, the communities with the highest net inflows of workers—in New England include many of the region’s most prominent cities, as shown in Table 1, which lists the top three cities in each state by local employment. Boston has by far the largest employment level and the largest net inflow in the region. Regional hubs Portland, Providence, and Hartford each pull in far more workers than they export.
Several cities with net inflows of workers that are among the region’s highest do not have workforces that are among the largest. Instead, they are moderately sized cities with high regional importance. For example, Bangor, Maine, has the 25th largest workforce in the region and the 11th highest net inflow of workers, indicating its high level of importance to northern Maine. Similarly, Burlington, Vermont, punches above its weight with the 25th highest net inflow of workers and only the 37th largest workforce in New England. On the other hand, some major employment centers rank relatively low in net inflow of workers. As noted, Worcester is the fifth largest employer in the region, but it has only the 22nd highest net inflow of workers—largely due to the Greater Boston job market’s “pull,” a measure that we discuss later in this brief.
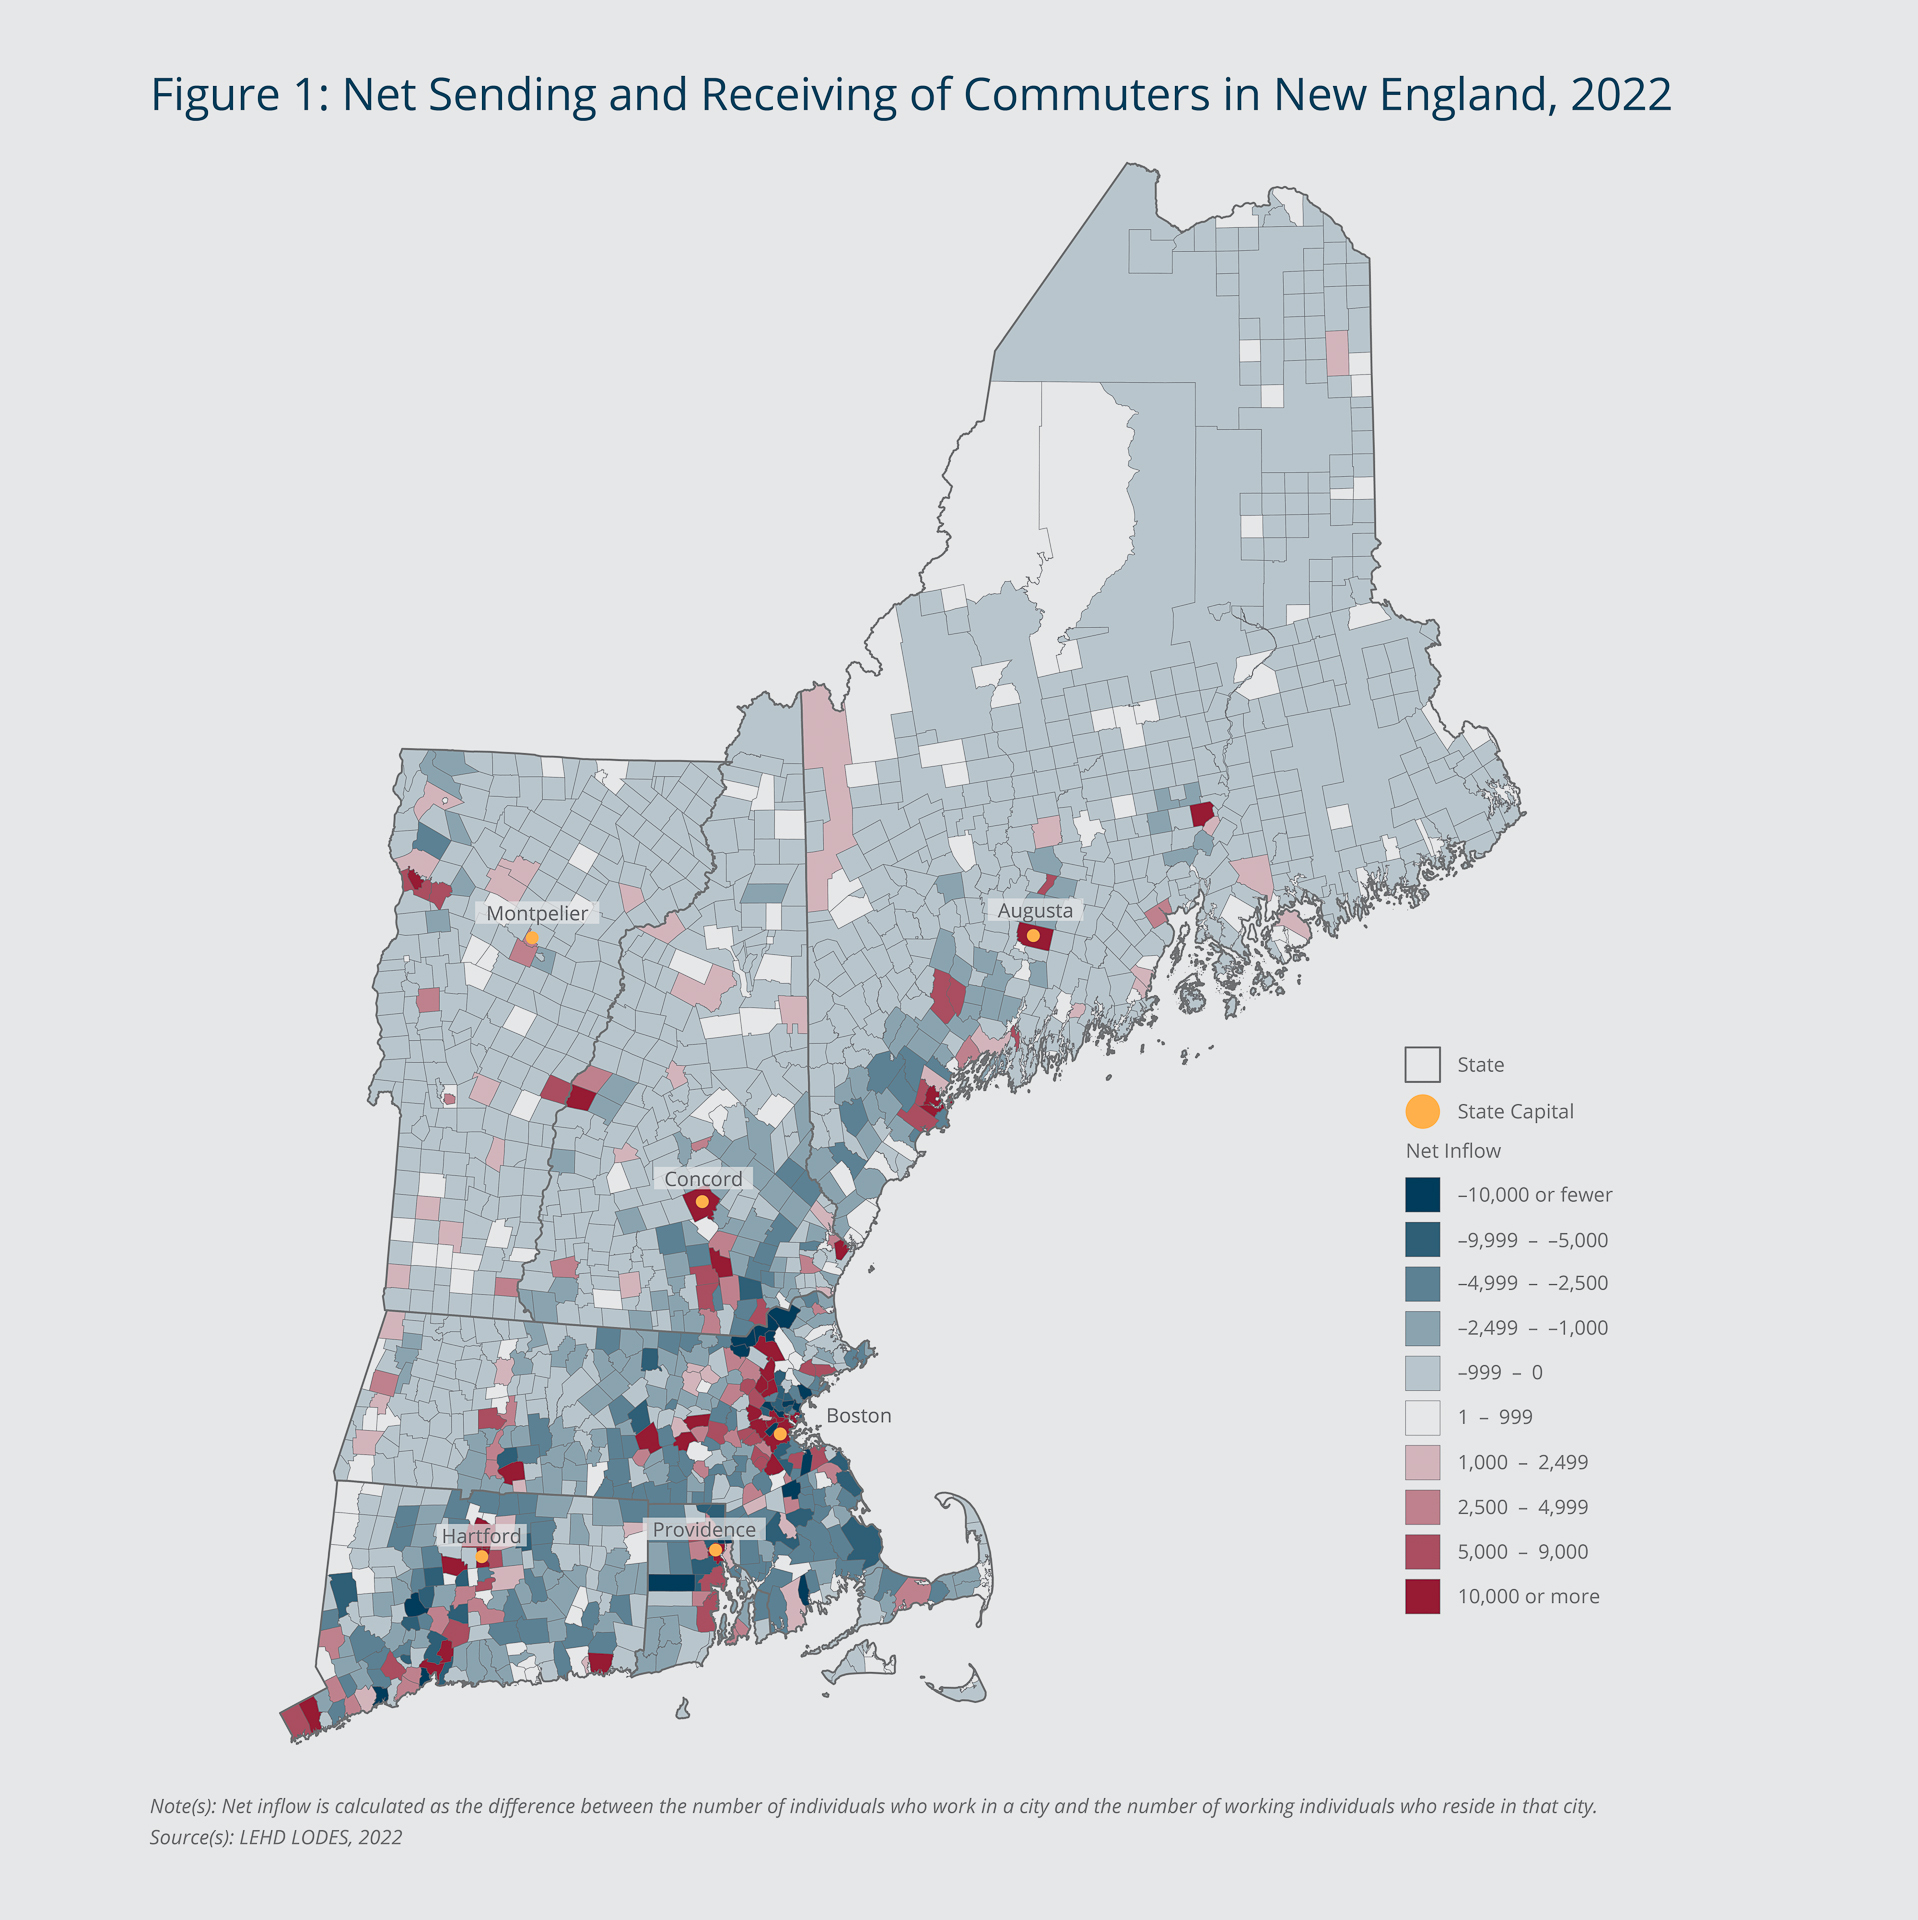
A large majority of New England communities have a greater outflow than inflow of workforce; that is, they are net senders. The median New England community is a net sender of 262 workers, as shown in Figure 1. Net senders, shown in shades of blue, account for nearly 81 percent of the cities and towns in the region. At the state level, the share of cities and towns that are net senders ranges from 74 percent in Rhode Island to 84 percent in Vermont. Among communities that are net senders, the median resident workforce (residents who are employed either in that community or elsewhere) is 808 and median local employment (of residents and in-commuters) is 278. Among the 55 communities that are net senders and have employed resident populations of at least 15,000, the median resident workforce is 24,842, and median local employment is 16,825.
Federal Reserve Bank of Boston
Although the median net sender is small, these communities are not necessarily small towns with weak labor markets. Notable net senders in the region include such prominent cities as Cranston, which has Rhode Island’s third largest local employment; Norwalk, which employ’s Connecticut’s fifth largest workforce; and Quincy, which employs Massachusetts’s eighth largest workforce. Each of those cities is a major employer and is located near one of New England’s largest cities. Cranston sends Providence nearly one-quarter of its resident workers, which is more than it contributes to its own workforce. Norwalk sends nearly 15 percent of its resident workers to Stamford, and Quincy sends 36 percent of its resident workers—more than twice the number who work locally—to Boston.
The Region’s Major Employment Hubs Have Large Footprints
Major employment hubs are a key component of the commuting structure in New England. Their footprints can be seen in Figure 1, where they are depicted in red, indicating high net inflows of commuters from surrounding communities. Some hubs, particularly in northern New England, are surrounded completely or almost completely by net-sender communities (depicted in pale blue). In southern New England, net receivers are clustered around Boston and along Interstate 84 in Connecticut and Interstate 95 in Rhode Island. Though the overall picture is complex, proximity is a key determinant of where a city sources its workers.
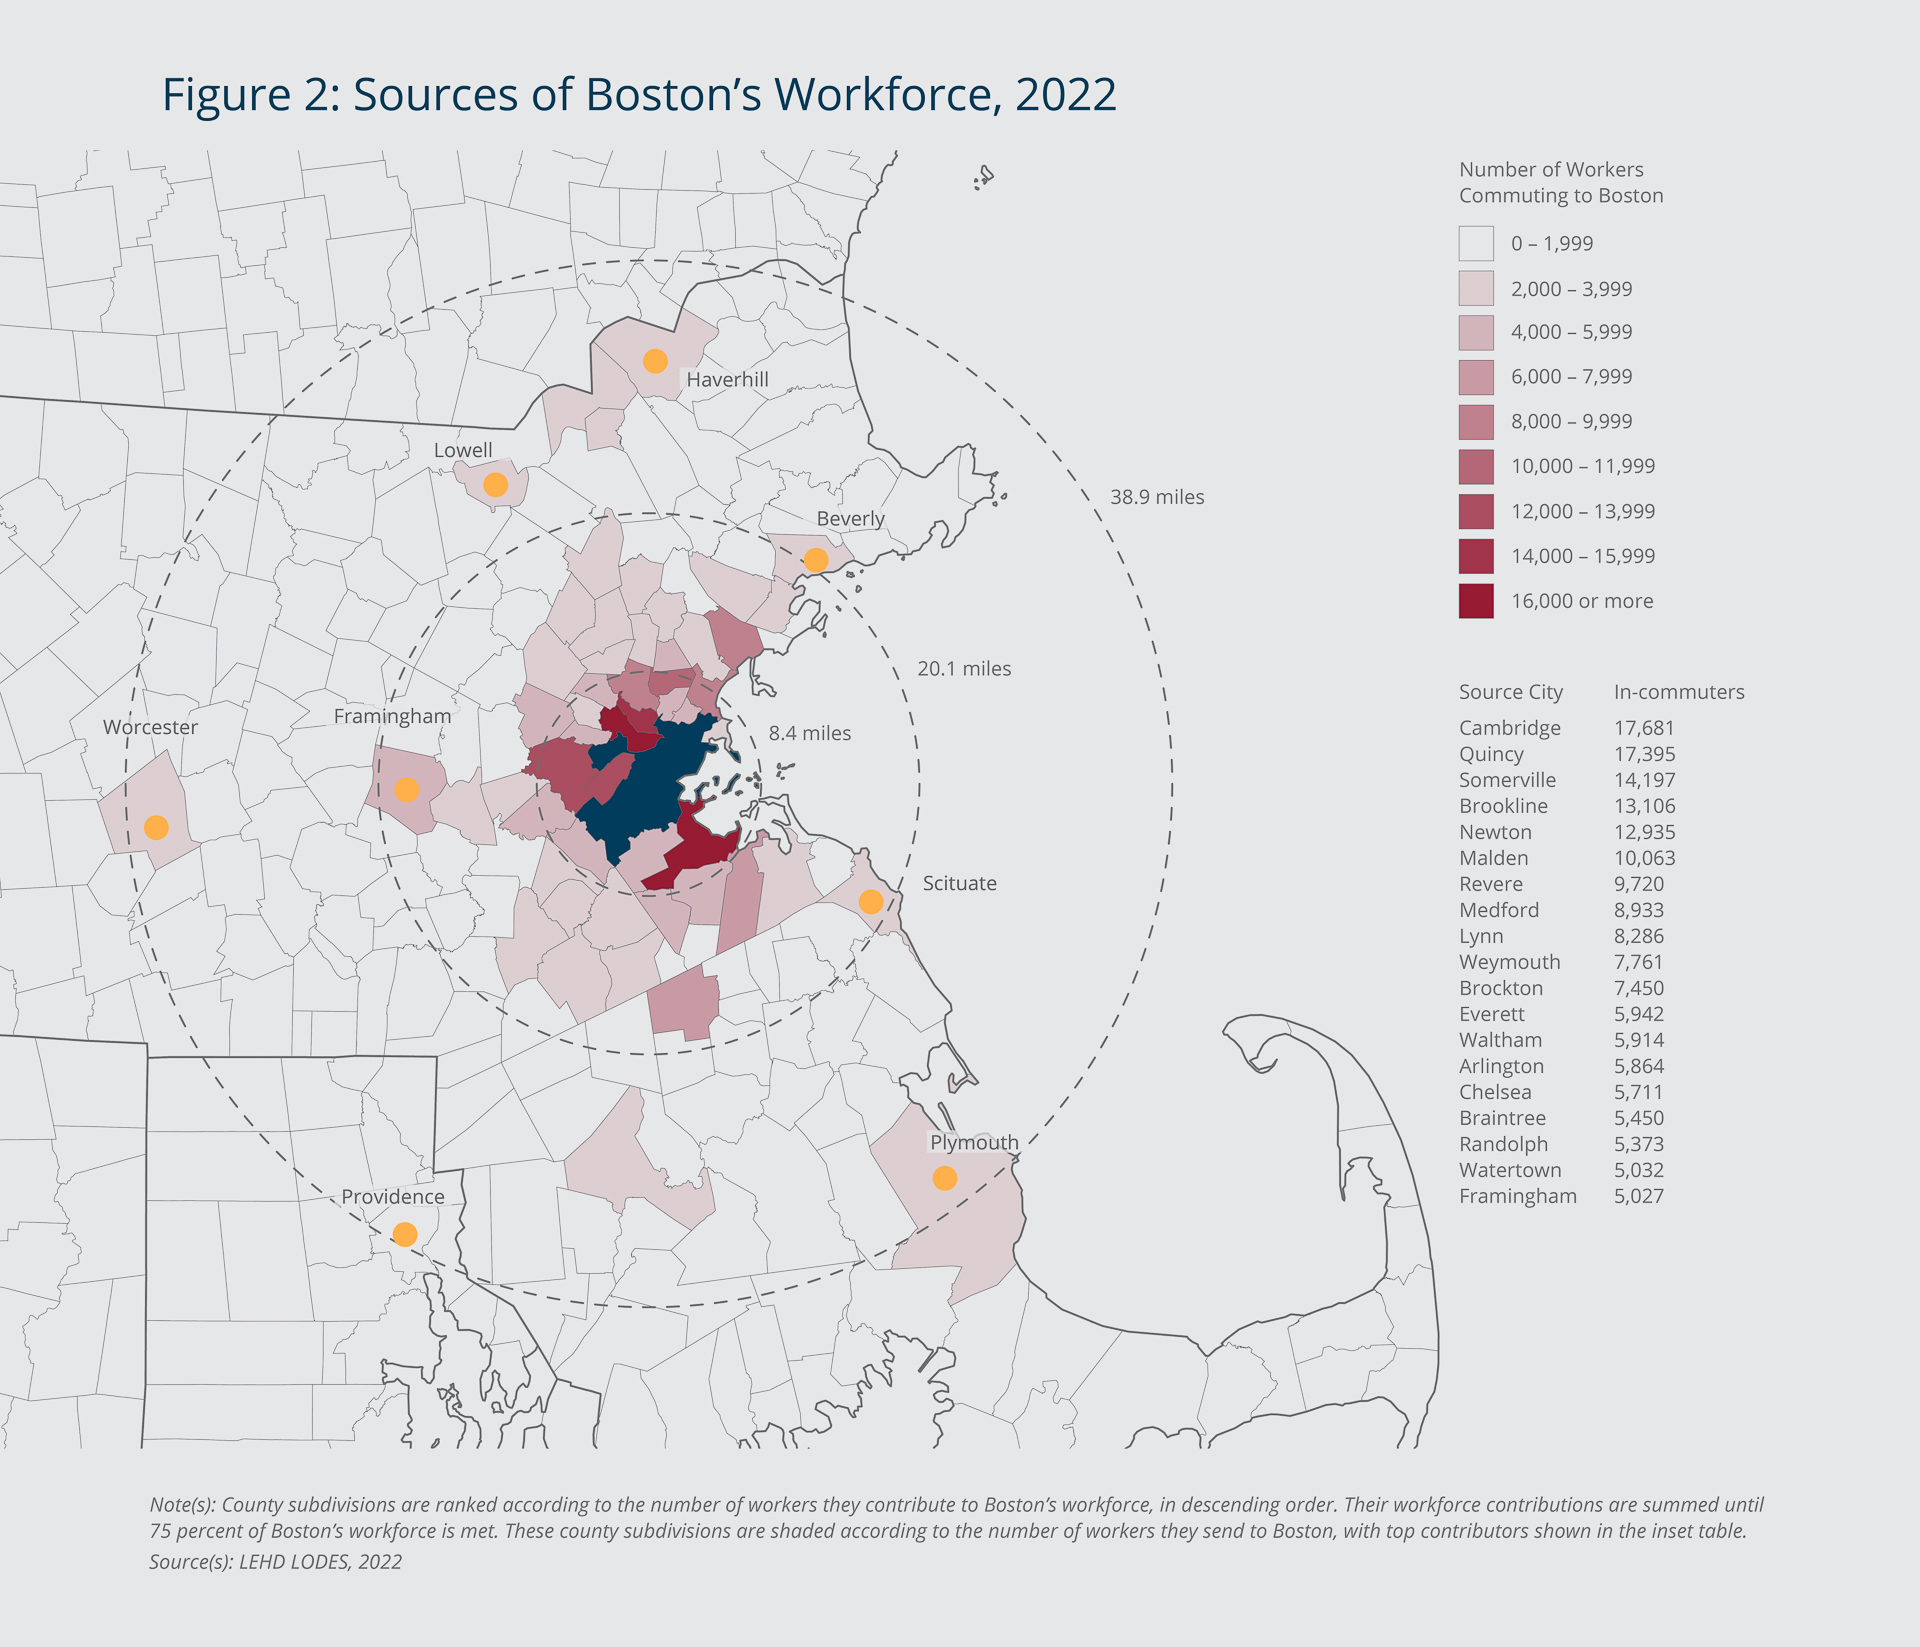
Figure 2 illustrates in more detail where the region’s largest employment center, Boston, sources its workforce. The figure highlights the 66 cities and towns that contribute 75 percent of Boston’s employment. The non-highlighted communities also contribute residents to the Boston workforce, but they send fewer workers than the communities marked in shades of red. The three rings overlaid on the map represent, respectively, the 50th (8.4 miles), 75th (20.1 miles), and 90th (38.9 miles) percentile commute distances for people who work in Boston. They are calculated as the straight-line, as-the-crow-flies distances between commuters’ home census block and the census block of their work address in Boston. They do not measure actual distance traveled via roads and rails or reflect travel time.
Federal Reserve Bank of Boston
The communities from which Boston sources the majority of its workers only loosely follow the pattern of concentric rings. Some relatively distant communities, including Worcester and Plymouth, are important sources of workers. Those two cities, due to their large populations and the existence of road and railway networks, contribute meaningfully to Boston’s workforce. Other communities that are much closer to Boston contribute too few workers to be highlighted on the map.
Boston sources many workers from within its own borders and is surrounded by densely populated communities. As the 50th percentile ring on the map indicates, half of the workers employed in Boston reside less than 8.4 miles from their workplace. This radius, when measured from the geographic center of Boston, includes the cities of Cambridge, Somerville, Brookline, and Quincy, among other major contributors. An additional 25 percent of the city’s workforce commutes from communities more than twice as far from Boston, 20.1 miles. That distance captures cities such as Framingham and Brockton. The substantial increase in distance between the median commute and the 75th percentile commute is above average for the region. The ratio of Boston’s 75th percentile commute distance to its 50th percentile commute distance is 2.4, whereas the median ratio for the entire regional is 2.0. This difference results from the Boston job market’s significant pull on the region (discussed later in this section) and the housing and transportation options in the region that make these lengthy commutes desirable for some workers.
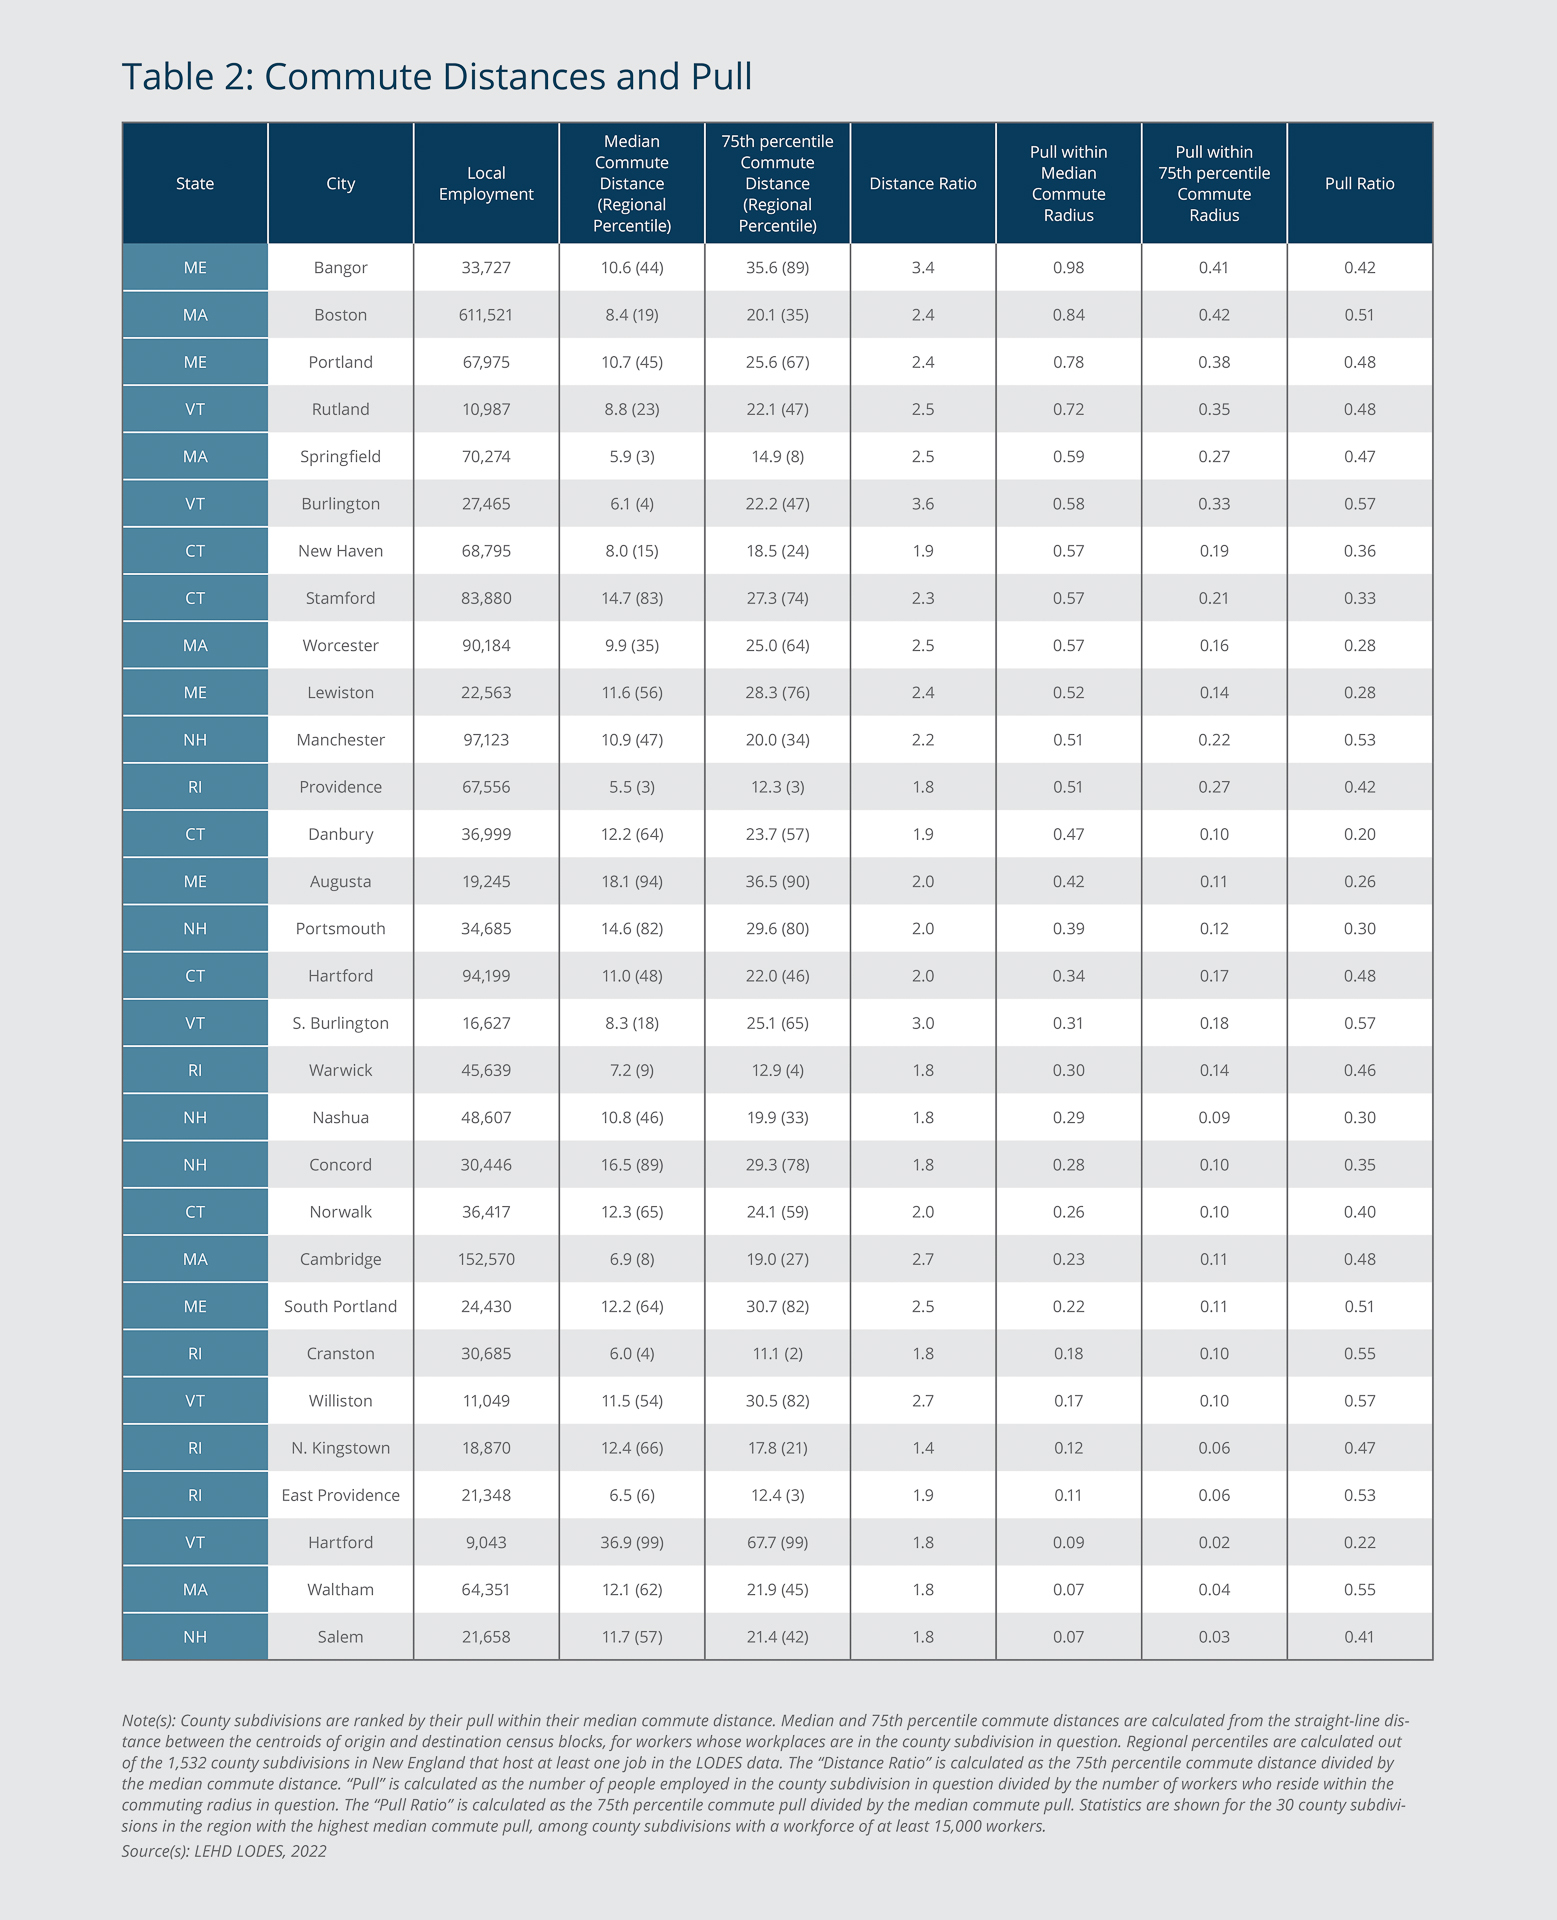
Across New England, typical commutes to and from major employment hubs vary substantially. Table 2 shows the median and 75th percentile straight-line commute distances for the five cities in each New England state with the largest workforces as well as their percentiles among the distribution of all the communities in the region. The largest employment centers in Massachusetts, Rhode Island, and Vermont generally have the shortest median straight-line-distance commutes. The immediate Boston area benefits from the surrounding population density—and the large worker pool provided by Boston itself; the median commutes to Boston from the adjacent communities of Brookline, Cambridge, Somerville, and Revere each is among the shortest 8 percent in the region. However, the duration of a commute often is more relevant to commuters than the straight-line distance between home and work, particularly in the Boston metropolitan area, where traffic is notoriously congested.
Federal Reserve Bank of Boston
The median commute distances for Maine’s largest employment centers are not dramatically longer than Boston’s, but a separation emerges at the 75th percentile. Despite a fairly modest median commute, Bangor, Maine, has one of the longest 75th percentile commutes of any major employer in the region, 35.6 miles. Among cities where more than 15,000 workers are employed, only Lebanon, New Hampshire, and Augusta, Maine, have longer 75th percentile commutes. Burlington, Vermont, has one of the shortest median commutes of any major employer in the region, but its 75th percentile commute distance falls in the middle of the pack.
This pattern of divergence between the median and 75th percentile commutes characterizes many employment hubs that are isolated by either natural geography or low population density in the surrounding communities. Those cities are typically able to source many workers from within their own borders and from adjacent communities due to a lack of competition from other employment centers; however, sparse populations in rural areas or natural features such as oceans and mountains increase the average length of commutes for workers living beyond the immediate vicinity of their workplaces. As Table 2 illustrates, some major hubs often display this pattern. Though they may boast a sizable population, once the nearby pool of workers is exhausted, they supplement their workforces with workers who are willing to commute sizable distances, increasing the 75th percentile commute distance. In this sense, the divergence from the median to the 75th percentile commute distance represents not only the abundance of nearby workers relative to distant workers, but also the willingness of in-commuters to spend substantial time on their drives to and from work.
Table 2 provides various statistics for these distances. It also presents each city’s “pull,” which we define as the ratio of the number of people who work in a city to all employed people living within a specific distance of that city. It indicates the portion of the nearby workforce that is drawn to the city. The table shows separately the pull statistic for the median commute distance and the 75th percentile commute distance. A city with strong pull (a higher number) within its median commute radius captures a relatively large percentage of the available workforce within that range, while a city with weak pull (a lower number) captures a small percentage of available workers. Median commutes, of course, vary by city, so a city with a higher pull statistic is not necessarily a stronger center of industry relative to a city with weaker pull, but the statistic does approximate how dominant a city is within its local context. For instance, a low pull statistic may indicate that a city either lacks a competitive job market or that it competes with other nearby cities or towns with strong job markets.
Among communities of any size, the cities and towns in the region with the strongest pull within their median commute distances include several regional hubs—midsize cities in sparsely populated areas, such as Bangor, Maine; Burlington, Vermont; and Pittsfield, Massachusetts—as well as geographically isolated communities such as Houlton, Maine, and Provincetown, Massachusetts. As Table 2 shows, despite the enormous population residing within its median commute distance, Boston has the second highest pull statistic among New England cities with at least 15,000 workers (and the eighth highest among communities with at least 1,500 workers).
Commuting Patterns Have Changed Little since the Pandemic
Despite the extent of the disruption to working and commuting that accompanied the COVID-19 pandemic, the basic patterns of commuting described in this brief changed little on net from 2019 to 2022. Researchers have explored the dramatic surge in remote work that accompanied the pandemic, but they also have traced how it receded substantially after 2020 while remaining elevated from pre-pandemic levels. Most of the workers who continue to enjoy some flexibility and are allowed to work from home have hybird arrangments that require substantial on-site presence (Barrero, Bloom, and Davis 2023). In 2023 and 2024, an increasing number of major employers implemented return-to-office policies that eliminated many remote-work arrangements (for example, Amazon, Dell, Disney, and JP Morgan).
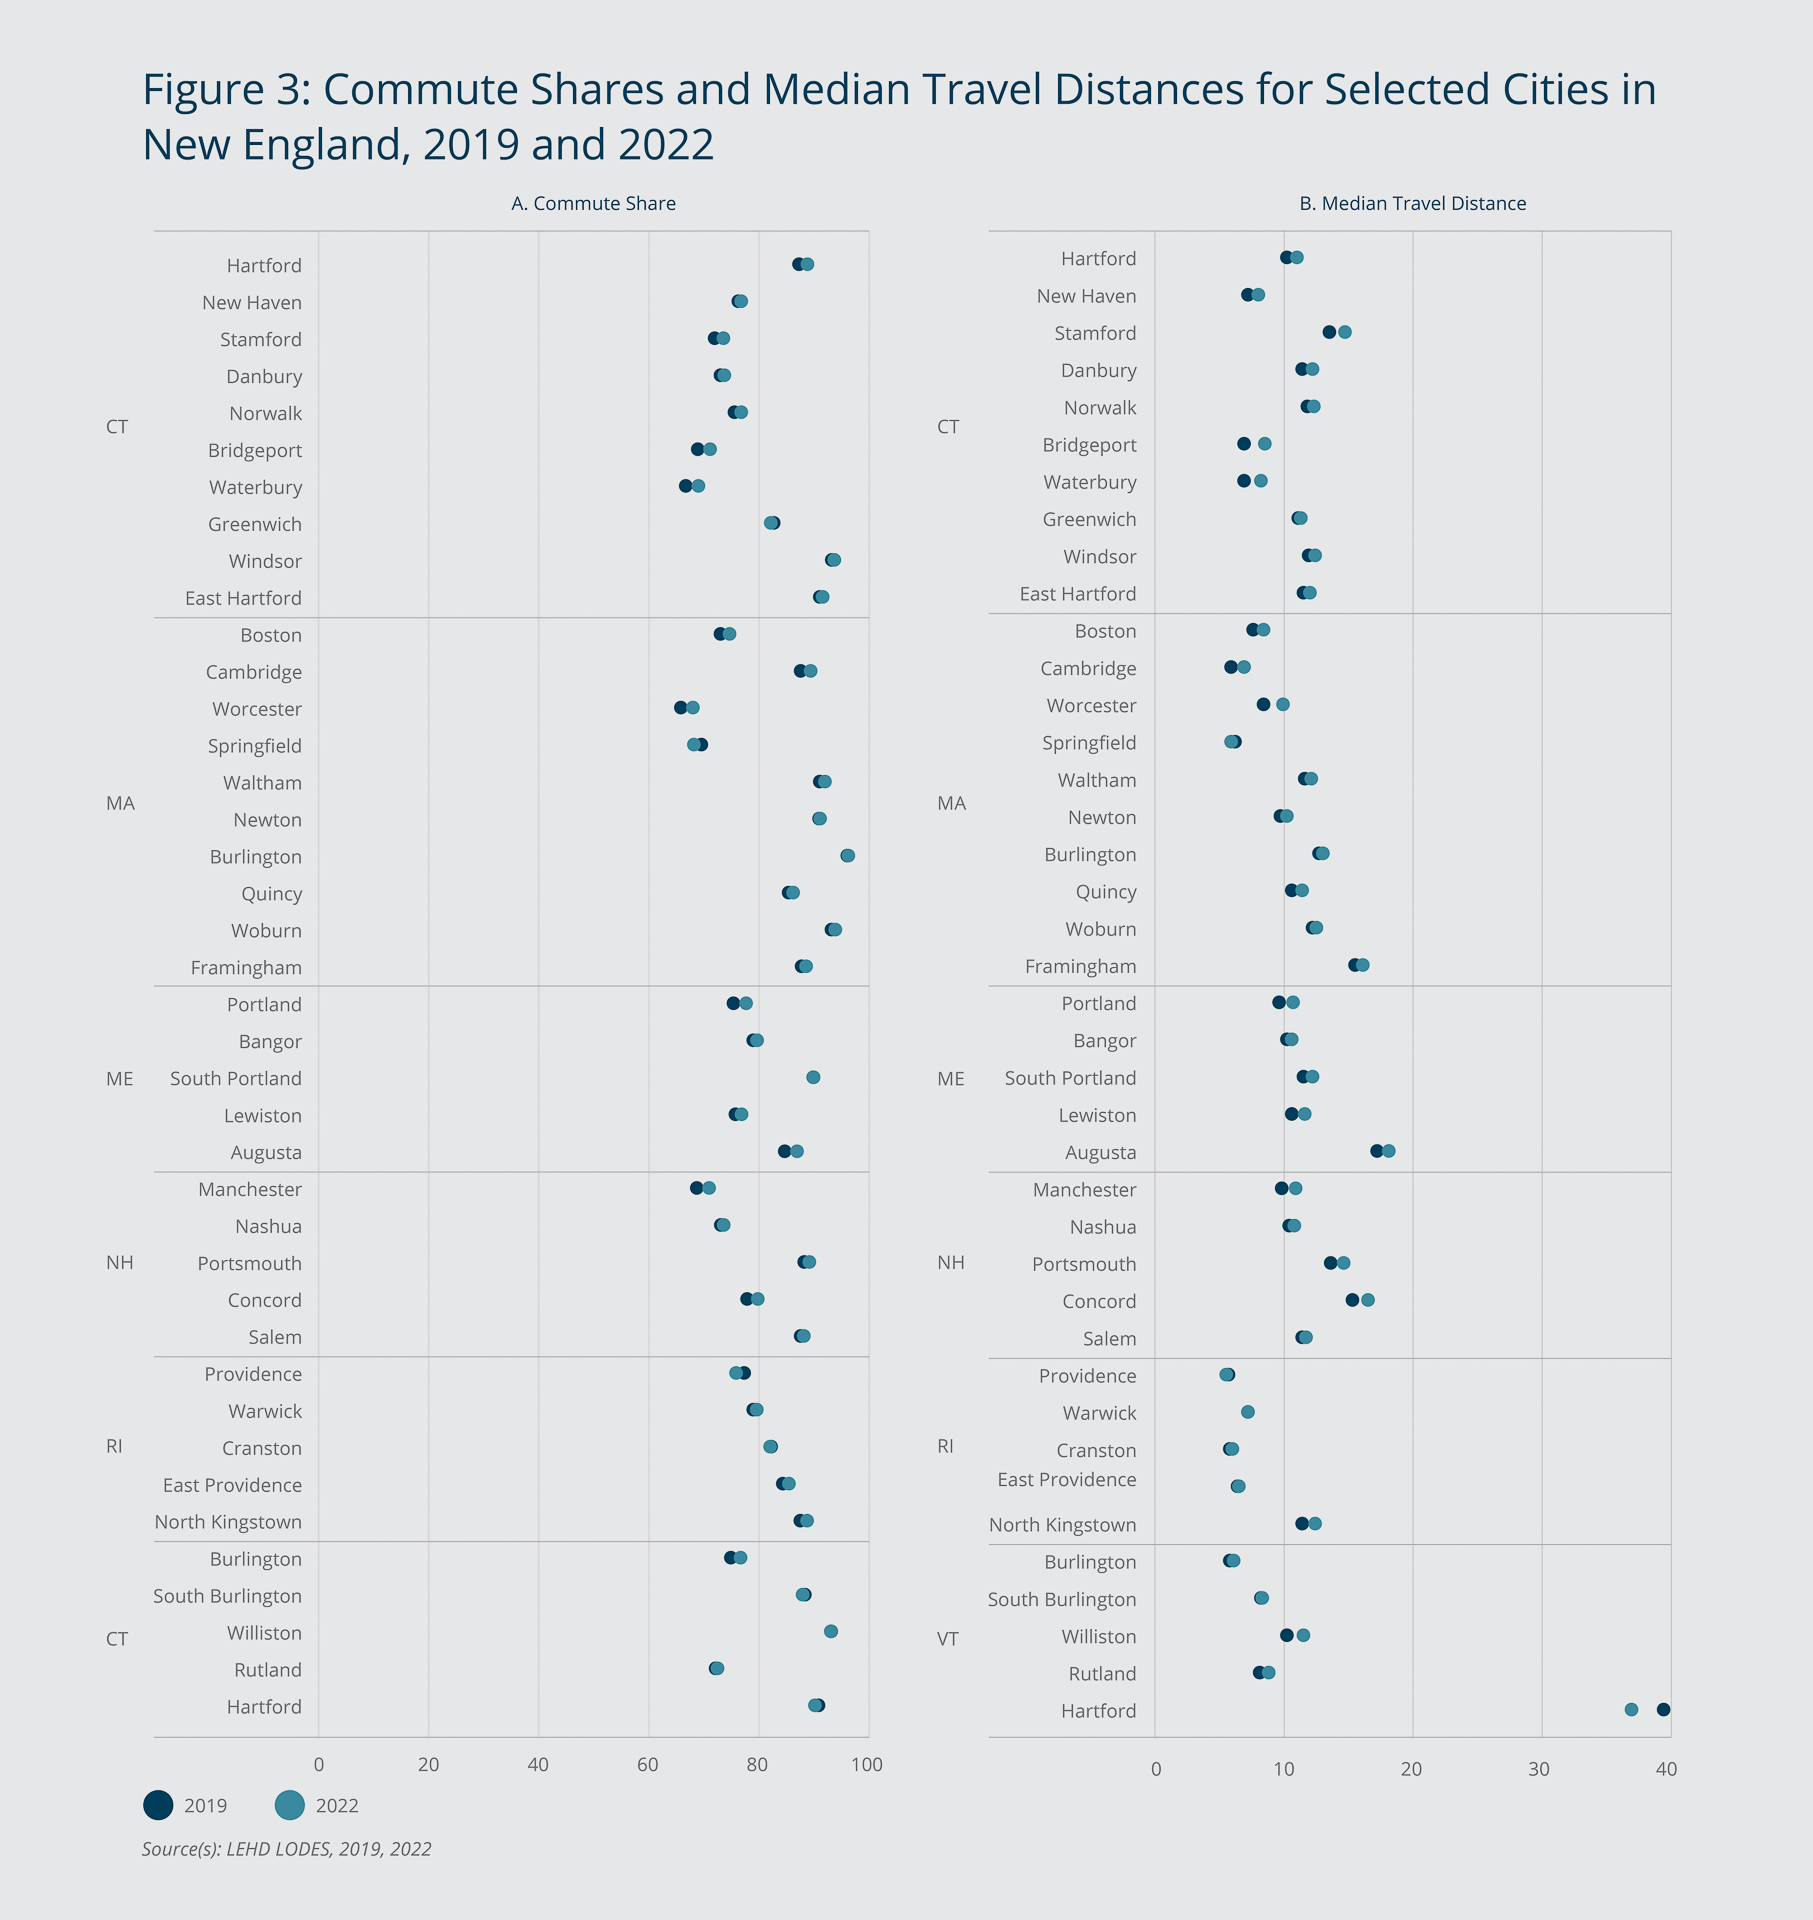
The commuting patterns in 2022 explored in this brief—including the commuter share of local employment and the distance traveled during a typical commute—are similar to the patterns that prevailed in 2019, as Figure 3 shows. For the largest cities across the region (the largest 10 in Massachusetts and Connecticut and the largest five in the other New England states), commuting distances and the commute share of workforces have changed only modestly since 2019. Median commute distances and the commute share grew slightly in most places.
Federal Reserve Bank of Boston
Commuting Flows Can Be Complex
Two-way Flows
Although some commuting patterns are consistent across the region, many include nuances that would complicate a simple model in which workers flow from a residential community to the nearest and largest business district. Two-way commuter flows between cities are one such complication.
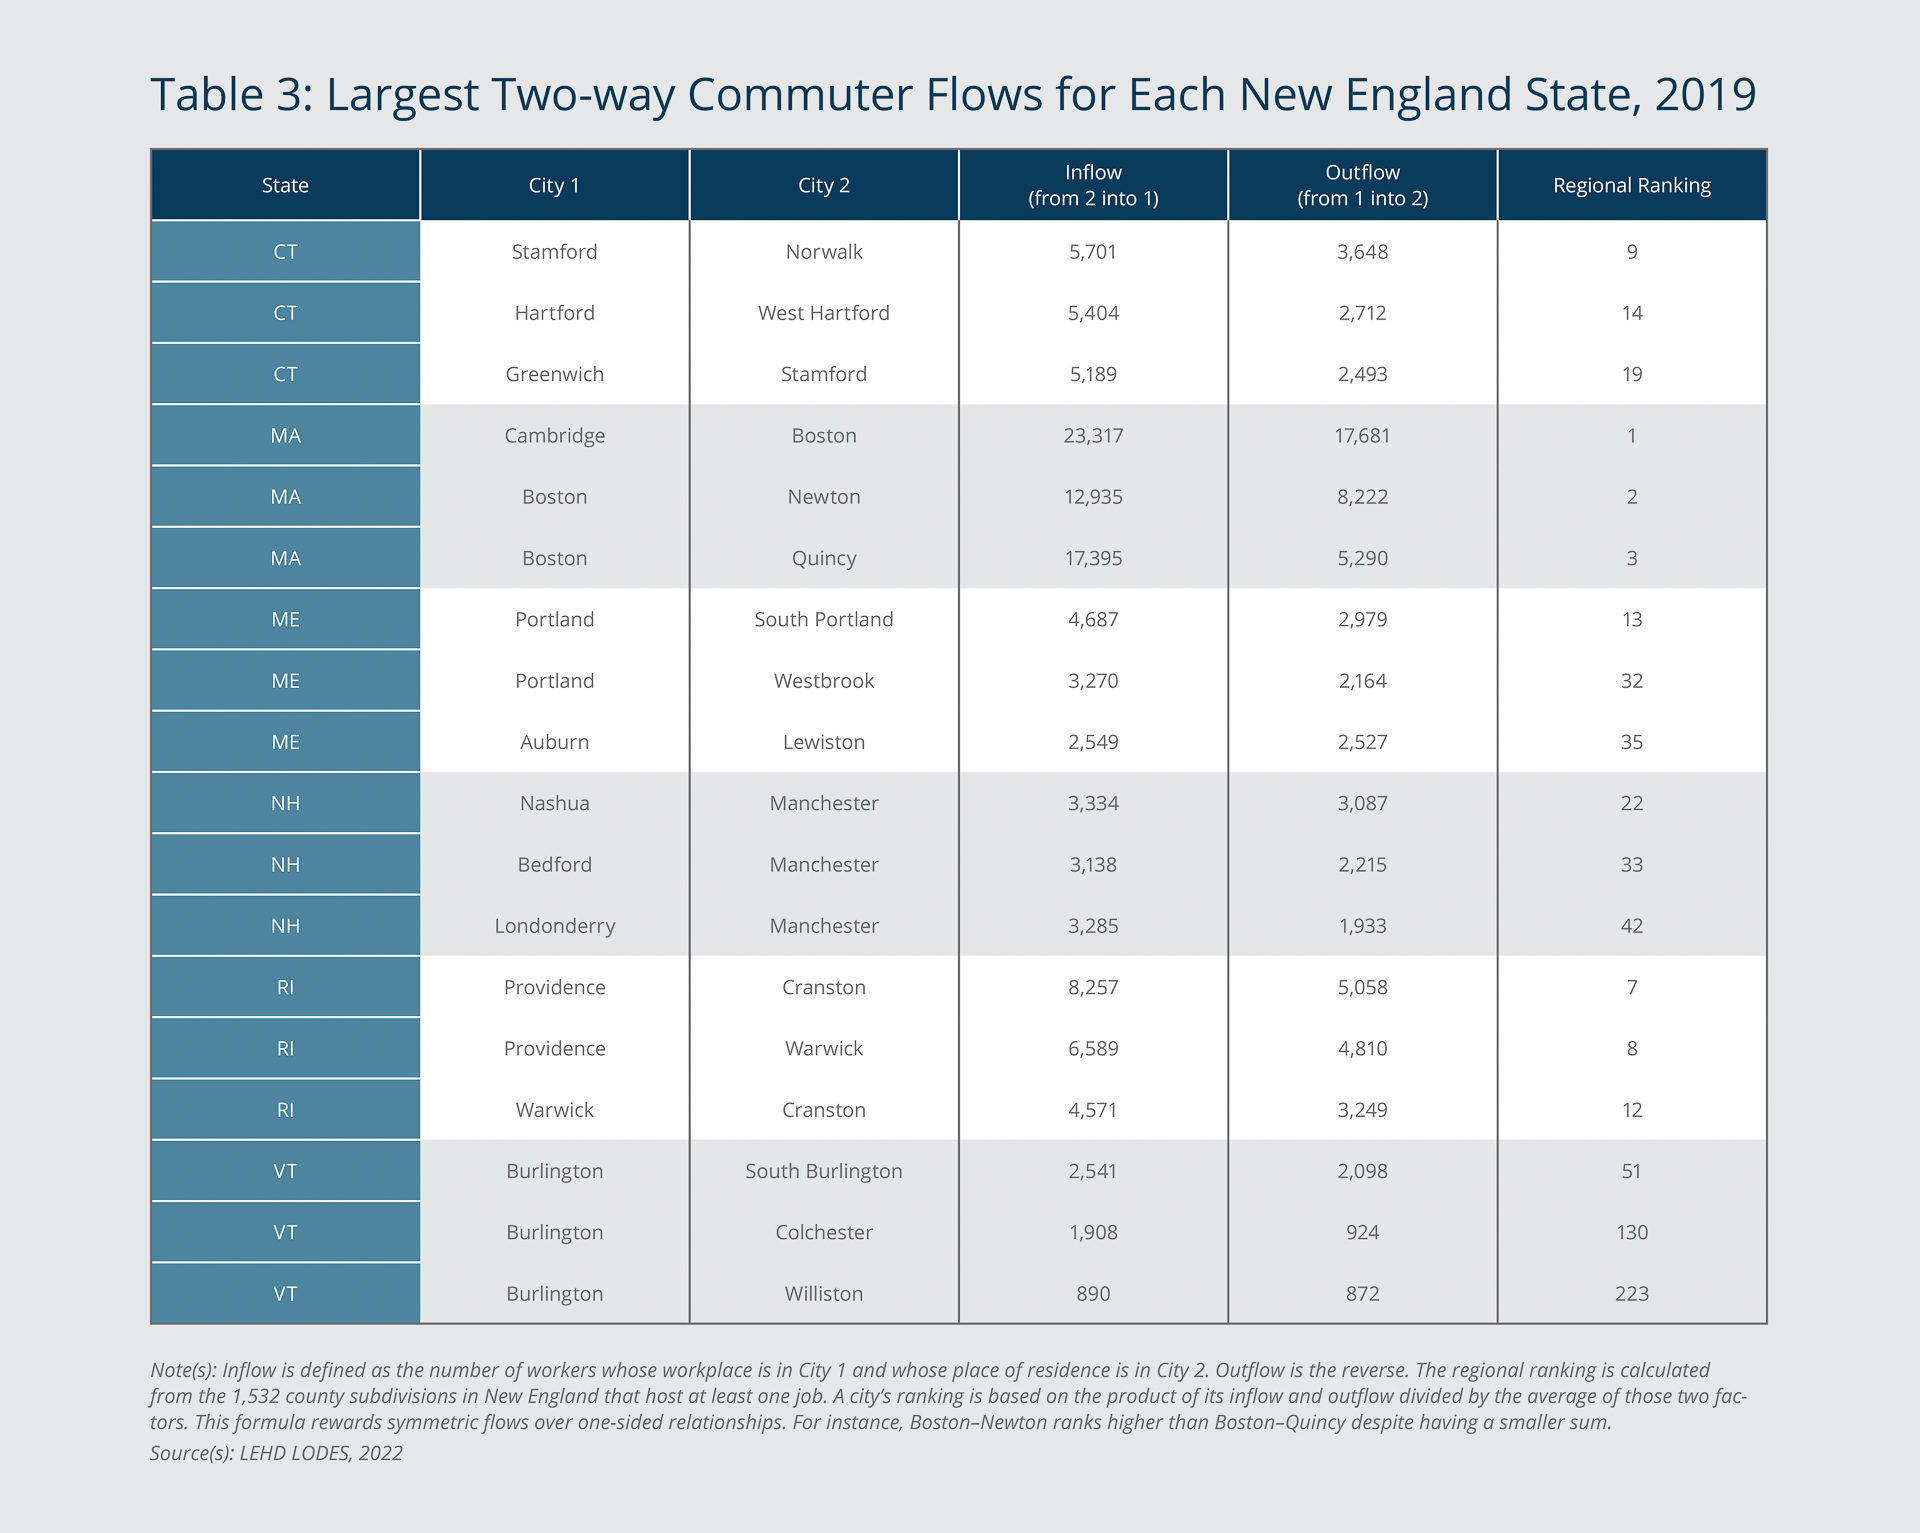
Often, there is significant two-way commuter flow between a major employment center and an adjacent or nearby community because major employment centers also tend to host a large resident population and therefore can be major contributors of workers to nearby communities. These “reverse commuters” are commonplace across the region, as shown in Table 3, which lists the top pairs of cities ranked by a weighted combination of their exchange of workers. This measure is calculated as the product of the two flows divided by their average, a formula that rewards symmetric exchanges of workers over one-sided flows.
Federal Reserve Bank of Boston
The six largest two-way commuter flows in the region all involve Boston. They are to/from the cities of Cambridge, Newton, Quincy, Somerville, Brookline, and Waltham. In each case, Boston contributes a sizable number of workers to the other city—most notably to Cambridge; the number of Boston residents who work in Cambridge exceeds the number of Cambridge-to-Boston commuters. Many of the other largest two-way flows involve the region’s largest employment hubs, often with adjacent cities in dense metropolitan areas. Significant two-way flows occur in more sparsely populated areas as well. In Vermont, Burlington and neighboring Williston exchange nearly 1,000 workers in each direction. In Maine, Augusta and Waterville, which are separated by several miles of highway, contribute more than 350 workers to each other’s workforce.
Though nearly all the largest two-way flows occur between adjacent cities and towns, some involve pairs of cities that are sizable distances apart. Boston and Framingham share one of the largest two-way flows in the region. They exchange nearly 7,300 workers, roughly 5,000 of whom live in Framingham. This exchange is notable in that while Framingham is in Greater Boston, it is separated from the city proper by several sizable cities and towns—including Natick, Wellesley, and Newton—past or through which commuters must travel. Each of those communities boasts a robust job market, particularly Newton, which has New England’s 12th largest labor market, larger than Framingham’s. Thus, the substantial flow in both directions speaks to the strong pull of both Boston and Framingham as well as the advantageous position of each along Interstate 90 and service by the Worcester/Framingham commuter rail. Individuals may choose to live in one of these cities while working in the other for any number of reasons, including lower home prices in Framingham, greater provision of amenities in Boston, and the allure of a position at one of the major employers based in either city; Bose, TJX, and Staples, for example, are headquartered in Framingham.
Where Communities Send Their Workers
Many New England communities are located within a relatively short commuting distance of several employment centers. Particularly in southern New England, few communities have access to only one major hub. Working individuals can choose their place of residence as well as their place of work, creating a spatial marketplace for both housing and labor.
Though many communities export enormous shares of their resident workers to one major hub, such as Lynn and Malden do with Boston, just as common are communities whose resident workers branch out in all directions. For example, Methuen, Massachusetts, which abuts New Hampshire, sends more than 1,000 workers to five separate communities: the adjacent cities of Lawrence, Andover, and Haverhill as well as Boston (which is nearly 30 miles away) and Salem, New Hampshire (which is just across the state border). Bridgeport, Connecticut, one of the region’s largest net senders, contributes more than 1,000 workers to nine separate communities.
Housing and Transportation Are Crucial in Influencing Access to Workforce and Employment Opportunities
As noted, many factors other than proximity to a major employment center influence commuting behavior. Key factors alluded to earlier include the availability, cost, and convenience of housing and transportation options. These forces can act in opposing directions in ways that are difficult to untangle in an exploratory analysis such as this.
Workers of all income levels may choose to live far from where they work and spend time and money commuting. For some workers, the only affordable housing options are located far away from their workplace; other workers prefer to live away from the city. On the other hand, a lower-earning worker may need to live near their work—or take a job close to where they live—for lack of affordable transportation options, whereas a high-earning worker may pay a premium to live close to their workplace to minimize commuting time.
High home prices near Boston clearly complicate this optimization problem and influence location decisions. As Table 2 shows, Boston’s median in-commuter, according to the LODES data, travels only 8.4 miles to their place of work, but the 75th percentile commuter travels 20 miles. The balance of factors contributing to this gap—which is larger than the regional average—is not immediately clear.
Transportation infrastructure is central to a viable commute. For example, 2018 commuter rail statistics published by the Massachusetts Bay Transportation Authority (MBTA) tally more than 1,000 individuals boarding the commuter rail in Lowell during morning hours and disembarking at North Station in Boston nearly 30 miles away.3 This is a sizable total compared with the gross number of roughly 2,500 Lowell-to-Boston commuters in the LODES data from 2019.
While rail infrastructure plays an important role in Greater Boston, across the region, roads are often the sole connectors of cities. Commuters can drive their own vehicles, ride the bus, or make use of carpools wherever roads and transit routes allow.
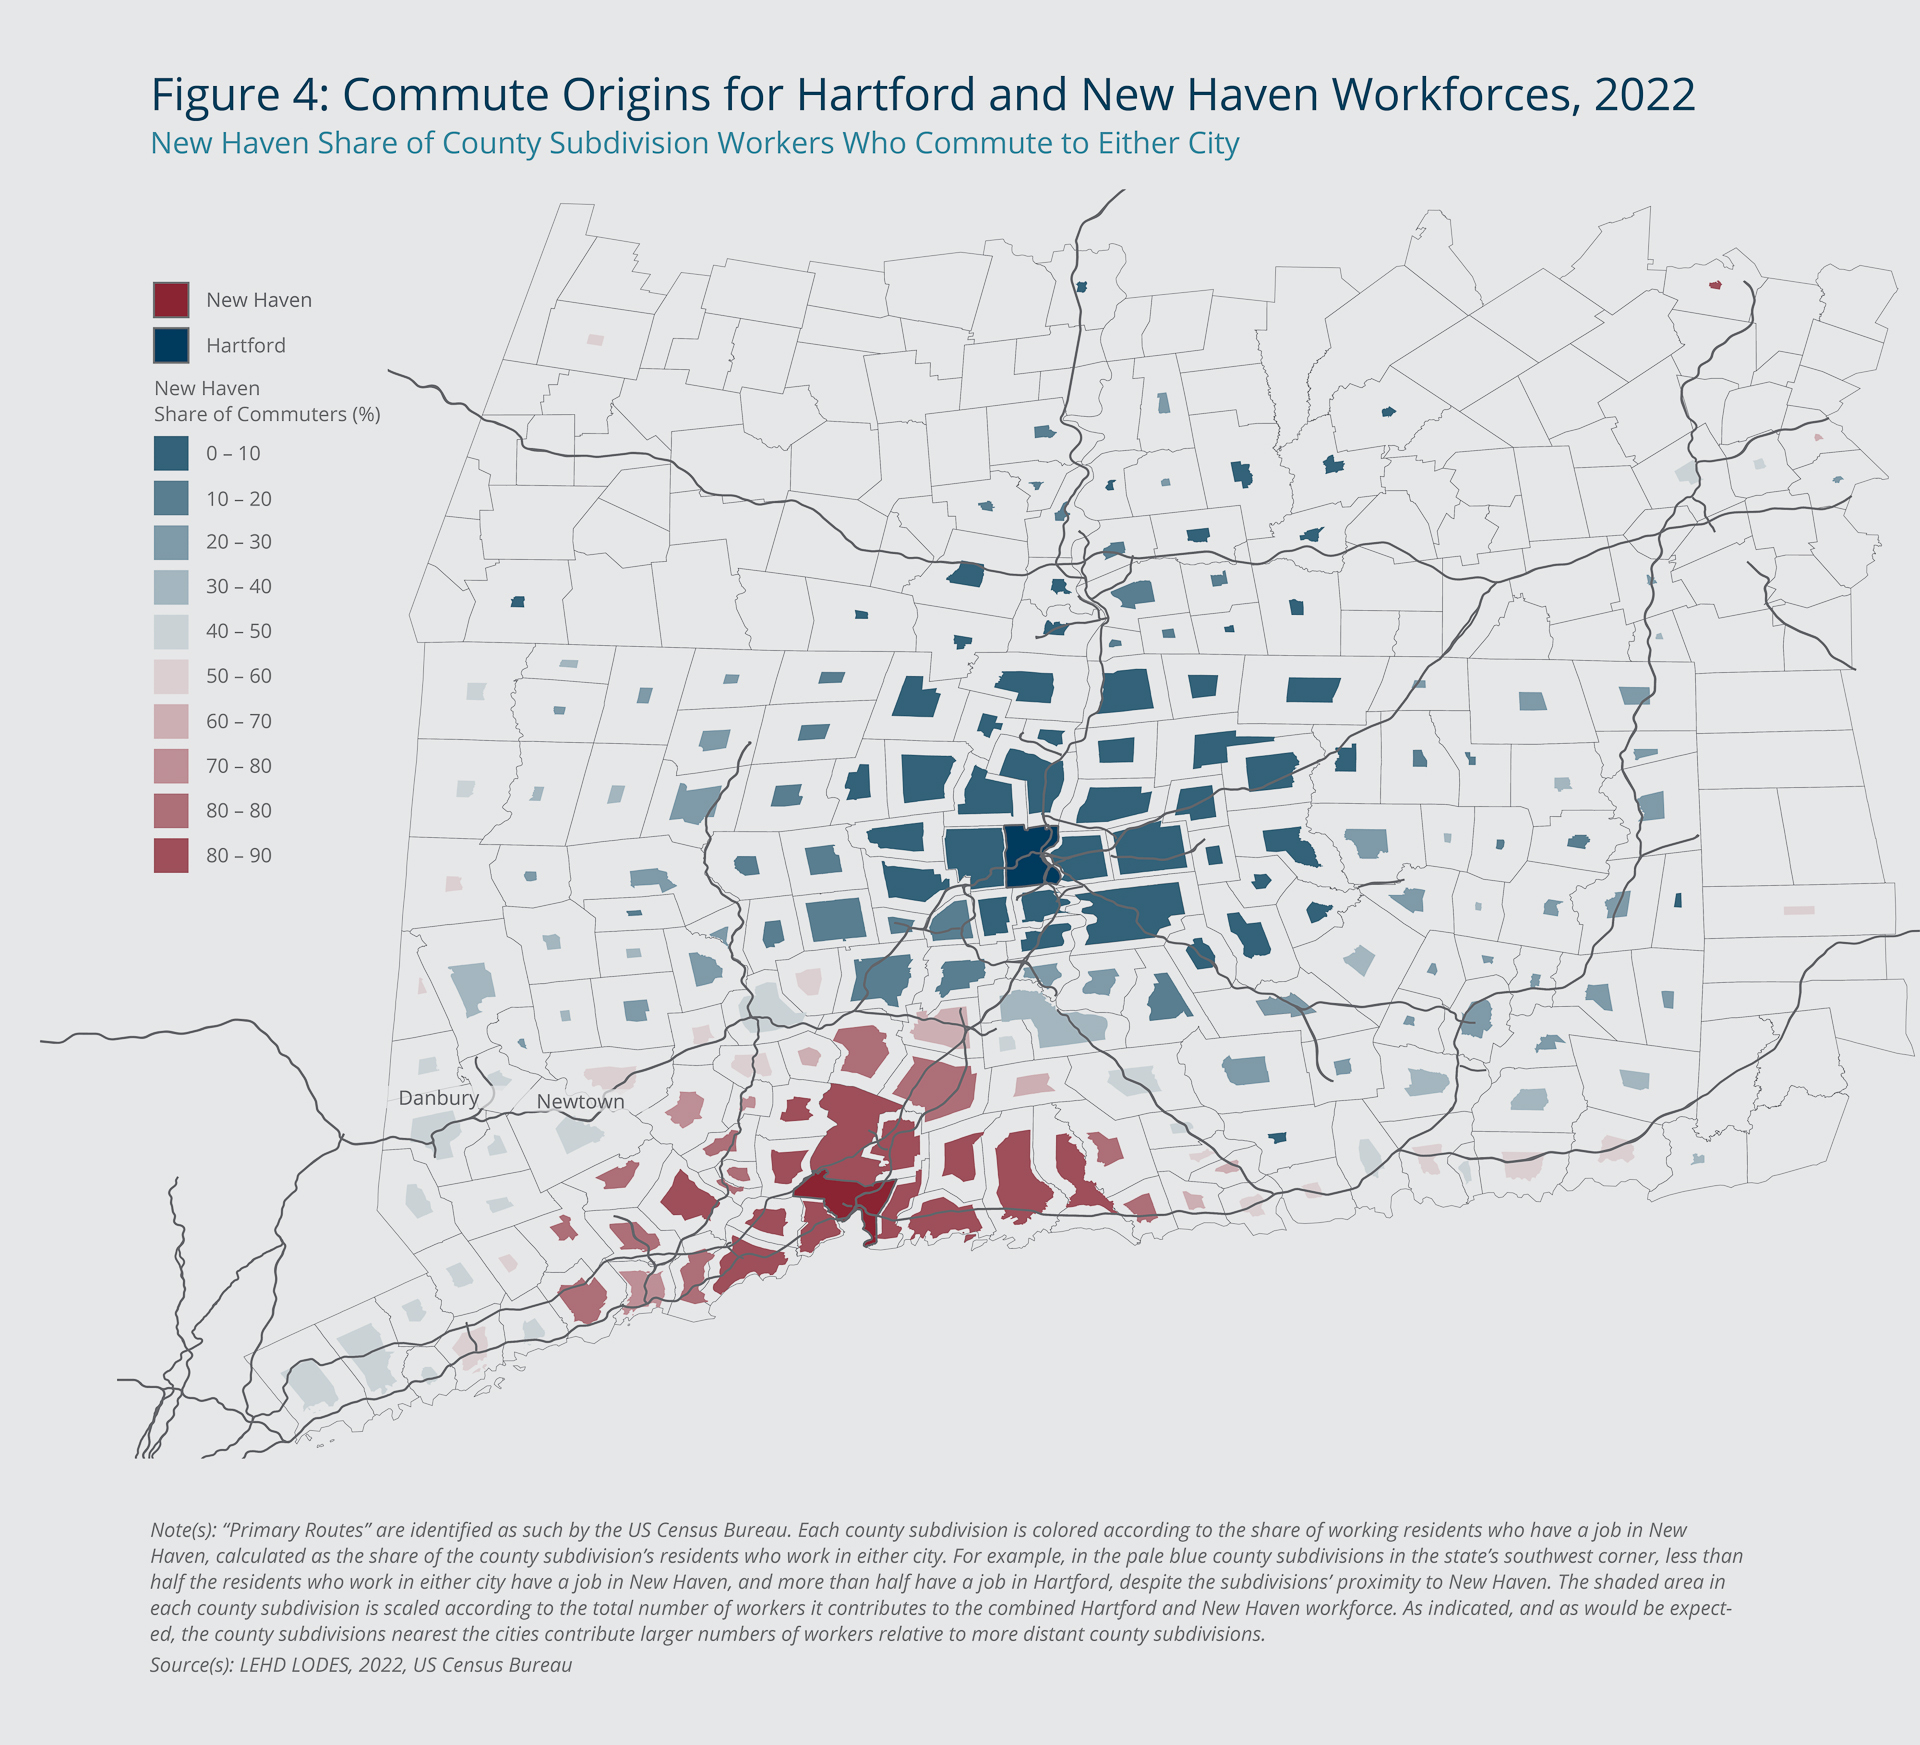
Figure 4 shows how two of Connecticut’s largest employment hubs, Hartford and New Haven, compete for workers. Hartford, the larger of the two centers, has a greater employment presence across the state, with nearly three-quarters of the communities in Connecticut contributing more of their resident workers to Hartford than to New Haven. Access to New Haven is constrained by Long Island Sound to the south, whereas workers across the entire state can more easily access Hartford.
Federal Reserve Bank of Boston
In addition to natural geography, the road infrastructure surrounding the two cities plays a role in sourcing commuters. Two major routes into Hartford, Interstate 84 from the southwest and Highway 3 from the southeast, roughly delineate the transition point between the two cities, resulting in many communities closer to New Haven exporting a larger share of their workers to Hartford, presumably via one of those two corridors.
The Connecticut communities of Danbury and Newtown, labeled in the figure, illustrate this phenomenon most clearly. Though each lies roughly 40 miles from Hartford as the crow flies and only 20 from New Haven, both are linked to Hartford by Interstate 84, whereas the journey to New Haven requires slower travel on state highways.
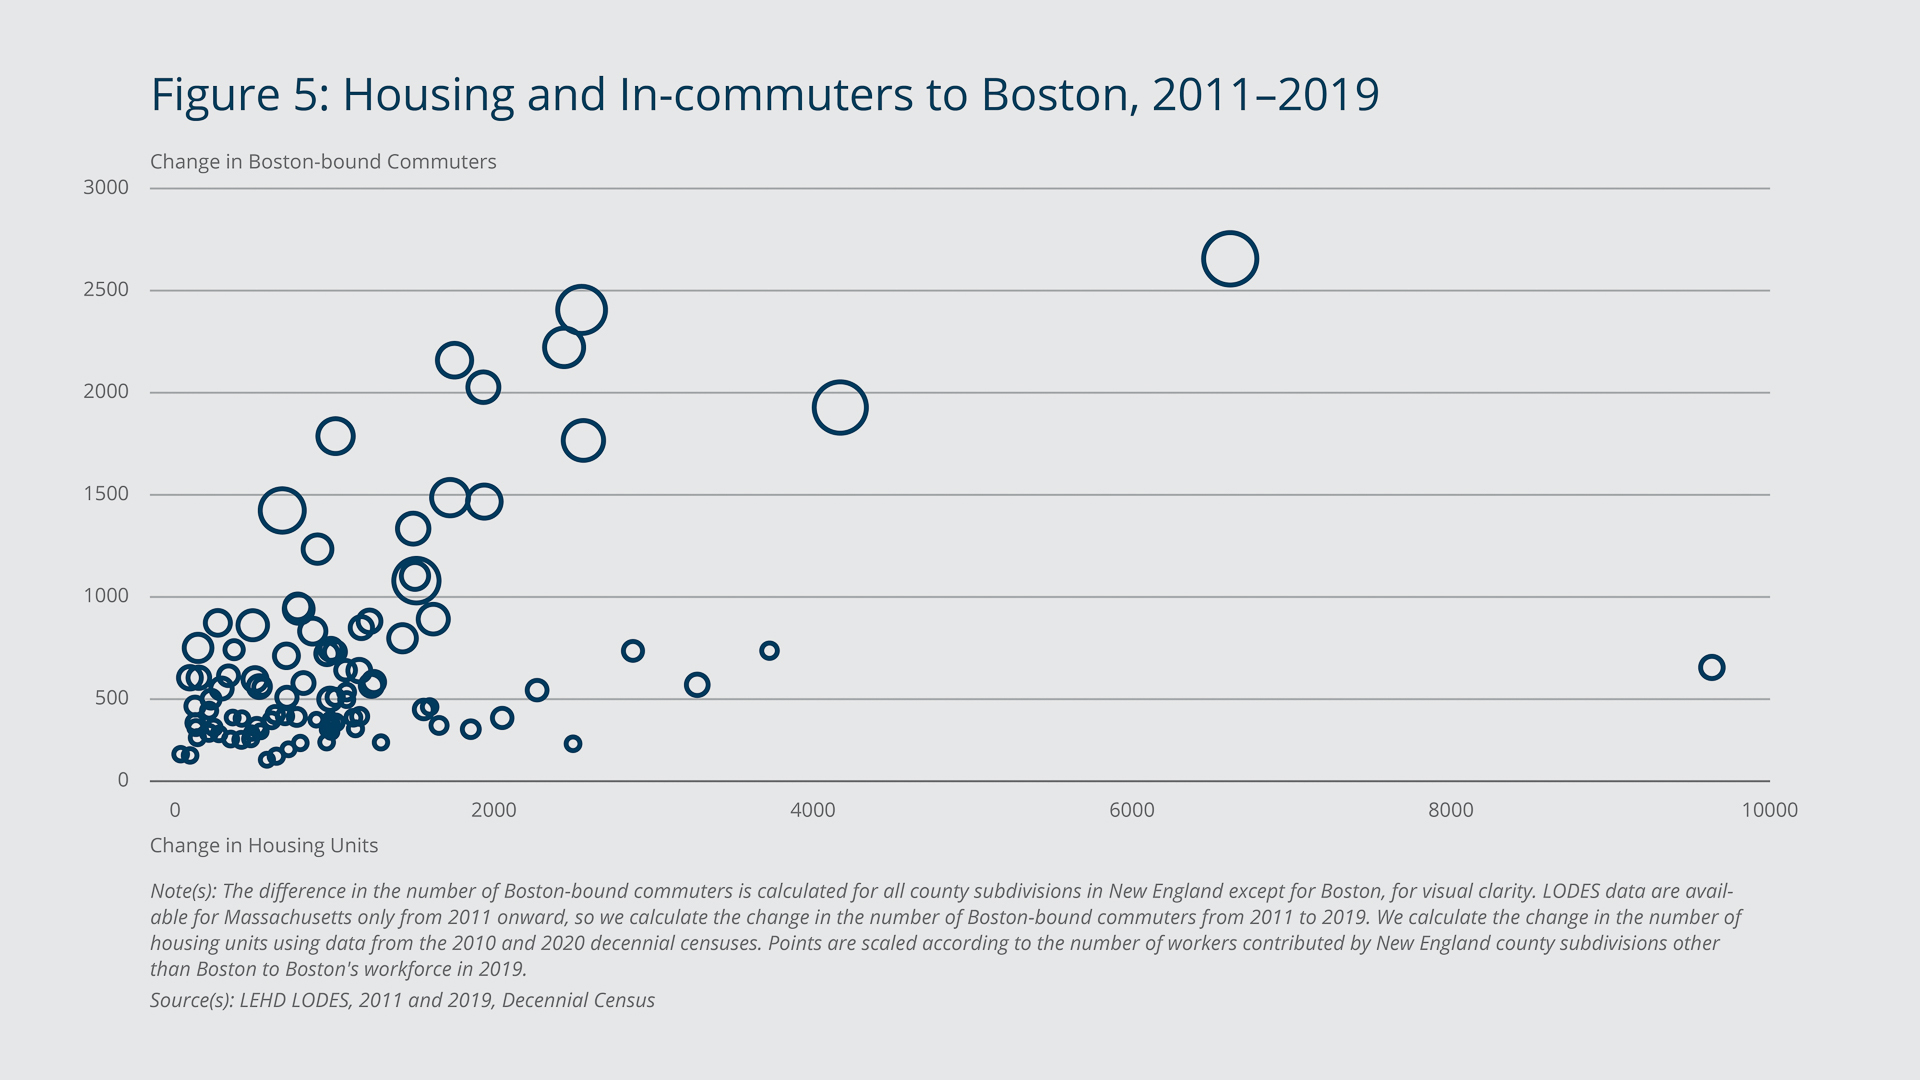
The abundance and affordability of housing in nearby communities also plays a key role in an employment center’s ability to source workers. Though housing affordability has a complicated relationship with the number of workers a community exports to an employment hub, the total number of housing units has a potentially more straightforward relationship with the volume or flow of workers. Figure 5 shows how, among communities that exported at least 1,000 workers to Boston in 2019, a change in the number of housing units correlates with the change in inflow to Boston.
Federal Reserve Bank of Boston
Each community that exported at least 1,000 workers to Boston in 2019 saw increases in housing units from 2010 to 2020 and in commuters sent to Boston from 2011 to 2019; the median increases were 952 housing units and 426 workers. The relationship between housing units and workers sent to Boston is overwhelmingly positive, a testament to the demand for workers that has long outpaced the supply of housing in the area. While the addition alone of new housing units in surrounding communities can enable more workers to commute to Boston, Massachusetts has placed an emphasis on adding housing near public transit. The MBTA Communities Act, passed in 2021, requires communities served by the MBTA to add multifamily zoning districts near transit stops.4
The roles that housing and transportation play in the vitality of downtown business areas are complex and cannot be fully explored in this brief. However, this exploratory analysis shows how commuting is essential to the region’s economy, and that despite disruptions to work arrangements during the pandemic, these patterns have largely persisted. Communities still rely on their neighbors both as sources and destinations for workers, and many people still cover substantial distances to reach their places of work. In addition, it appears that in the region’s post-pandemic economy, access to transportation infrastructure and the availability of housing both continue to play significant—if nuanced—roles in the structure of commutes in New England.
Endnotes
- We cannot identify commuting details for all of these county subdivisions, however. The number for which we can calculate commute shares, export shares, and median commute distances is closer to 1,500.
- The reference period for inclusion in the LODES data is the second calendar quarter of the year, so peak summer employment in winter or summer vacation destinations has little if any impact on measured workforce commuting volumes and patterns (Graham, Kutzbach, and McKenzie 2014).
- See https://www.mass.gov/doc/lowell-line-2018-0/download. To the best of our knowledge, 2018 is the last time the MBTA published such statistics.
- The law applies to 177 communities, and as of January 29, 2025, more than 30 had missed the deadline to comply with it. Some of those communities have challenged the legality of the act.
References
Barrero, José María, Nicholas Bloom, and Steven J. Davis. 2023. “The Evolution of Work from Home.” Journal of Economic Perspectives 37(4): 23–50. .
Graham, Matthew R., Mark J. Kutzbach, and Brian McKenzie. 2014. “Design Comparison of LODES and ACS Commuting Data Products.” U.S. Census Bureau Center for Economic Studies Working Paper 14-38.

 About the Authors
Hope Bodenschatz, Federal Reserve Bank of Boston
Eli Inkelas, Federal Reserve Bank of Boston
Jeffrey P. Thompson,
Federal Reserve Bank of Boston
Jeffrey P. Thompson is a vice president and economist in the Federal Reserve Bank of Boston Research Department, where he is the director of the New England Public Policy Center.
Email: jeffrey.thompson@bos.frb.org
Acknowledgments
The authors thank Kiera Murray, Alejandra Guadarrama-Mojica, and Sam Shampine for excellent assistance in this research.
Resources
Site Topics
Keywords
- New England ,
- NEPPC Regional Brief ,
- commuting patterns ,
- transportation ,
- employment hubs