Trends in Household Portfolio Composition 
Using data from the Federal Reserve Board’s Survey of Consumer Finances, the authors explore how household asset portfolios in the United States evolved between 1989 and 2016—a period when household assets grew from about $25 trillion to slightly more than $100 trillion. The authors also track the evolution of wealth over time among birth-year cohorts and observe the standard life-cycle asset accumulation processes among low-, middle-, and high-income families. They also explore trends in the extent to which households’ balance sheets leave them vulnerable to financial shocks, and they examine the growing concentration of wealth.


 Key Findings
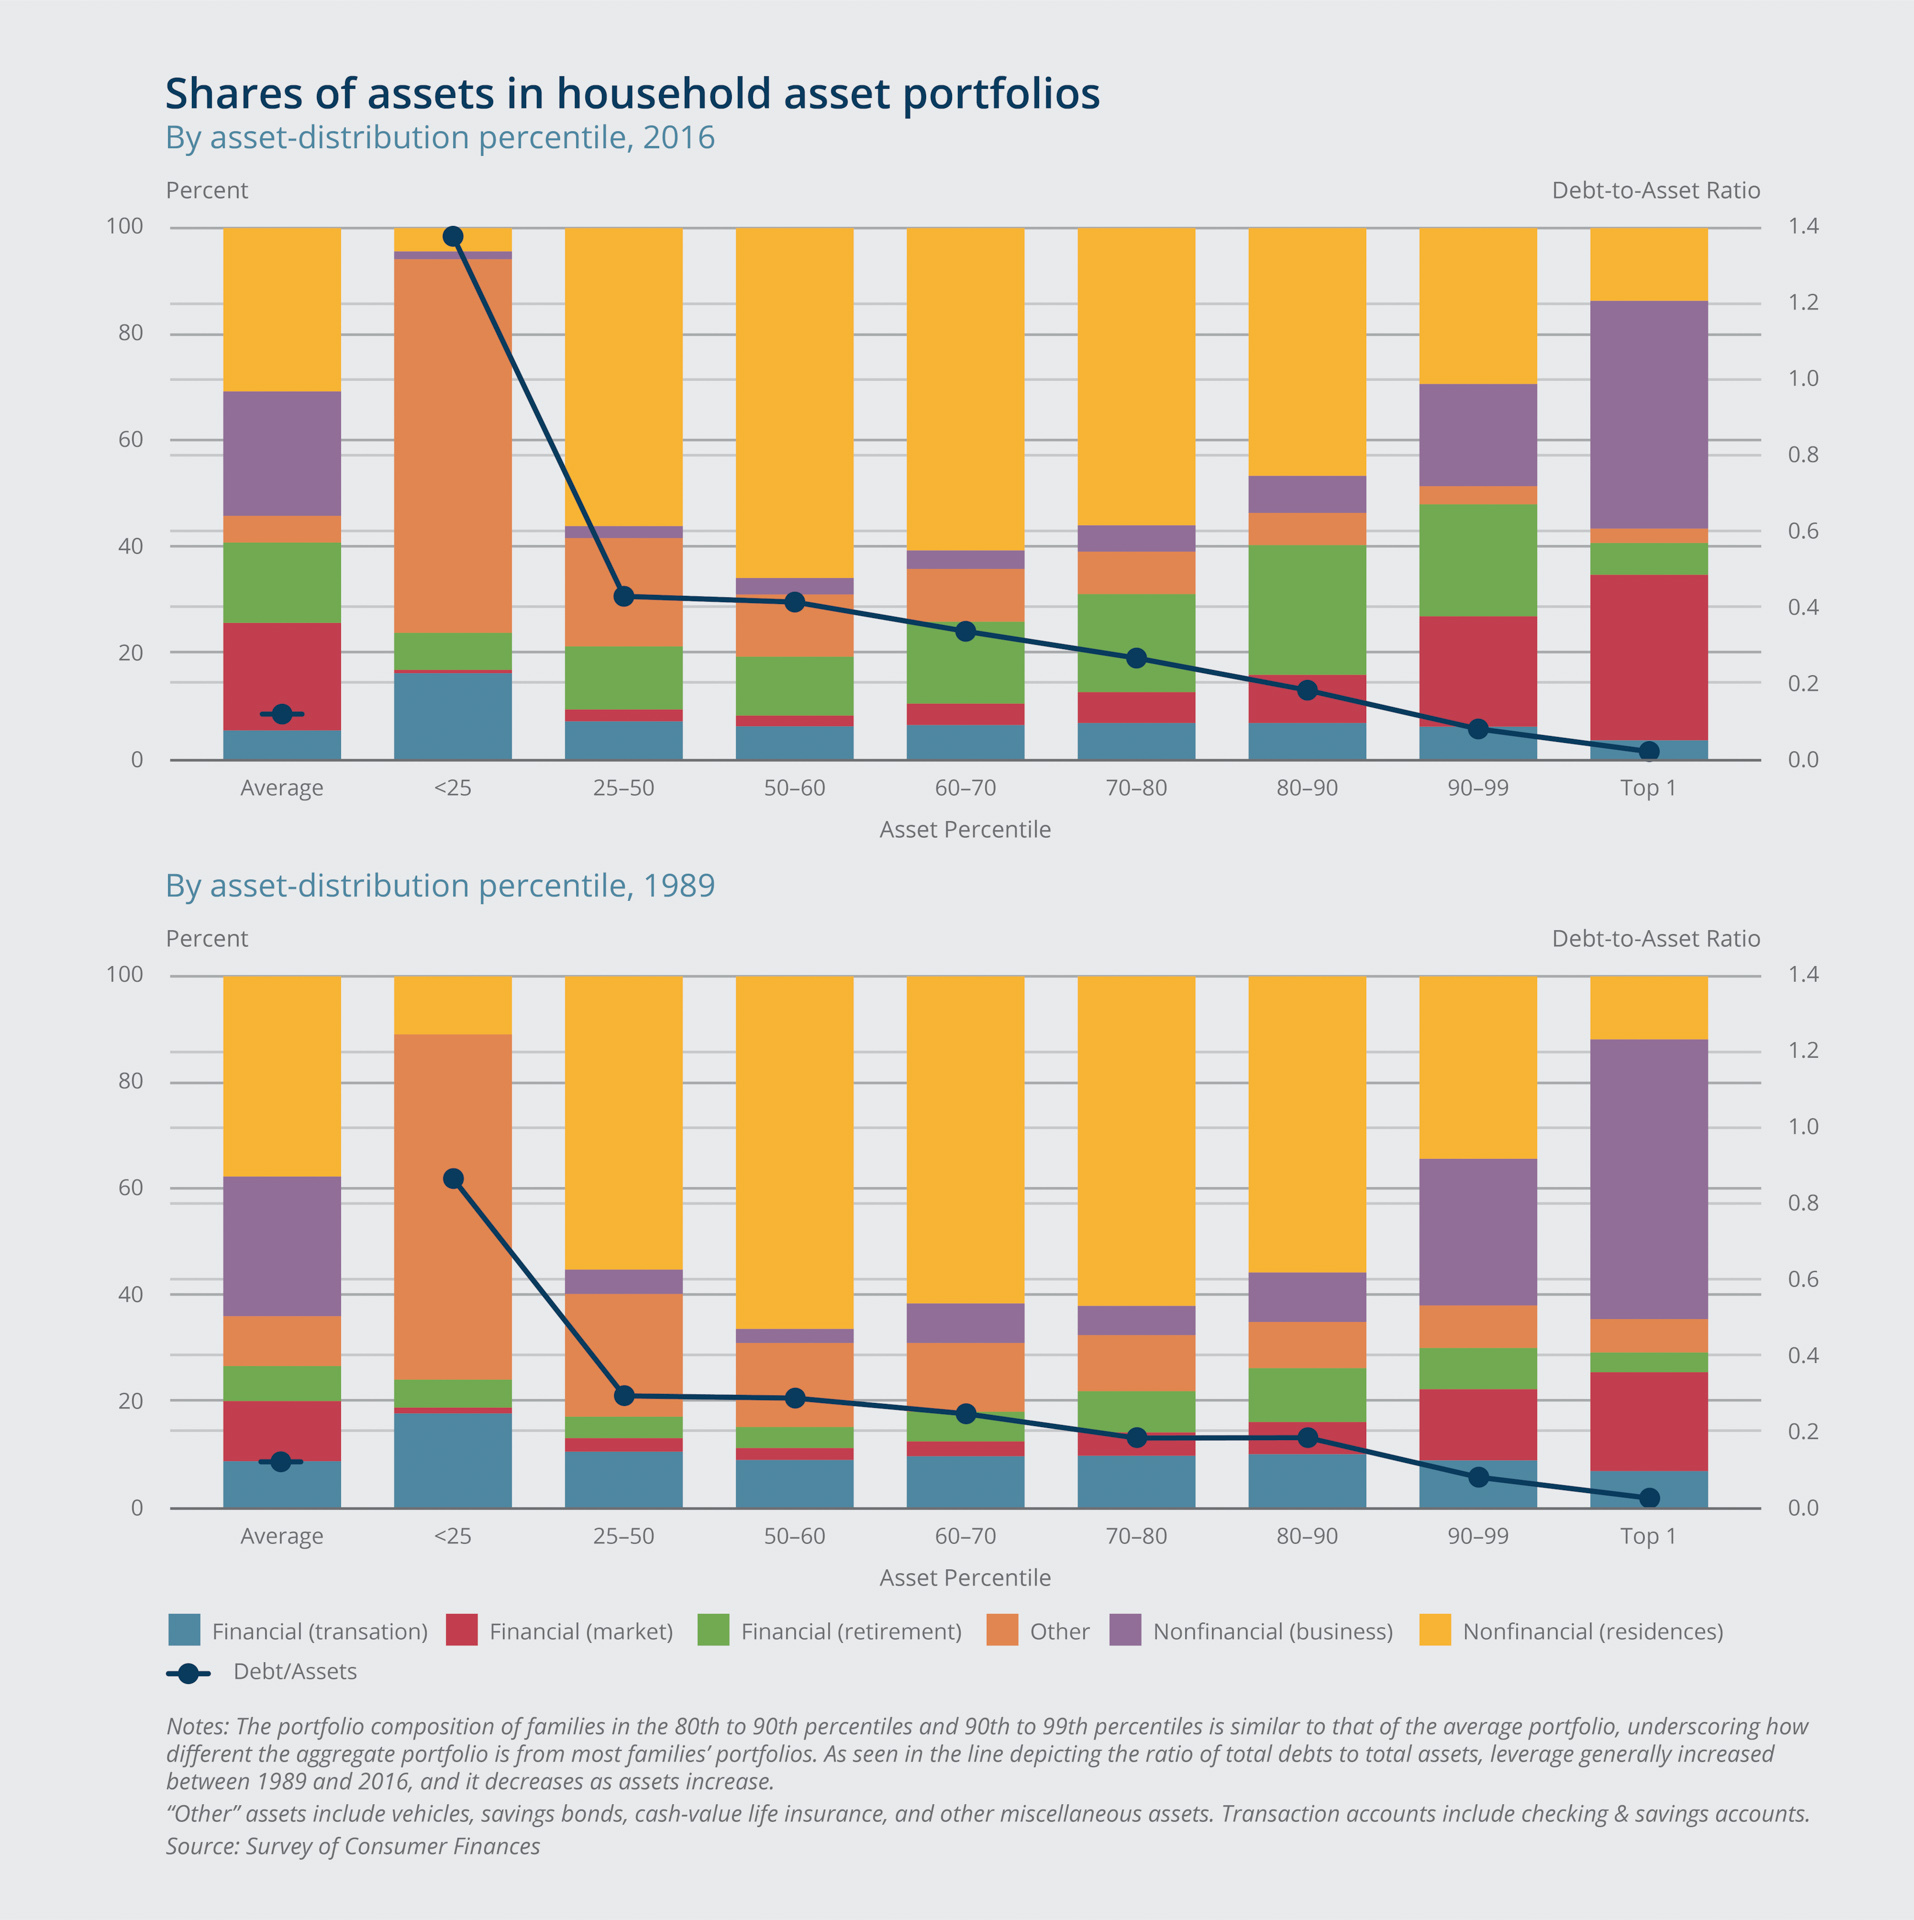
- The household asset portfolio inferred from aggregate data, which is spread across housing and financial assets, does not look like the portfolio of most households, which is composed mostly of housing assets.
- The time series dynamics of the aggregate portfolio, which has swung toward and from financial assets, do not appear in the time series of most families, whose portfolios have always been composed mostly of housing.
- Though the levels are of different magnitudes, assets generally increase throughout the typical working life for each of the three income groups—low, middle, and high—and they peak just before the typical retirement age. Afterward, assets decumulate, but only partly.
- As household heads transition into retirement, households move out of “risky” assets (asset classes that are especially exposed to asset-price shocks), particularly businesses and equities.
- Homeownership remains high through the household heads’ early eighties. The housing share of total assets rises in retirement, as families remain in their homes and start to consume out of their other assets.
- The number of families with a combination of two potential vulnerabilities—high debt payments and a high loan-to-value ratio on their primary residence—peaked in the late 2000s. In 2016, the number was at its lowest since the early 1990s.
- All of the time series variation in financial vulnerability can be attributed to middle-income families, who hold most of their assets in housing and are often the most highly leveraged income group in the housing market.
- Ownership of assets has become more concentrated over time. Increased concentration is seen within the distribution of assets and the distribution of income and by age.
- The concentration of assets increased slowly and steadily from the beginning of the observation period, in 1989, and the pace picked up in the 2010–2016 period.
Exhibits
Implications
Understanding developments in household portfolios, the authors say, enables the identification of the causes and consequences of a long-term rise of inequality in the distribution of wealth. Furthermore, they argue, understanding the allocation of assets across asset types, age groups, and the distribution of income is crucial to monitoring the degree of financial vulnerability that households face.
Abstract
We use data from the Federal Reserve Board’s Survey of Consumer Finances (SCF) to explore how household asset portfolios in the United States evolved between 1989 and 2016. Throughout this period, two key assets—housing and financial market assets—drove the household balance sheet evolution; however, we find a great heterogeneity in the balance sheets that averages and aggregates conceal. We observe that ownership of assets has become more concentrated over time, and we show that nearly all of the time series variation in financial vulnerabilities in family balance sheets is due to middle-income families, who hold most of their assets in housing and are often the most highly leveraged income group in the housing market. Tracking the evolution of wealth over time among birth-year cohorts, we observe the standard life-cycle asset accumulation processes among low-, middle-, and high-income families.