Wealth Distribution and Retirement Preparation among Early Savers 
The authors develop a new combined-wealth measure that augments data from the Federal Reserve Board’s triennial Survey of Consumer Finances (SCF) with estimates of the asset value of defined benefit (DB) pensions and expected Social Security benefits. They use this expanded definition of household wealth to study the adequacy of retirement resources among households preparing for retirement and to explore inequality in the distribution of economic resources.
This study evaluates the resources of households whose heads are in their 50s and those of households whose heads are in their 40s. It employs two measures of preparation for retirement: a wealth-to-income ratio that divides the combined-wealth measure by the current reported household income, and an annuity measure of wealth that compares the estimated annuity amount with the poverty level for elderly households. This study also uses the estimated annuity amount to calculate the share of households in the 40–49 and 50–59 age groups that fall below various multiples of the poverty threshold. For measuring inequality of wealth, the study uses shares of combined wealth held by the top 10 percent and top 5 percent of the distribution.

 Key Findings
- Predicted Social Security wealth (SSW) accounts for the largest portion of retirement wealth for both the 40–49 and 50–59 age groups in almost every year in the sample period. Mean SSW rose from $127,000 in 1989 to $150,000 in 2016 among 40- to 49-year-olds, and it rose from $189,000 to $238,000 over the same period for 50- to 59-year-olds.
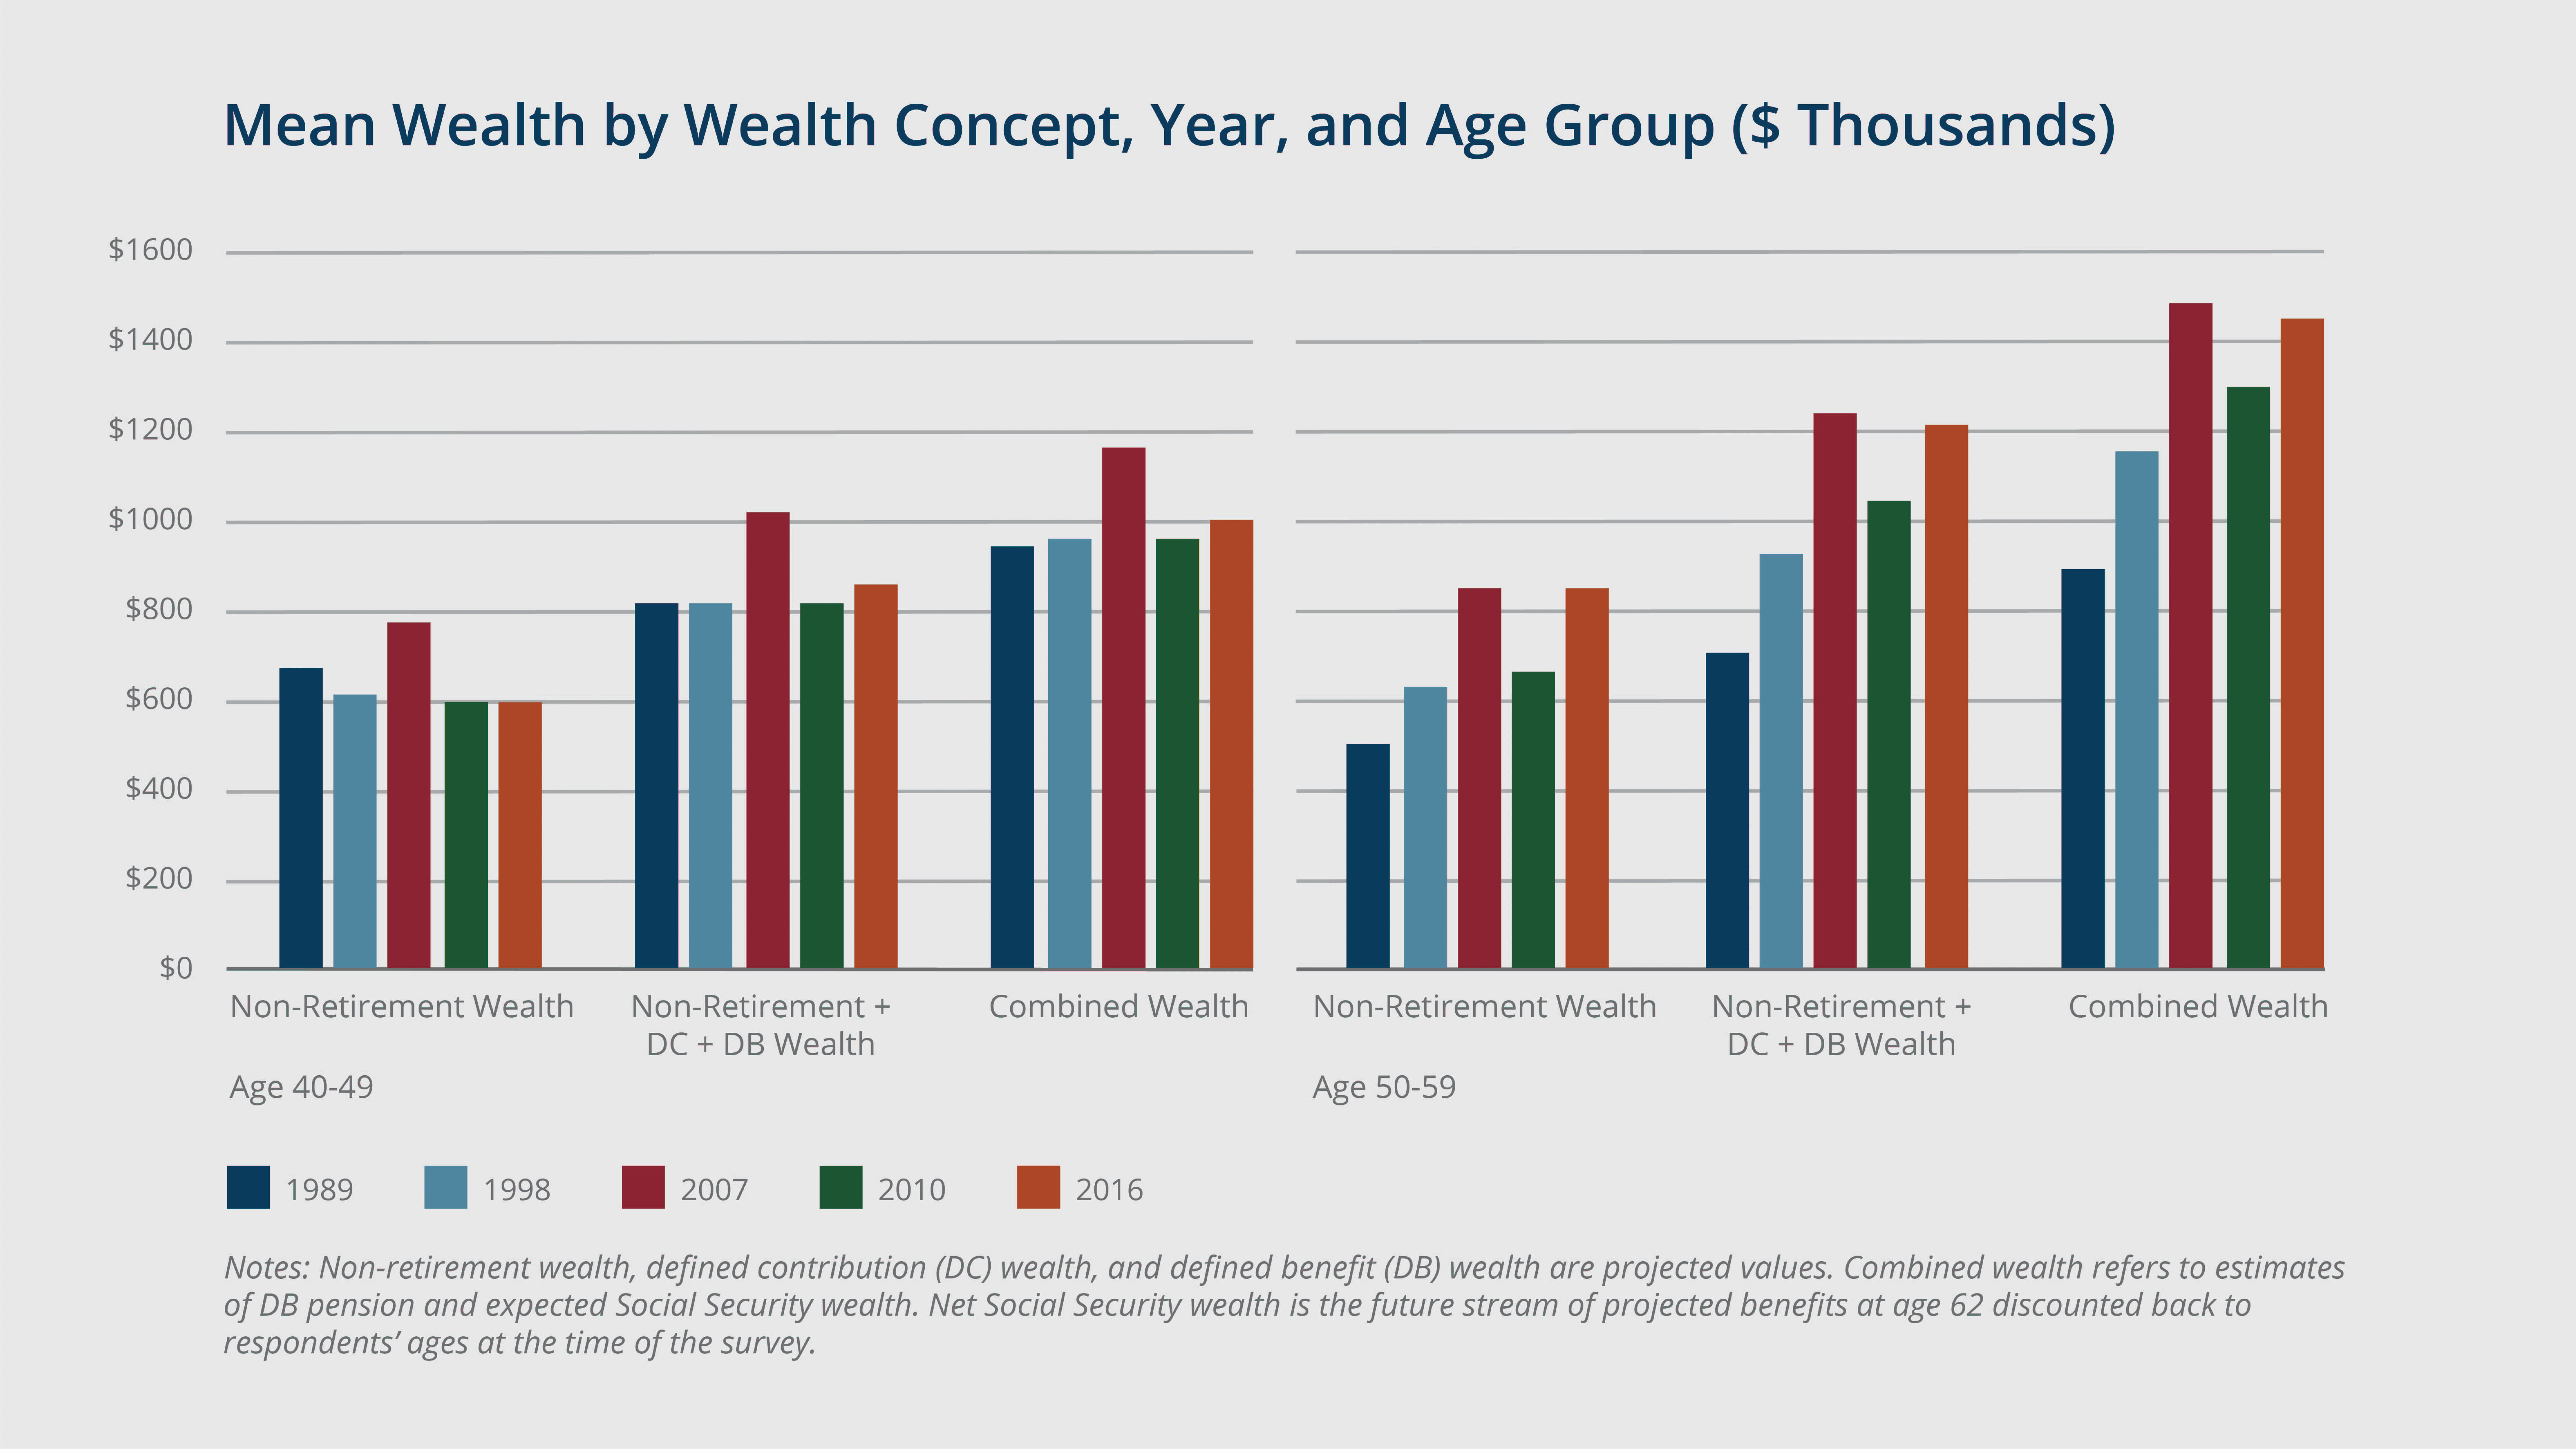
- For 40- to 49-year-olds, mean combined wealth—including non-retirement wealth, defined contribution (DC) and defined benefit (DB) pension wealth, and net SSW—rose from $943,600 in 1989 to $1.2 million in 2007, fell to $962,000 by 2010, and then partially recovered to $1 million by 2016. Among 50- to 59-year-olds, it rose from $900,000 in 1989 to $1.5 million in 2007, before falling to $1.3 million in 2010, and recovering to almost $1.5 million in 2016.
- Social Security accounts for almost all wealth at the 10th percentile of the combined-wealth distribution for both age groups and more than half of the combined wealth of households at the 25th percentile among 50- to 59-year-olds.
- At the 90th percentile of the distribution for both the 40–49 and 50–59 age groups, Social Security accounts for only 15 percent of households’ combined wealth and is surpassed by DB and DC wealth.
- Particularly for the 50–59 age group, Social Security wealth counteracted the decline in the private retirement (DC and DB) wealth-to-income ratio between 2007 and 2016.
- According to the annuitized wealth measure, the share of 50- to 59-year-olds below 150 percent of the poverty threshold grew to 23.2 percent in 2016. More than 23 percent of 40- to 49-year-old households also were below 150 percent of the poverty threshold that year.
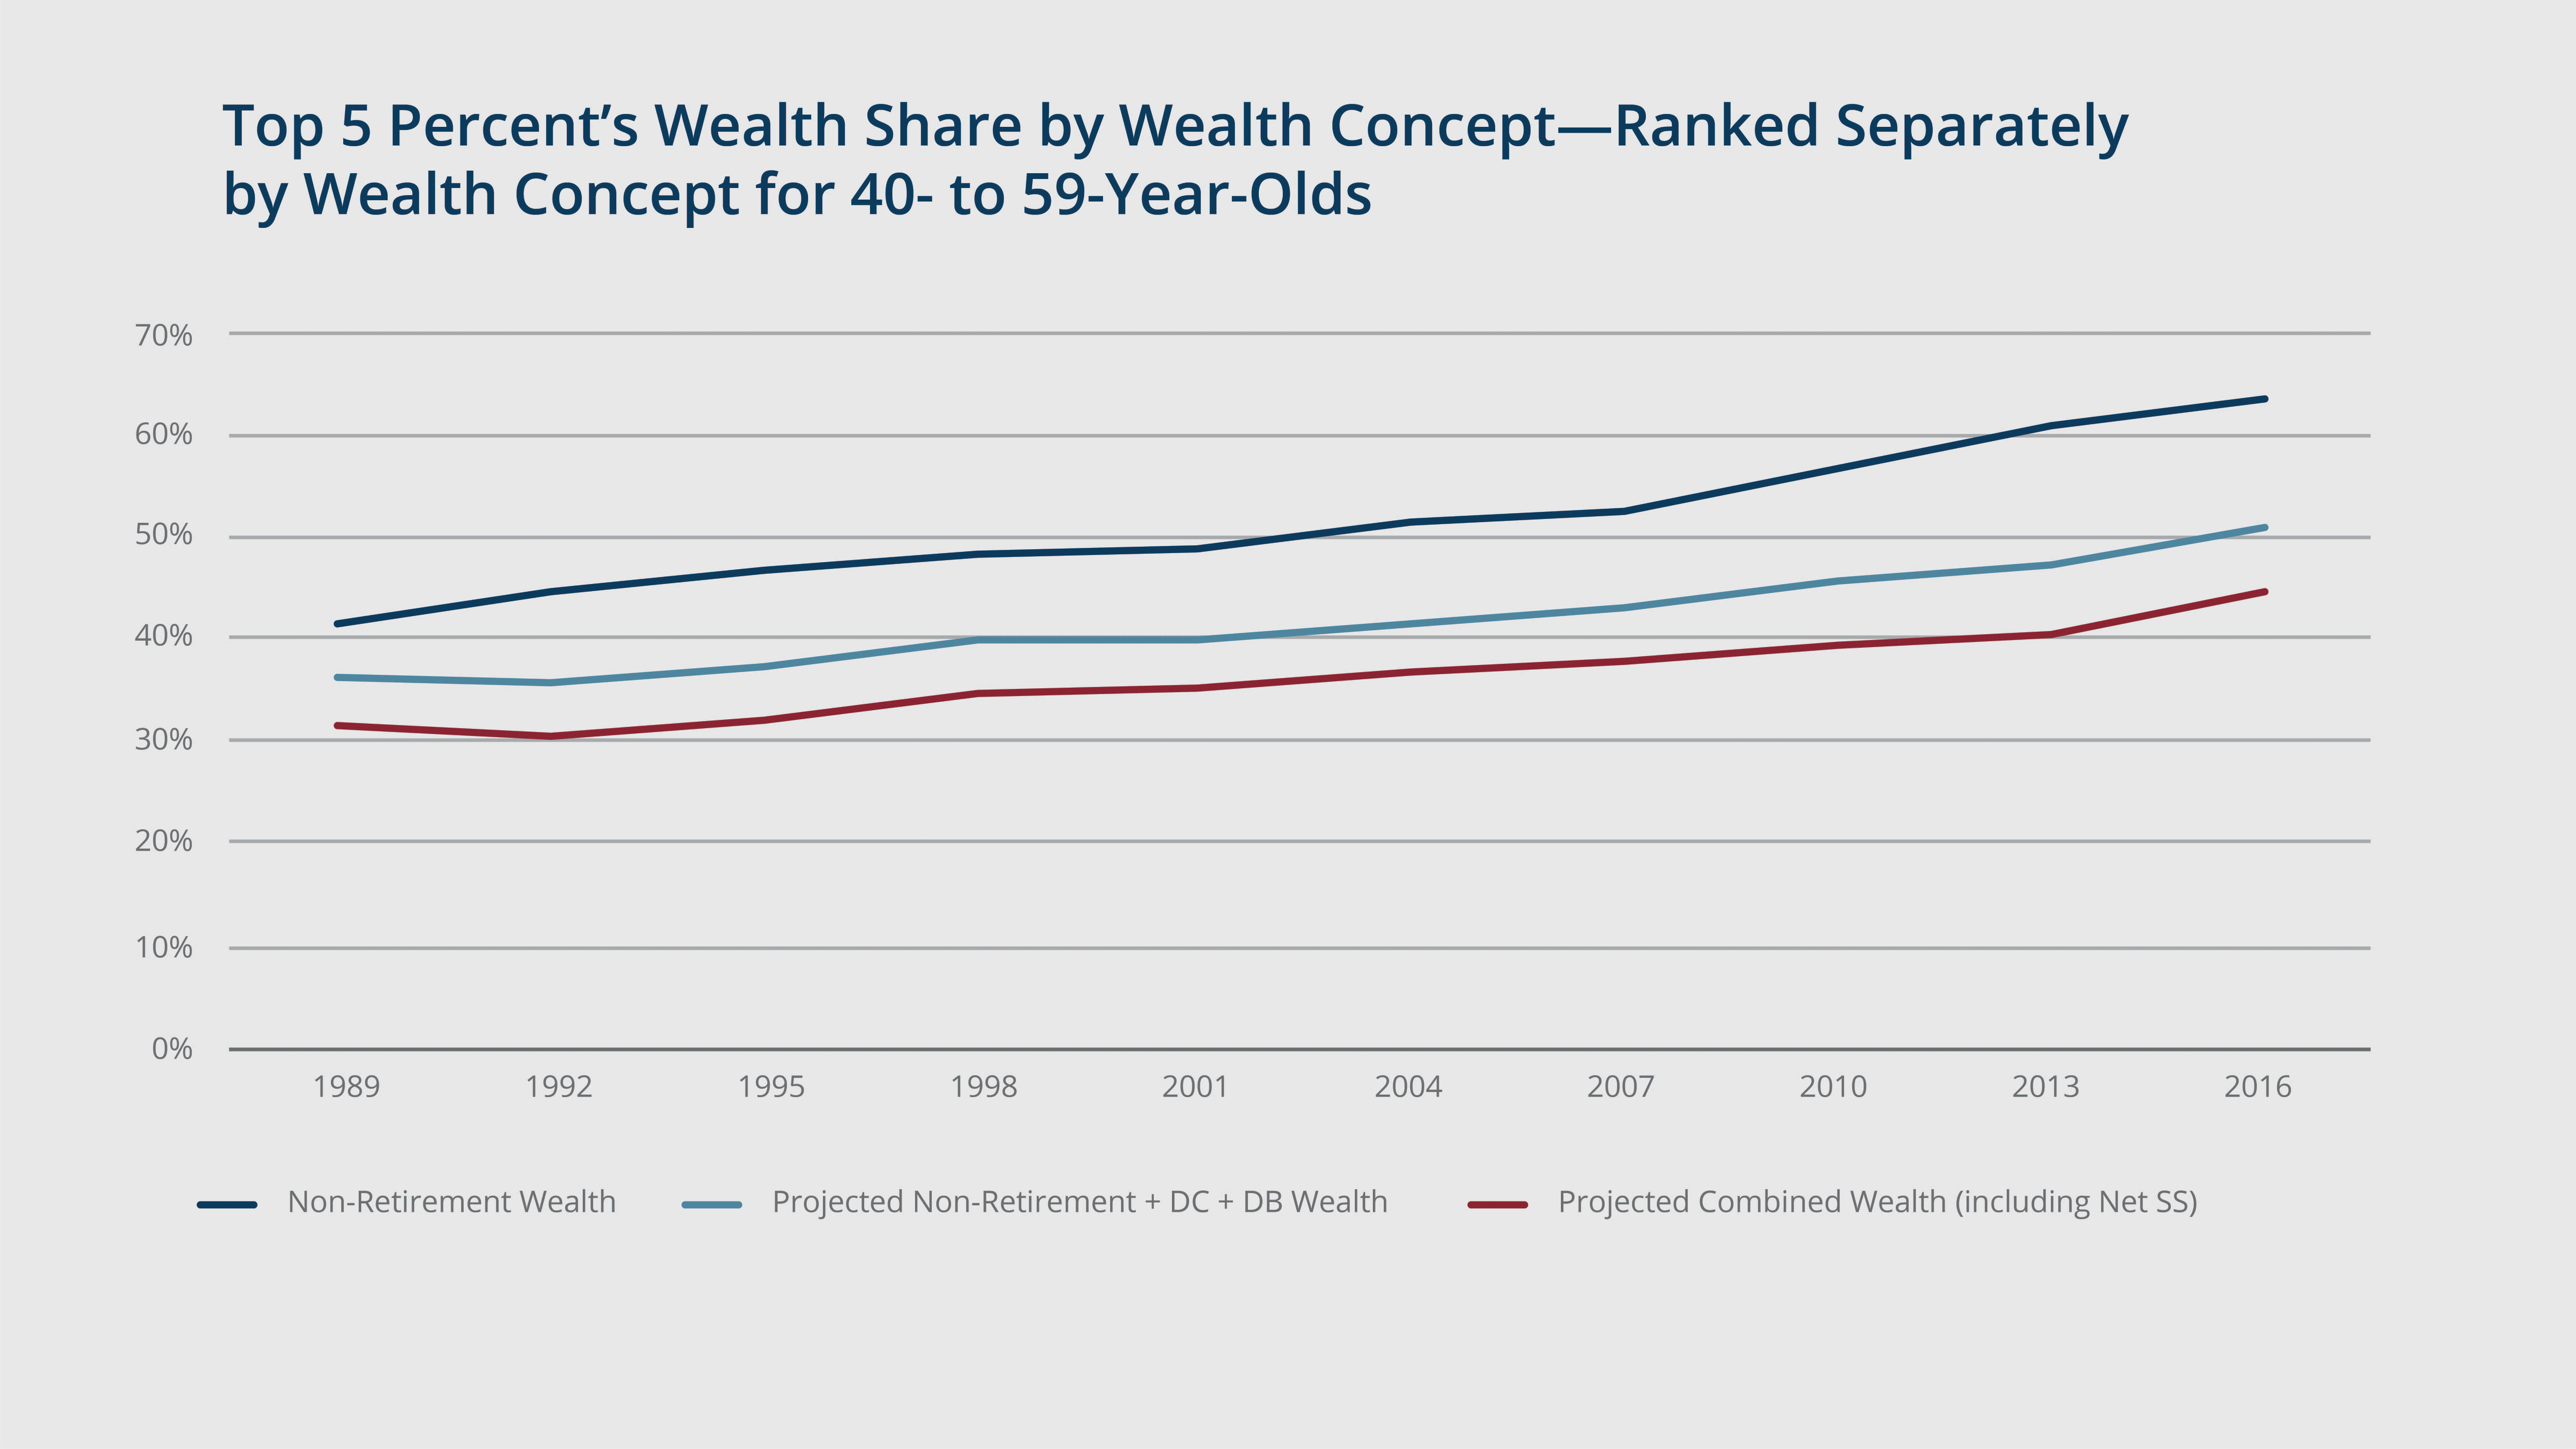
- For the entire 40–59 age range, the top 5 percent of the distribution held 63 percent of non-retirement wealth in 2016, but only 51 percent of wealth including DB and DC pensions, and only 45 percent of combined wealth that also included net Social Security wealth.
- Between 1989 and 2016, the top 5 percent’s share of non-retirement wealth rose 22 percentage points, while its share of combined wealth rose only 13 percentage points
- Among households with heads aged 40 to 49, the top 5 percent’s share of wealth excluding DB and DC plans and Social Security was 53 percent in 2016. Once these assets are included, the top 5 percent’s wealth share falls to 38 percent.

 Exhibits


 Implications
Defined benefit pension (DB) wealth and Social Security wealth disproportionately benefit households below the top portion of the wealth distribution and therefore are essential for understanding the full distribution of wealth. They are also necessary for accurately assessing whether a household will have adequate savings when it transitions into retirement.
The authors find that a substantial number of households in both the 40–49 and 50–59 age groups have predicted retirement incomes that are inadequate, based on the annuitized-wealth-to-poverty-threshold measure. Furthermore, the share of households in both age groups with predicted retirement incomes that are below the poverty level has risen sharply since the Great Recession, underscoring the lingering effects of the financial crisis on households’ retirement preparations.
Using the combined-wealth measure—as opposed to the typical measures of wealth—to analyze wealth concentration results in a lower level of concentration for every year of the sample period. Such analysis also shows that wealth concentration is rising slower than is indicated by other studies. Both findings speak to the importance of including DB and Social Security wealth in discussions of wealth inequality and economic well-being.

 Abstract
This paper develops a new combined-wealth measure by augmenting data on net worth from the Survey of Consumer Finances with estimates of defined benefit (DB) pension and expected Social Security wealth. We use this concept to explore retirement preparation among two groups of households in pre-retirement years (aged 40 through 49 and 50 through 59), and to explore the concentration of wealth. We find evidence of moderate, but rising, shortfalls in retirement preparation. We also show that including DB pension and Social Security wealth results in markedly lower measures of wealth concentration, and it slightly moderates trends toward a higher concentration over time.


