Interstate Fiscal Disparity in State Fiscal Year 1999 


Motivation for the Research
In state fiscal year 1999 (FY1999), the nation's state and local governments collectively enjoyed a surplus equal to 2.5 percent of their spending. However, while fiscally healthy in the aggregate, states varied considerably in their fiscal condition. More importantly, the size of the nationwide state and local fiscal surplus provides no insight into differences across states in their inherent capacity to raise revenue, regardless of short-term economic fluctuations, nor does it illuminate their exposure to long-run spending pressures that are difficult to control.
This paper compares states in terms of these two fiscal characteristics using data for FY1999. It is the fourth in a series of reports by Tannenwald, the last of which used data for FY1997. This series, in turn, succeeds a series of similar reports undertaken by the U.S. Advisory Commission on Intergovernmental Relations over a 30-year span from FY1962 to FY1991.
Research Approach
Like the previous series and the previous reports in this series, this report employs the representative tax system (RTS) and the representative expenditure system (RES) to measure interstate differences.
RTS assesses the relative ability of a state to raise revenue from a particular tax by levying a "standard" tax rate on a "standard" tax base. The RES approach estimates the amount that state and local governments must spend to provide a standard level of service for each representative bundle of state and local spending.
For each state, the authors construct a measure of fiscal need and a measure of tax capacity. They then construct a measure of fiscal comfort for each state by dividing the state's tax capacity index by its index of fiscal need. They also compute tax effort, to measure the degree to which a state utilizes its taxing capability.
Key Findings
- In FY1999 as in FY1997, the New England, Mid-Atlantic, Pacific, and Mountain regions had above-average fiscal capacity, while the South Atlantic, East North Central, West North Central, East South Central, and West South Central regions had below-average capacity. Regions (and states) with high fiscal capacity tended to have high average incomes.
- As in past years, the dispersion in fiscal need was considerably narrower than the dispersion in fiscal capacity.With the exception of Connecticut, the New England states displayed their characteristically low fiscal need, all ranking in the bottom quartile. Connecticut's high RES score relative to the other New England states is attributable primarily to its high unit labor costs.
- States with high fiscal need in all regions tend to have high poverty rates, high concentrations of population in the age bracket of 5- to 17-year-olds, high crime rates, or some combination of the three. They tend to be concentrated in the South and Southwest.
- Between FY1997 and FY1999, the dispersion across states in fiscal need narrowed, as did the dispersion in fiscal capacity. Two demographic factors are primarily responsible for changes in a state's fiscal need during this interval: (1) a change in the state's relative poverty rate, and (2) change in the relative importance of school-age children in the state's population mix.
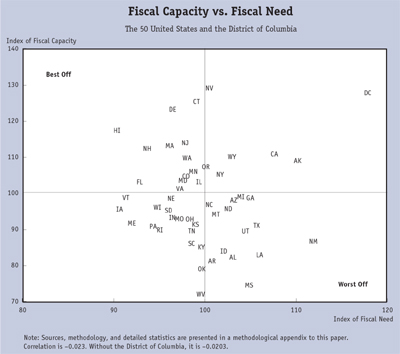
- As the figure shows, only six states have both higher-than-average fiscal need and capacity, and only 13 states have both low need and high capacity. The remaining states lie in the lower quadrants or on the border, indicating low capacity. Fourteen of these states have both high relative need and low relative capacity. Nationally, the correlation between fiscal need and fiscal capacity, while negative, is statistically insignificant.
- The fiscal comfort of the Census regions converged between the two years. Disparity among the states in fiscal comfort also diminished. As in FY1997, New England was the most fiscally comfortable region in the nation, despite a three-percentage-point decline in its fiscal comfort index.
- In FY1999, regions with above-average tax effort included the Mid-Atlantic region, New England, and the East North Central region. The remaining regions all exhibited lower-than-average tax effort. There is no statistically significant relationship between fiscal comfort and tax effort, and only five states exhibit high tax effort and low fiscal comfort.
Implications
The relationship between fiscal capacity and fiscal need has repercussions for the "devolution" debate. In the context of intergovernmental relations, devolution means the "devolving" of fiscal responsibilities from higher to lower levels of government, especially from the federal to the state or provincial level. Opponents of devolution in the United States are concerned that states with high fiscal need and low fiscal capacity would be unable to provide their residents with an acceptable level of state and local public services. Opponents would be less concerned if states with the highest fiscal need also had the highest fiscal capacity.
The evidence from this paper is mixed on this issue. The correlation between fiscal need and fiscal capacity is statistically insignificant. But there are more than a few states with both high need and low capacity, and this is a concern.
The absence of a negative correlation between state tax effort and fiscal comfort suggests that states with low levels of public expenditures tend to spend less because they want to, not because they are constrained by a lack of revenue.
Nevertheless, the persistence of fiscal disparity suggests that it might be appropriate for Congress to consider increasing the degree of fiscally equalizing intergovernmental aid.

 About the Authors
Robert Tannenwald
Nicholas Turner