Unemployment Insurance Claim Rates as a Share of Workforce (2019 - 2022) 


A Tool for Tracking and Monitoring UI Claims
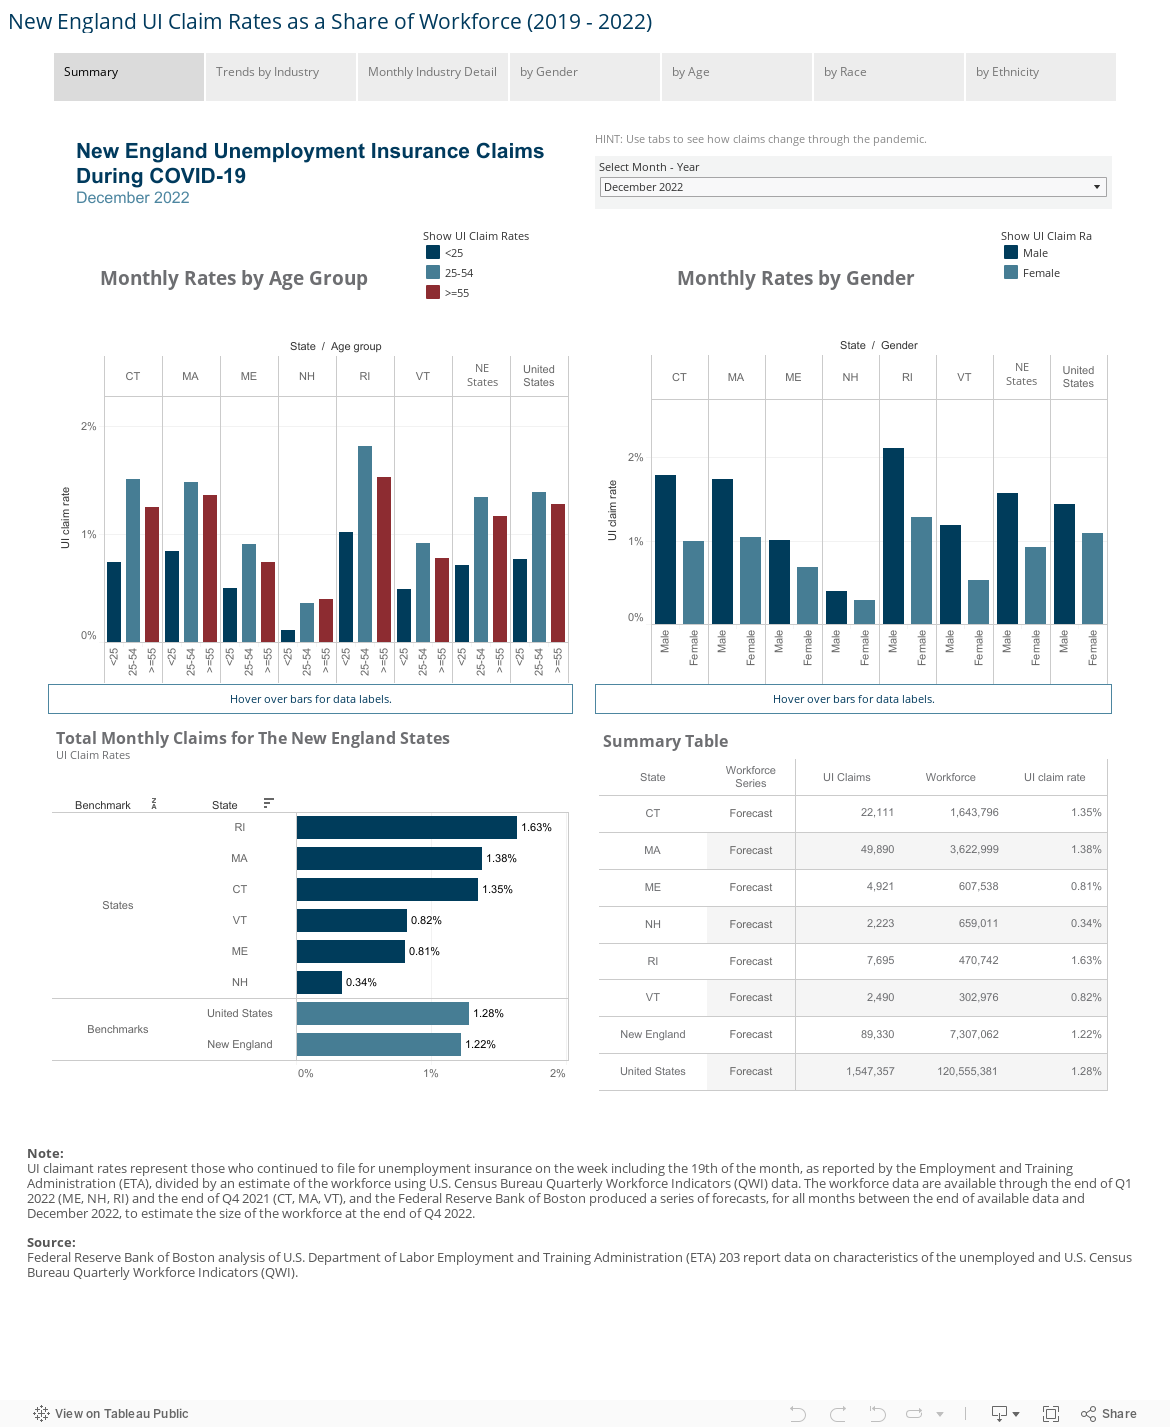
The Boston Fed has launched an interactive tool for tracking and monitoring unemployment insurance claims across the nation, region, and each New England state overall, as well as by gender, age, ethnicity, race-ethnicity, and industry. The tool represents a series of dynamic Tableau® dashboards that provide a month-by-month snapshot of how UI claim rates differ across industry and key demographic characteristics.
All dashboards available allow for quick and easy comparison between state, region, and national UI claims rates. There are filters for month and year, demographic characteristics, and state, which allow users to customize their views.
As of May of 2022, the dashboards present data from January of 2019 to June of 2021. They will be updated periodically as new data become available.
Unemployment Insurance (UI) claim rates
The UI rates analyzed in this brief and presented within the online tool differ from the standard unemployment rate that is more commonly the focus of economists and policymakers. In our analysis, the term “UI rate” means continuing UI claims as a share of the insured workforce.
To calculate it we use monthly information about the number of continuing unemployment insurance claims, as reported by the U.S. Labor Department Employment and Training Administration (ETA), and information about the size of the insured workforce for all New England states and for the nation, which is provided by U.S. Census Bureau Quarterly Workforce Indicators (QWI). In this way, the UI rates reveal a more informed picture of the status of labor markets, while allowing us to make comparisons on the regional and national levels.
Methodology
UI claimant rates represent those who continued to file for unemployment insurance during the week that includes the 19th of the month, as reported by the Employment and Training Administration (ETA), divided by an estimate of the workforce using U.S. Census Bureau Quarterly Workforce Indicators (QWI) data. At the time of our analysis, quarter-end employment QWI data were available through the end of Q2 2020, and we produced a series of forecasts for all months between July of 2020 and June of 2021 to estimate the size of the workforce at the end of Q2 2021. Along with that, we used interpolation to increase the frequency of the QWI data series from quarterly to monthly, to match the frequency of the unemployment claims data series. There is a possibility that the UI rates determined using this estimated workforce as the denominator will need to be revised upon release of future QWI data.
Key Findings

 Key Findings – May 2022
Our findings suggest that despite recovery across many industries, UI claims rates remain elevated as compared to before the onset of the COVID-19 crises. However, widespread gender disparities previously observed have largely abated with women now only slightly more often claiming UI than men.
Additionally, disparities across ethnicity persist with Hispanics still much more likely to be claiming UI. These findings point to the uneven recovery and show that though UI claims have started to return to lower levels, at the time of our analysis (August of 2021) claims had not fully returned to pre-pandemic levels. As the successive COVID-19 virus variants change the nature of pandemic response, it remains to be seen what will happen to unemployment claims.
New England Unemployment Insurance Claims During Covid-19
In 2020, we released a brief examining unemployment insurance (UI) claims rates across New England in the midst of the COVID-19 pandemic and related recession. As the pandemic evolves and persisted, we took a close look at what has happened since the summer of 2020 and introduce here a new tool for tracking UI claims through economic recovery.
Site Topics
Keywords
- Unemployment claims COVID-19 New England ,
- Labor market during COVID-19 in the New England Region