Mapping New England: Use of Earned Income Tax Credit, 2013, by County 


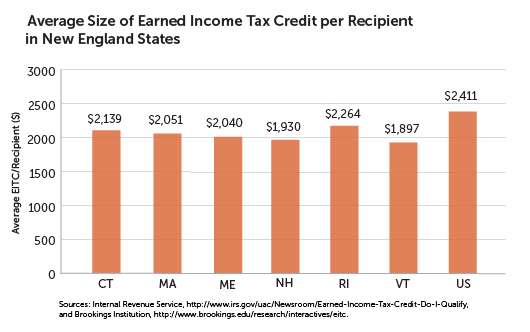
The Earned Income Tax Credit (EITC) is a federal assistance program designed to benefit lower-income, working families by increasing the amount of their annual tax refund. For the 2013 tax year, 20.2 percent of federal tax filers nationwide received the earned income tax credit, with the average credit totaling $2,411. In order to qualify, taxpayers must have received "earned income" (such as wages, tips, or income from running a business or farm), and their income must have been below certain thresholds as defined by the number of qualifying children. Fewer children and higher eligible incomes translate into a smaller tax credit. Families with more children and lower incomes receive the largest credits.
In the New England states in 2013, a smaller share of the population claimed federal EITC credits than the national average and received, on average, a smaller credit. Rhode Island and Maine experienced the highest rates of EITC claims-17.3 percent and 17.1 percent, respectively. Rhode Island also had the highest average tax credit in New England, followed by Connecticut and Massachusetts. New Hampshire had the lowest statewide average of EITC claims, at 12.4 percent, and the second-lowest average credit, ahead of Vermont.
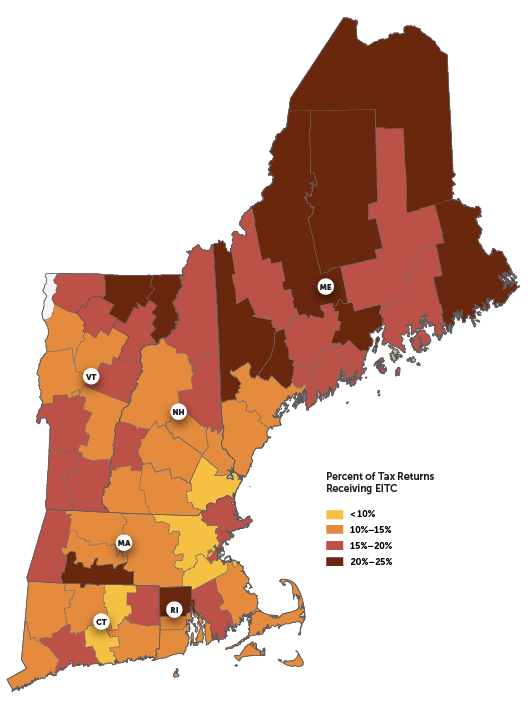
The rural New England counties of Maine, New Hampshire, and Vermont generally have higher rates of EITC claims, but smaller average credits, while the opposite is true in many of southern New England's more urban and suburban counties. Since the size of the claim is inversely proportional to the recipient's income (and proportional to the size of the family), there are probably somewhat higher incomes overall (and/or smaller families) among EITC filers in the northern New England states. Furthermore, since they have more claims as a share of the population, the data may reflect lower levels of income disparity in northern New England versus southern. Statewide averages, however, can hide the story at the county level. Several poor counties-Providence County in Rhode Island, Essex County in Vermont, Hampden County in Massachusetts, as well as Somerset and Piscataquis counties in Maine-all rank in the top 10 on both rates of EITC claims and average size of credits received.
Articles may be reprinted if Communities & Banking and the author are credited and the following disclaimer is used: "The views expressed are not necessarily those of the Federal Reserve Bank of Boston or the Federal Reserve System. Information about organizations and upcoming events is strictly informational and not an endorsement."

 About the Authors
Marco Gorini, Federal Reserve Bank of Boston
Kaili Mauricio