Haves and Have-Nots: Municipal Fiscal Disparities in Connecticut 
Using a "municipal gap" lens, the authors find great fiscal disparities across Connecticut municipalities, resulting from a wide variation in the property-tax base and the cost of services.
From its coastal mansions to the housing projects in its large cities, Connecticut reveals a wide socioeconomic spread. This inequality is likely responsible for the disparities in municipalities' ability to provide public services to their residents, businesses, and visitors. In order to implement appropriate policies, particularly regarding grant distributions by the state, policymakers would benefit from understanding the extent to which fiscal disparities exist
The Municipal-Gap Approach
To quantify fiscal disparities associated with local nonschool services in Connecticut, a recent research report from the Federal Reserve Bank of Boston's New England Public Policy Center (NEPPC) employs the "municipal gap" approach.[1]
A municipal gap is a measure of the difference between the "municipal cost" and "municipal capacity" of each town or city. Municipal cost measures the underlying cost to municipalities of providing nonschool services. The main nonschool services on which the cost analysis focuses are public safety, public works, general government services, and other nonschool government functions, such as welfare and government employees' fringe benefits.[2] Municipal cost is not actual expenditures. Similarly, municipal capacity is a different concept from actual revenues, as it measures the innate ability of municipalities to raise local revenue for funding nonschool services. In other words, both cost and capacity are determined by socioeconomic factors that are outside the direct control of local officials.
The NEPPC report measures municipal capacity as the hypothetical property-tax revenue of each municipality, assuming a uniform tax rate across the state. Using that measure, municipal capacity reflects only the differences in local property-tax base, irrespective of actual local tax policies.
Through statistical analysis, the NEPPC report finds that local nonschool expenditures increase with five cost factors that are outside the direct control of local officials. They are the unemployment rate, population density, the private-sector wage level, locally administered road mileage, and the number of jobs.
There are reasons why such factors are associated with increased nonschool expenditures. For example, municipalities that have higher population densities tend to have greater fire-protection costs. That is because a fire would pose a larger hazard for houses that are tightly packed together than for houses that are more spread out. Similarly, higher private-sector wages may pressure public officials to increase public-sector wages to attract and retain employees, adding to municipal costs. In addition, municipalities with longer locally administered roads have to spend more on road maintenance and snow plowing.
The NEPPC report assumes that municipal capacity statewide is just enough to cover municipal cost statewide, and the overall statewide municipal gap is therefore equal to zero. A negative gap indicates that a municipality has more than sufficient resources to fund its services, compared with the state average. Meanwhile, a positive gap indicates that a municipality is short of adequate resources to fund public services. The larger the municipal gap, the more severe the shortage.
Connecticut Municipal Gaps
There is tremendous variation in municipal cost, capacity, and gap size in Connecticut. That is particularly noticeable across different types of municipality.
What are the municipality types? A 2004 report by the Connecticut State Data Center sorts Connecticut's 169 municipalities into five distinct groups, mostly on the basis of median family income, population density, and the poverty rate: wealthy, rural, suburban, urban periphery, and urban core.[3] There appear to be spatial clusters of some municipality groups. For instance, wealthy municipalities tend to be concentrated in the southwestern area of Connecticut, in close proximity to New York City. Rural municipalities are often located in the northeastern, northwestern, and southeastern corners of Connecticut.
The NEPPC report further splits the rural group into two types to reflect socioeconomic differences: rural towns with per capita taxable property wealth above the state average ("above-average-property rural") and those with taxable property wealth below the state average ("below-average-property rural").

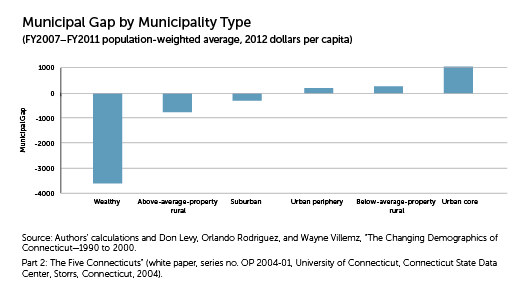
Among the resulting six municipality types, wealthy towns and the urban core rank the highest and the lowest, respectively, in terms of municipal capacity. (See "Municipal Gap by Municipality Type.") On average, wealthy towns had more than eight times the municipal capacity of urban-core municipalities during the 2007-2011 period. This large discrepancy reflects the wealthy towns' property wealth relative to the urban-core municipalities' property wealth. The urban core's property wealth per capita is small, even though the property-tax base in the urban core goes beyond residential housing and includes a larger commercial and industrial component than the property-tax base in other types of municipalities.

While there is also considerable variation in municipal cost across municipality types, it is much smaller than the variation in municipal capacity. On average, urban-core municipalities face the largest municipal cost, at more than $1,600 per capita, whereas above-average-property rural towns possess the lowest municipal cost, $1,230 per capita.
Different municipality types have different municipal cost, given their different cost factors. Urban-core municipalities, for example, have the highest unemployment rate, population density, and the number of jobs relative to their populations; above-average-property rural towns have the largest locally administered road mileage relative to local populations; and wealthy towns have the highest private-sector wage level.
With large variation in both municipal capacity and cost, one would expect significant municipal-gap differences. That is indeed the case. Unsurprisingly, wealthy towns are better off, having the largest negative average gap, at nearly —$3,600 per capita; urban-core municipalities have the largest positive gap at over $1,000 per capita. Recall that a negative gap means that a municipality has more than sufficient resources to fund public services, whereas a positive gap means that a municipality is short of adequate resources to fund its services.
In total, 78 Connecticut municipalities struggled with positive municipal gaps in the fiscal year 2011.These municipalities account for nearly half of all Connecticut municipalities but, more important, represent close to three-fifths of the state's population.
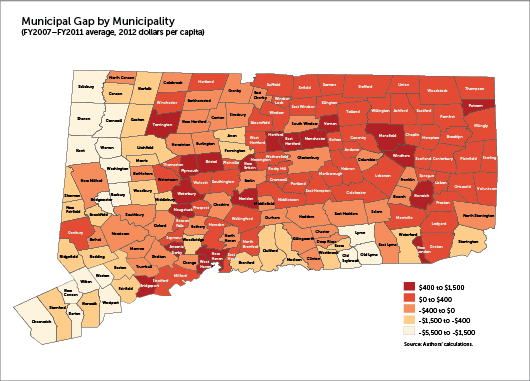
The size of the municipal gap is not evenly distributed across Connecticut's geography. (See "Municipal Gap by Municipality.") The three largest cities and most of the eastern portion of Connecticut, where there is a higher concentration of below-average-property rural towns, contend with relatively large municipal gaps. In contrast, the western portion of Connecticut—especially the northwestern and southwestern corners—features more-affluent areas (wealthy towns and above-average-property rural towns), which enjoy negative municipal gaps.
***
The municipal-gap measure could be a useful tool for Connecticut policymakers if they decide to reconsider the distribution of state nonschool grants. A gap-based formula could allocate more state nonschool grants to municipalities with larger municipal gaps and might be considered an effective tool in addressing local fiscal disparities that are beyond the towns' direct control.
Other New England states might also benefit from a municipal-gap approach. It can be applied relatively easily to understanding fiscal disparities since the state-local fiscal structure is fairly similar across states in the region.
Bo Zhao is a senior economist in the New England Public Policy Center of the Federal Reserve Bank of Boston, where Calvin Kuo is a research assistant. Contact the authors at bo.zhao@bos.frb.org or calvin.kuo@bos.frb.org
Endnotes
- Bo Zhao and Jennifer Weiner, "Measuring Municipal Fiscal Disparities in Connecticut" (Federal Reserve Bank of Boston NEPPC Research Report no. 15-1, 2015), http://www.bostonfed.org/economic/neppc/researchreports/2015/rr1501.htm.
- The NEPPC report excludes general-fund spending on water, sewer, and solid-waste services because, unlike urban areas, rural towns often do not provide such services.
- Don Levy, Orlando Rodriguez, and Wayne Villemz, "The Changing Demographics of Connecticut—1990 to 2000. Part 2: The Five Connecticuts" (white paper, series no. OP 2004-01, University of Connecticut, Connecticut State Data Center, Storrs, Connecticut, 2004), http://web2.uconn.edu/ctsdc/Reports/CtSDC_CT_Part02_OP2004-01.pdf. Location seems to be an implicit consideration in defining these five municipality types. For example, urban-periphery municipalities are mostly located between urban-core and suburban municipalities.
Articles may be reprinted if Communities & Banking and the author are credited and the following disclaimer is used: "The views expressed are not necessarily those of the Federal Reserve Bank of Boston or the Federal Reserve System. Information about organizations and upcoming events is strictly informational and not an endorsement."

 About the Authors
Bo Zhao,
Federal Reserve Bank of Boston
Bo Zhao is a principal economist with the New England Public Policy Center in the Federal Reserve Bank of Boston Research Department.
Email: Bo.Zhao@bos.frb.org
Calvin Kuo, Federal Reserve Bank of Boston


